
Navigating Commercial Reasonableness of Physician Compensation Arrangements
The Changing Health Care Environment
To stay compliant with evolving regulatory requirements, health care organizations must have the appropriate structures in place to help mitigate financial, resource and reputational risk for potential physician compensation violations related to the Stark Law, the Anti-Kickback Statute and other IRS not-for-profit regulations.
Understanding Commercial Reasonableness in the context of a rapidly changing health care environment is critical, but navigating what this requirement entails can often be challenging. In this piece, SullivanCotter highlights typical areas of focus to consider when assessing the commercial reasonableness of physician compensation arrangements.
READ FULL ARTICLE

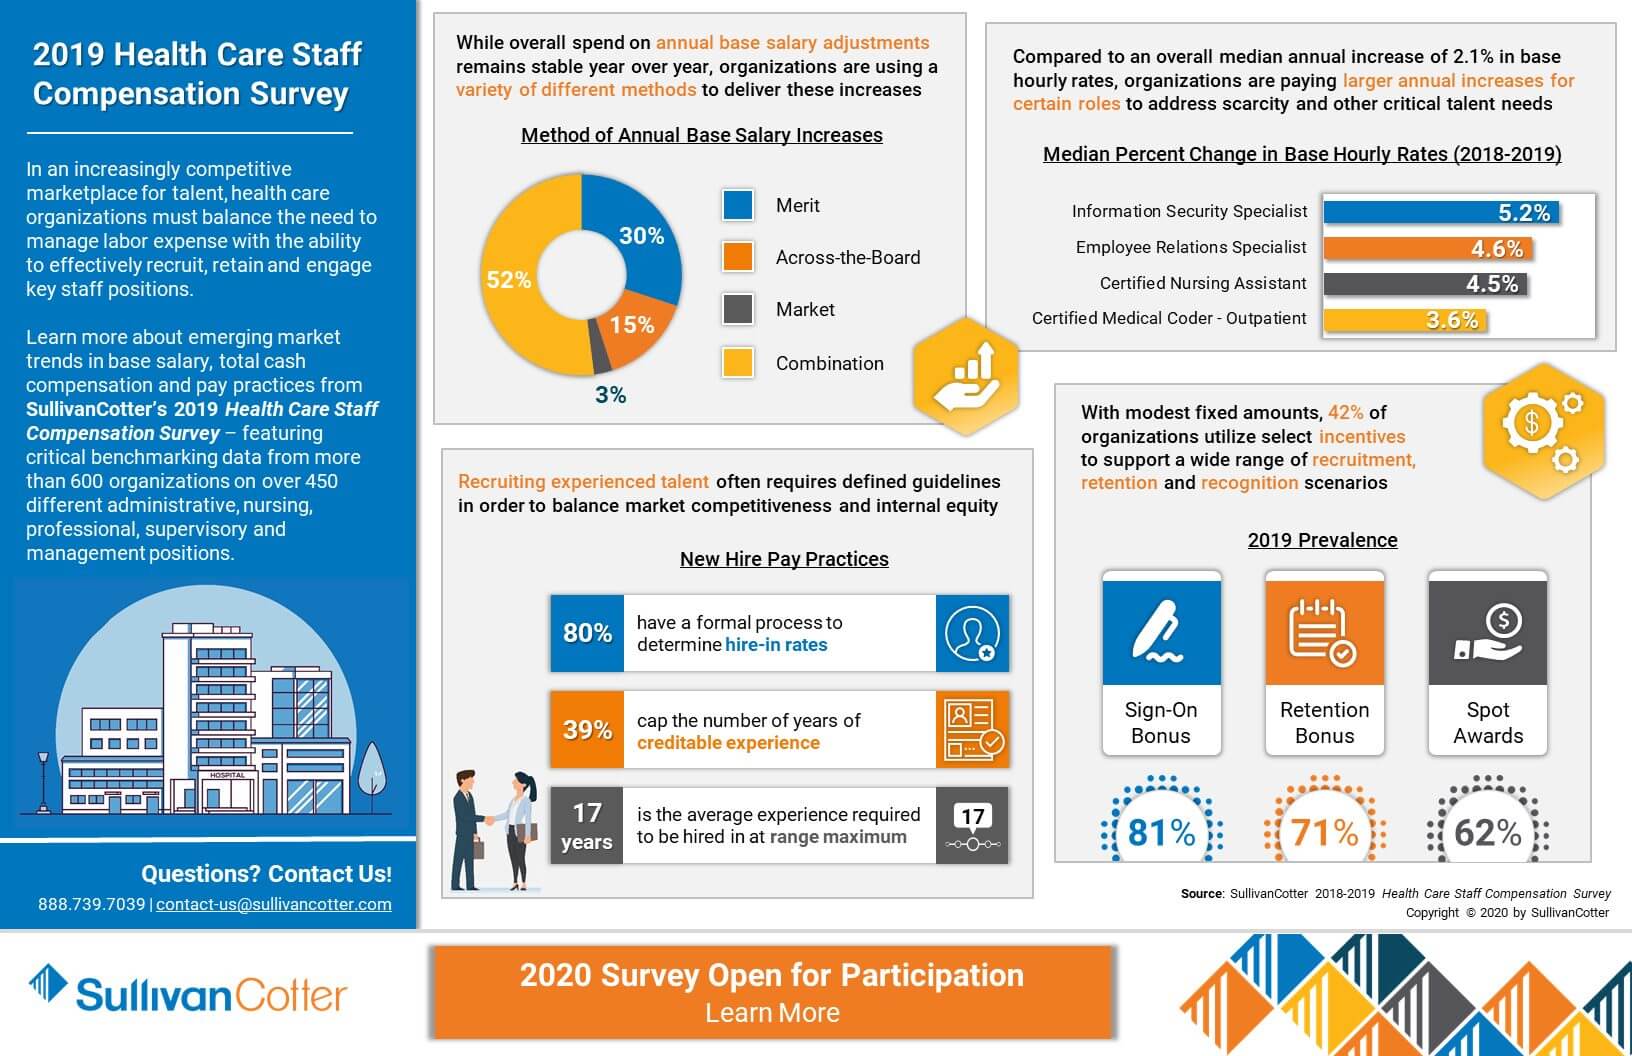
INFOGRAPHIC | 2019 Health Care Staff Compensation Survey
Insight into compensation and pay practices for key health care staff positions
In an increasingly competitive marketplace for talent, health care organizations must balance the need to manage labor expense with the ability to effectively recruit, retain and engage key staff positions.
Learn more about emerging market trends in base salary, total cash compensation and pay practices from SullivanCotter’s 2019 Health Care Staff Compensation Survey – featuring critical benchmarking data from more than 600 organizations on over 450 different administrative, nursing, professional, supervisory and management positions.
Don't miss your chance to participate. The 2020 survey is now open!
DOWNLOAD INFOGRAPHIC

APP Compensation Programs Shifting to Address Growing Market Demand and Changing Models of Care
READ ON PR NEWSWIRE
February 4, 2020 – Chicago –SullivanCotter, the nation's leading independent consulting firm in the assessment and development of rewards programs and workforce solutions for the health care industry and not-for-profit sector, recently released survey results indicating that advanced practice provider (APP) compensation programs continue to evolve as organizations recognize the roles APPs play in helping to achieve key organizational goals.
There are a number of key factors driving this shift in APP compensation and pay practices, including (1) the increased integration and utilization of APPs to help enhance access, quality, service and affordability in a value-based health care environment; (2) a need for APPs amidst a growing physician shortage; (3) clinical integration and new team-based models of care, which suggest a potential need for greater alignment between physician and APP rewards strategies and; (4) the rising prevalence of APP leadership positions and structures to support the effective management of this rapidly expanding workforce. Many organizations are restructuring their pay programs accordingly as ongoing challenges in recruiting, retaining and engaging key APP talent requires a more competitive approach to compensation.
APPs are currently among the fastest growing segments of the health care workforce and, on average, comprise more than one-third of an organization's clinical providers.i As APPs move beyond traditional inpatient and outpatient settings, this growth is driven in part by increased utilization in new and/or emerging practice settings such as urgent care, retail-based and skilled nursing. An analysis of results from SullivanCotter's 2019 Advanced Practice Provider Compensation and Pay Practices Survey confirms the demand for APPs as participating organizations reported significant growth in this workforce. In fact, this growth exceeded yearly estimates by 7%. Similarly, actual increases in base pay continue to outpace expectations. In 2018, the projected average increase was 3.2% compared with an actual average increase of 4.8%. The actual average increase in 2019 was 4%, which is slightly higher than what was projected.
"The strong demand for APPs continues to be a significant trend and can place added pressure on an organization's staffing budget. Actual increases in base pay have been consistently outpacing projections for the past five years, and health care organizations must be mindful of the impact this can have on the bottom line - especially if APPs make up a significant portion of your overall workforce," said Amy Noecker, Principal, SullivanCotter.
As with physicians, APP compensation is evolving to reflect differences between major specialty categories – primary care, medical, surgical and hospital-based. While all categories have seen increases in combined nurse practitioner and physician assistant median total cash compensation (TCC, equal to base salary plus annual incentives) from 2017 to 2019, medical and hospital-based rates have seen the most growth at 5.3% and 5.0%, respectively. Primary care, up 4.6%, and surgical, up 4.4%, follow closely behind.
Additionally, incentives are becoming a component of APP total cash compensation as rewards strategies continue to evolve. Nearly half of participating organizations, at 48%, report utilizing incentive pay for at least some of their APPs. While this prevalence has remained steady year over year, median annual incentive amounts have increased across all specialty categories from 2018-2019. Despite having the lowest overall TCC rates, primary care APPs continue to have the highest reported median annual incentive amounts in 2019 expressed as both a dollar amount, $7,701, and as a percentage of base salary, 6.9%. As in past years, these incentive opportunities are predominantly structured as add-on dollars, 73%, rather than at-risk, 15%.
Clinical integration and the focus on new team-based models of care are also driving the evolution of APP compensation programs. "Although there are still some important differences in the design of physician and APP compensation programs, aligning rewards more closely to ensure complementary versus competitive team-based care delivery is important. As organizations look to establish and reinforce a clinical team-based mindset, many are considering a strategic restructuring of their APP compensation plans to reflect certain elements of physician pay programs," said Trish Anen, Principal and APP Workforce Practice Leader, SullivanCotter.
In 2019, 32% of APP incentive programs contained a team-based component. This prevalence has increased by 5% since 2017. Based on survey responses, most APP incentive plans are relatively simple, with 64% of organizations utilizing just one or two metrics. The most prevalent metrics selected in all practice settings are work RVUs, value/quality-based and patient experience. In an effort to better understand and track impact, the interest in APP productivity continues to grow as more organizations collect and report this information. From 2017-2019, there was a substantial 66% increase in the amount of reported work RVU data and a 26% increase in patient visit data.
Lastly, APP leadership compensation continues to evolve as organizations develop new positions and outline key responsibilities to effectively support the management of this growing workforce. As a result, a clear structure of leadership roles has solidified. In 2019, 58% of organizations reported having designated APP leaders. Of these organizations, 26% utilize a top APP leader. This typically represents one or two leaders dedicated to developing the overall APP workforce strategy. Annual TCC for these top APP leader positions falls between $155,527 and $212,850 (25th-75th percentile) and tends to correlate with the number of employed APPs.
SullivanCotter's 2019 Advanced Practice Provider Compensation and Pay Practices Survey Report is now in its 8th year. With data from more than 560 organizations on nearly 74,000 individual APPs, this survey provides critical information on physician assistants, nurse practitioners and other certified providers across 127 different specialties. The survey includes insight into base salary, TCC, productivity, incentive plan design and other pay practices such as extra shifts, on-call pay, shift differentials, recruitment and retention bonuses, and more. For more information on SullivanCotter's surveys, please visit our website at www.sullivancotter.com or contact us by phone at 888.739.7039.
Don't miss your chance to participate! The 2020 Advanced Practice Provider Compensation and Pay Practices Survey is now open for submission.
About SullivanCotter
SullivanCotter partners with health care and other not-for-profit organizations to understand what drives performance and improve outcomes through the development and implementation of integrated workforce strategies. Using our time-tested methodologies and industry-leading research and information, we provide data-driven insights and expertise to help organizations align business strategy and performance objectives – enabling our clients to deliver on their mission, vision and values.
iSource: SullivanCotter 2019 Organizational Characteristics Database
Clinical provider includes: nurse practitioner, physician assistant, certified registered nurse anesthetist, certified nurse midwife, doctor of medicine and doctor of osteopathic medicine

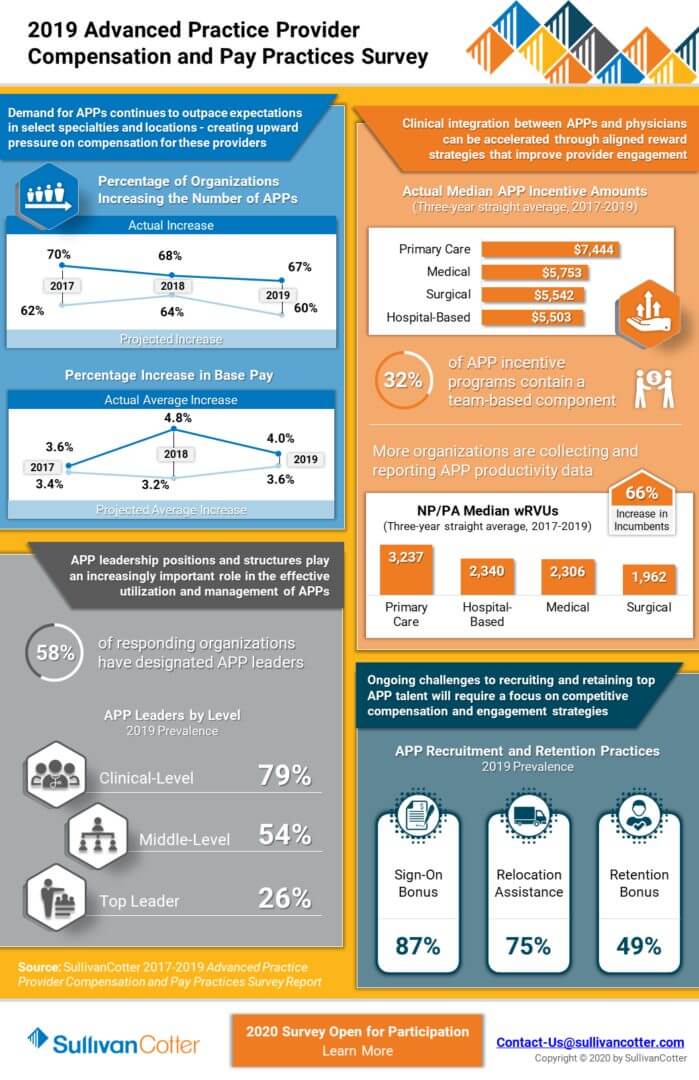
INFOGRAPHIC | 2019 Advanced Practice Provider Compensation and Pay Practices Survey
Advanced practice providers continue to play an important role in transforming care delivery
To help meet the demand for providers and avoid potential disruption to quality, service and cost, many health care organizations are expanding their advanced practice provider (APP) workforces – including physician assistants, nurse practitioners and other clinicians. APPs are effective in helping to transform care delivery and achieve key organizational goals in the shift to value-based health care, and access to key compensation, performance and pay practices benchmarks for this growing provider group is critical.
View related highlights from SullivanCotter’s 2019 Advanced Practice Provider Compensation and Pay Practices Survey, which features data from more than 560 organizations on nearly 74,000 individual physician assistants, nurse practitioners and other clinicians.
Don't miss your chance to participate. The 2020 survey is now open!
DOWNLOAD INFOGRAPHIC

PRESS RELEASE | Physician Compensation Evolving to Address Complex Operating Environment
Results from SullivanCotter's 2019 Physician Compensation and Productivity Survey
December 3, 2019 – Chicago – SullivanCotter, the nation's leading independent consulting firm in the assessment and development of rewards programs and workforce solutions for the health care industry and not-for-profit sector, recently released survey results indicating that physician compensation programs are evolving as organizations address a variety of new challenges in a rapidly changing health care environment.
Some of the key environmental factors driving the need for new approaches to physician compensation and performance programs include (1) new models of care focusing on population health, supporting the transition from volume to value, and enhancing access, quality, service and affordability; (2) a growing demand for key talent amidst a looming shortage of physicians, resulting in a more competitive labor market; (3) aligning physician performance with overall organizational goals; and (4) developing physician compensation plans that are ready to address the challenges associated with CMS quality programs such as MIPS and potential changes to the Stark Law.
An analysis of the survey data indicates that market supply and demand for physicians continues to drive increases in total cash compensation (TCC, equal to base salary plus annual incentives) as organizations look to remain competitive amidst talent shortages. There is a continued year over year increase in median TCC across all major specialty categories – including primary care, hospital-based, medical and surgical specialties. This has been the case for the past ten years.
Despite increases in TCC across the board for these major specialty categories, productivity remains relatively flat and in many cases is even declining. From 2014-2019, median TCC for primary care physicians increased by 14.7%, whereas work RVU (wRVU) productivity declined by 0.2%. As organizations look to expand their primary care providers, there is upward pressure on family medicine and internal medicine compensation without significant changes in wRVU productivity. To meet population health goals, organizations are adding other measures of performance such as panel management and telehealth to their primary care scorecards. Over the same 5-year time period, hospital-based physicians saw the largest growth in median wRVU productivity at 5.2%. This was the only major specialty group to see an increase greater than 1.5%.
"With growing concerns regarding provider supply and demand, organizations are evolving their compensation programs to align with an increasingly competitive talent market. With a looming physician shortage placing pressure on organizational recruitment and retention strategies, this demand continues to push physician compensation upwards without being supported by corresponding gains in productivity or reimbursement – resulting in higher levels of organizational investment per physician," said Dave Hesselink, Principal, SullivanCotter.
Additionally, from 2018 to 2019 the prevalence of value-based incentives, which rewards performance on measures such as clinical quality, patient experience and access, has increased by 5-7% across all four major specialty categories. For primary care, the prevalence of value-based incentive components in plan design was up 5% from last year, with 62% of organizations incorporating these incentives into their physician compensation programs. Medical, surgical and hospital-based specialties all fell in the range of 55-57%.
"While reimbursement models continue to evolve and organizations are focused on incorporating more value-based components into their physician compensation programs, it is important to note that quality incentive payments still only comprise a small portion of TCC. We expect to see continued growth in value-based incentives as organizations work to further develop and refine these programs to ensure they have credible measurement and reporting systems in place before moving forward," said Mark Ryberg, Principal, SullivanCotter.
The actual amounts paid for value-based performance remain relatively small at 6.2% of TCC across all specialties at the median. However, this is up from 5.6% in 2018. Primary care is highest at 7.0% of TCC with hospital-based specialties following at 6.3% and medical and surgical specialties at just below 6.0%.
SullivanCotter's 2019 Physician Compensation and Productivity Survey is now in its 27th year. With data from nearly 700 organizations on more than 206,000 individual physicians and advanced practice providers (APPs), this survey is the largest and most comprehensive dataset of its kind. It provides insight into base salary, TCC and productivity data and ratios including wRVUs, collections, patient visits and panel sizes. For more information on SullivanCotter's surveys, please visit our website at www.sullivancotter.com or contact us by phone at 888.739.7039.
About SullivanCotter
SullivanCotter partners with health care and other not-for-profit organizations to understand what drives performance and improve outcomes through the development and implementation of integrated workforce strategies. Using our time-tested methodologies and industry-leading research and information, we provide data-driven insights and expertise to help organizations align business strategy and performance objectives – enabling our clients to deliver on their mission, vision and values.
READ ON PR NEWSWIRE

PODCAST | Executive Compensation Committee Update
Tim Cotter featured in McDermott Will & Emery's Governing Health Podcast Series
LISTEN TO PODCAST
Health care continues to evolve at a rapid pace, and executives with the skills and competencies to navigate complex change and lead transformation are in high demand. As a result, boards of directors are increasingly focused on the supervision, compensation and retention of the senior executive leadership team.
In this episode, the first in a two-part series, Michael Peregrine welcomes Tim Cotter, Chairman and Managing Director of SullivanCotter, and Ralph DeJong, Partner at McDermott Will & Emery, for a discussion on the latest trends and developments impacting the executive compensation committee's decision-making process.
This episode includes a discussion of the following:
- Where health care executive compensation is trending in 2020
- Impact of today's high CEO turnover on board oversight standards and talent retention practices in health care
- How coordination between the executive compensation committee and other board-level committees is increasing
- Impact of certain environmental factors on health care executive compensation decisions

PRESS RELEASE | Industry Disruption and New Talent Requirements are Impacting Health Care Executive Pay
Results from the 2019 Manager and Executive Compensation in Hospitals and Health Systems Survey
November 4, 2019 – Chicago – SullivanCotter, the nation’s leading independent consulting firm in the assessment and development of rewards programs and workforce solutions for the health care industry and not-for-profit sector, recently released survey results showing that industry disruption and new talent requirements are impacting executive compensation levels and incentive programs.
The drivers of these changes are: (1) increased complexity of health care organizations due to consolidation, mergers and acquisitions, and new partnerships; (2) changing models of care, as organizations transform to integrate care across the continuum, enhance access, deliver an improved patient experience, and focus on population health/value based care; (3) pressures for cost efficiency; and (4) entry into new businesses to pursue revenue diversification and growth. C-suite leaders of health care organizations must possess the skills and competencies to manage the increased complexity, uncertainty and change. Proven talent is in high demand. Aggressive senior leadership recruitment and retention efforts are being observed in the market, particularly among the largest organizations, which is causing upward pressure on pay. At the same time, less senior roles within health systems and leaders of system-owned entities are experiencing less upward pressure on compensation due to the operational focus of these roles and more talent availability. There is also a growing emphasis on performance-based compensation for senior leaders to tie rewards to attaining short-term and long-term goals.
An analysis of the survey data indicates that median base salaries for the most senior executives of independent health systems with enterprise-wide responsibility (CEOs, COOs and CFOs) increased at a rate of 3.5% to 4.0%, versus 3.0% for these same roles at system-owned hospitals. For senior vice presidents, however, median base salary increases were more aligned at 3.1% for independent health systems and 3.0% for system-owned hospitals.
When considering organization size, salaries are rising faster for CEOs, COOs and CFOs at larger, more complex organizations. For health systems with more than $3B net revenue, median base salaries for these top executives rose between 4% and 5%, compared to 3.0% to 3.5% for smaller independent health systems with less than $3B net revenue. The median change in salaries for management, vice president, and senior vice president roles across both systems and hospitals was almost consistently 3.0% across the board (except senior vice presidents of larger health systems, which was 3.5%).
In addition, performance-based incentive levels are increasing for senior health system leaders. In most executive roles, total cash compensation (TCC, equal to base salary plus annual incentives) increased faster than base salary. Additionally, changes in TCC differed by type of organization, with health systems rising faster than system-owned hospitals. Median change in TCC for CEOs, COOs, CFOs and senior vice presidents at independent health systems ranged from 4.7% to 6.5%. In contrast, the median increase for these roles at system-owned hospitals ranged from 3.0% to 3.9%. As with base salaries, both the level of senior executive TCC increases and target incentive opportunities were higher for larger independent health systems (i.e. revenues greater than $3B) compared to smaller ones.
Furthermore, larger health systems use long-term incentive plans (LTIPs) more commonly for top executives to support the attainment of critical organization-wide objectives. Among health systems with greater than $5B in net revenue, 47% utilize LTIPs, versus 30% for health systems with greater than $1B in net revenue. “Large health systems are shifting their performance focus from individual facility success to measuring outcomes system-wide in the areas of population health management, alignment, integration, quality/patient safety and financial stewardship. Well-designed annual and long-term incentive programs can be effective in supporting these efforts and driving desired performance outcomes,” said Bruce Greenblatt, Managing Principal, SullivanCotter.
“We are seeing upward movement in compensation for health system executive positions, especially those in larger health systems and those located in cities with a high cost of living, reflecting the highly competitive market for talent and the difficulties faced by these organizations to attract talent. Increases are more modest for hospital executive positions, especially those at system-owned hospitals. This speaks to the broader availability of talent for these positions and the increasing operations focus at the hospital-level as shared services and administrative functions are aligned at the system-level,” explains Tom Pavlik, Managing Principal, SullivanCotter.
SullivanCotter’s 2019 Manager and Executive Compensation in Hospitals and Health Systems Survey is now in its 27th year. It provides critical benchmarking data on compensation levels and pay practices, and is the largest and most comprehensive of its kind for hospitals and health systems nationwide. The survey includes data from over 2,200 organizations, comprising 460 health systems and more than 1,800 hospitals, and captures information for more than 42,000 incumbents. For more information on SullivanCotter’s surveys, please visit our website at www.sullivancotter.com, email us at surveys@sullivancotter.com or contact us by phone at 888.739.7039.
About SullivanCotter
SullivanCotter partners with health care and other not-for-profit organizations to understand what drives performance and improve outcomes through the development and implementation of integrated workforce strategies. Using our time-tested methodologies and industry-leading research and information, we provide data-driven insights and expertise to help organizations align business strategy and performance objectives – enabling our clients to deliver on their mission, vision and values.
READ ON PR NEWSWIRE

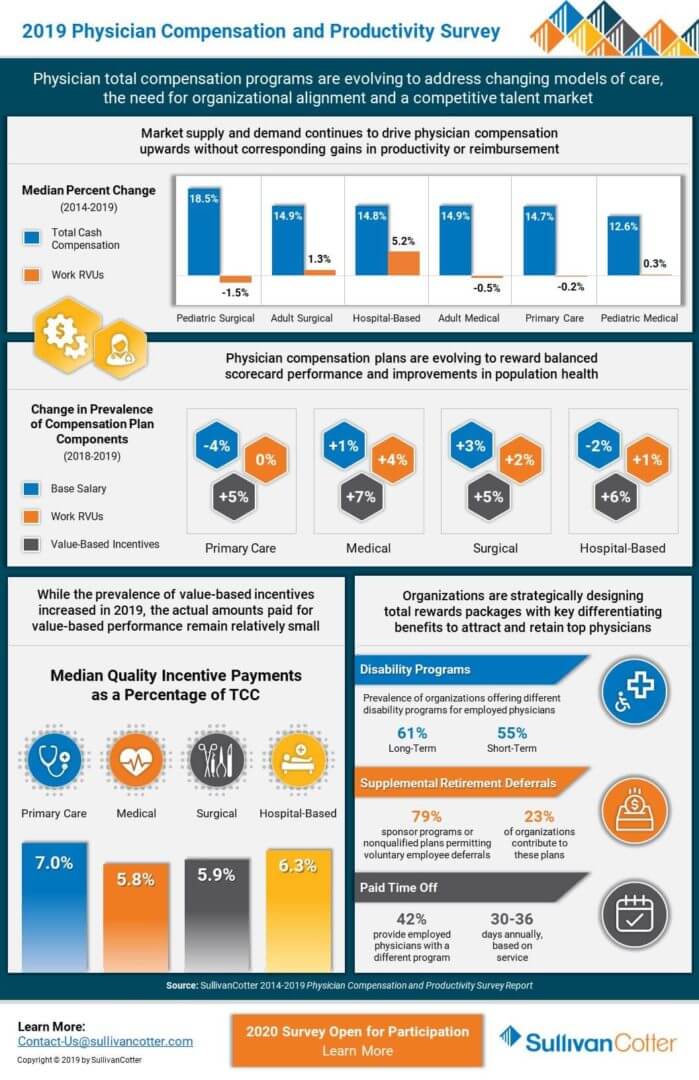
INFOGRAPHIC | 2019 Physician Compensation and Productivity Survey
Understanding physician compensation and productivity in a changing health care environment
As health care organizations today are faced with a number of competing forces, physician compensation programs continue to change in a rapidly evolving environment. With an acute focus on new and improved models of care to address population health concerns, keeping pace with a competitive talent market, and mitigating risk in an increasingly complex regulatory environment, organizations are looking to better align physician pay and performance with system-wide goals and objectives.
View related highlights from SullivanCotter’s 2019 Physician Compensation and Productivity Survey. Now in its 27th year, this survey is the largest and most comprehensive of its kind. Information was collected from nearly 700 organizations and includes data for more than 206,000 individual physicians and advanced practice providers.
Don't miss your chance to participate. The 2020 survey is now open!
DOWNLOAD INFOGRAPHIC

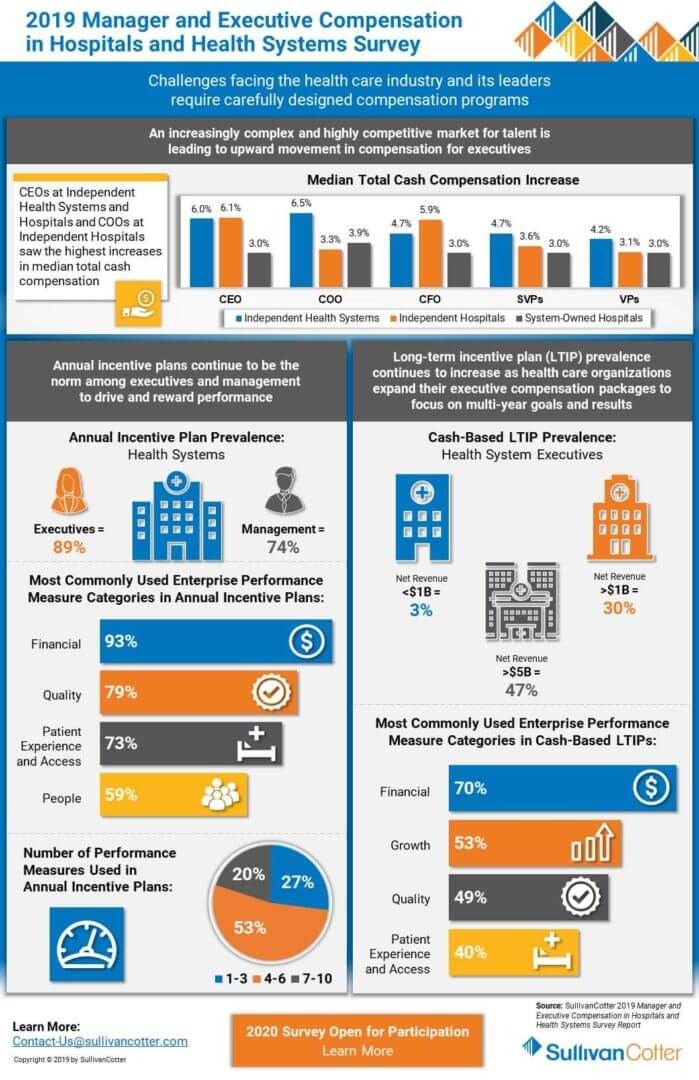
INFOGRAPHIC | 2019 Manager and Executive Compensation in Hospitals and Health Systems
Evolving executive compensation and performance programs
With a renewed focus on executive talent strategy and performance, health care organizations continue to evolve their compensation programs to keep pace with a rapidly changing industry. Challenges such as ongoing consolidation, the transition to value-based care, downward pressure on reimbursements, and rising consumerism and patient engagement require thoughtfully designed programs and pay practices in order to align executive compensation with overall organizational objectives.
View related highlights from SullivanCotter’s 2019 Manager and Executive Compensation in Hospitals and Health Systems Survey. Now in its 27th year, this survey is the largest and most comprehensive of its kind for hospitals and health systems nationwide. Information was collected from over 2,200 organizations comprising 460 health systems and 1,800 hospitals, and includes data for more than 42,000 individual managers and executives.
Don't miss your chance to participate. The 2020 survey is now open!
DOWNLOAD INFOGRAPHIC

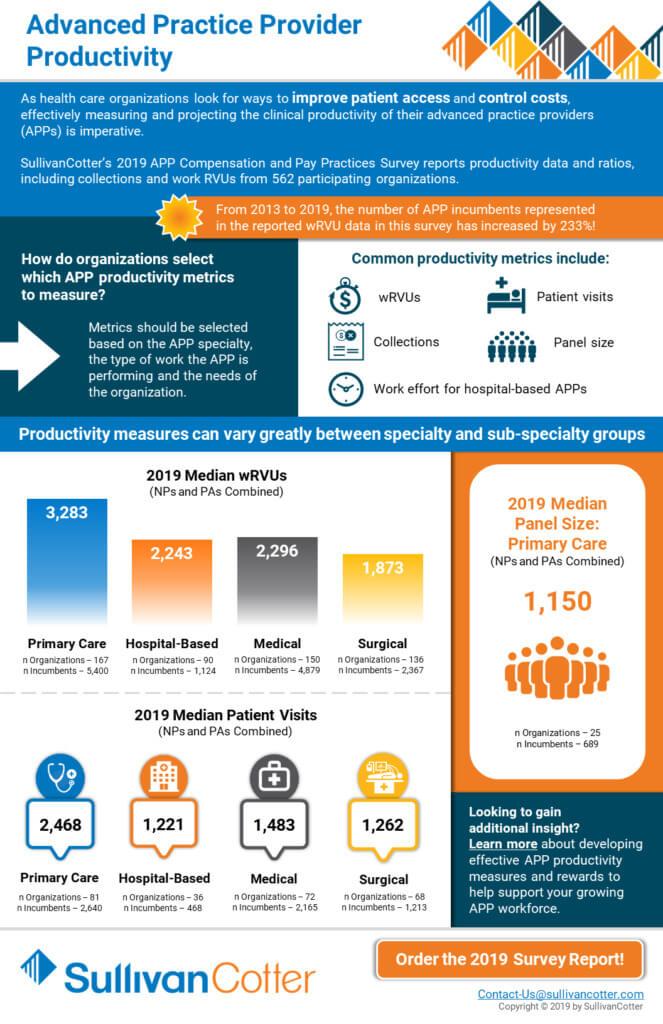
INFOGRAPHIC | Advanced Practice Provider Productivity
Learn more about emerging trends and data in advanced practice provider productivity
As health care organizations look for ways to improve patient access and control costs, effectively measuring and projecting the clinical productivity of their advanced practice providers (APPs), including nurse practitioners and physician assistants, is imperative.
View related highlights from SullivanCotter’s 2019 Advanced Practice Provider Compensation and Pay Practices Survey, which reports productivity data and ratios, including collections, work RVUs and patient visits, from 562 participating organizations.

Compliance Today | Best Practices for a Compliant, Aligned Professional Services Agreement
Understanding professional services agreements in an ever-changing marketplace
Featured in the October 2019 issue of the Health Care Compliance Association's Compliance Today publication, SullivanCotter Principals Stan Stephen, Dina Unrath and Tom Johnston discuss how a systematic review of professional services agreements can help health systems better assess regulatory and financial risk, standardize contracting terms, and refine processes and oversight for contracting with providers.
This comprehensive process includes the following five steps:
- Form a central contract authority team that comprises a cross-section of key representatives to develop key assessment criteria and processes to evaluate PSAs.
- Inventory current PSAs to create a central database tracking key contractual terms.
- Review agreements for compliance with regulatory guidelines and to identify opportunities for economies of scale.
- Evaluate agreements for strategic need and overall performance requirements, including a review of needed support for desired services from employed and/or independent providers.
- Renegotiate when appropriate to address changing markets and regulatory guidelines.
READ FULL ARTICLE
Copyright [2019] Compliance Today Magazine, a publication of the Health Care Compliance Association (HCCA).

Financial Investment News | Study Reveals Compensation Levels for Nonprofit Investment Staff
Driven by the demand for talent across the not-for-profit sector
In a recent article from Financial Investment News, SullivanCotter discusses how performance-based compensation continues to be a key component of pay for investment staff at private foundations and university endowments. The article features new data from SullivanCotter's 2019 Endowment and Foundation Investment Staff Survey as well as insights from Not-for-Profit Practice Director Nanci Hibschman.
READ FULL ARTICLE

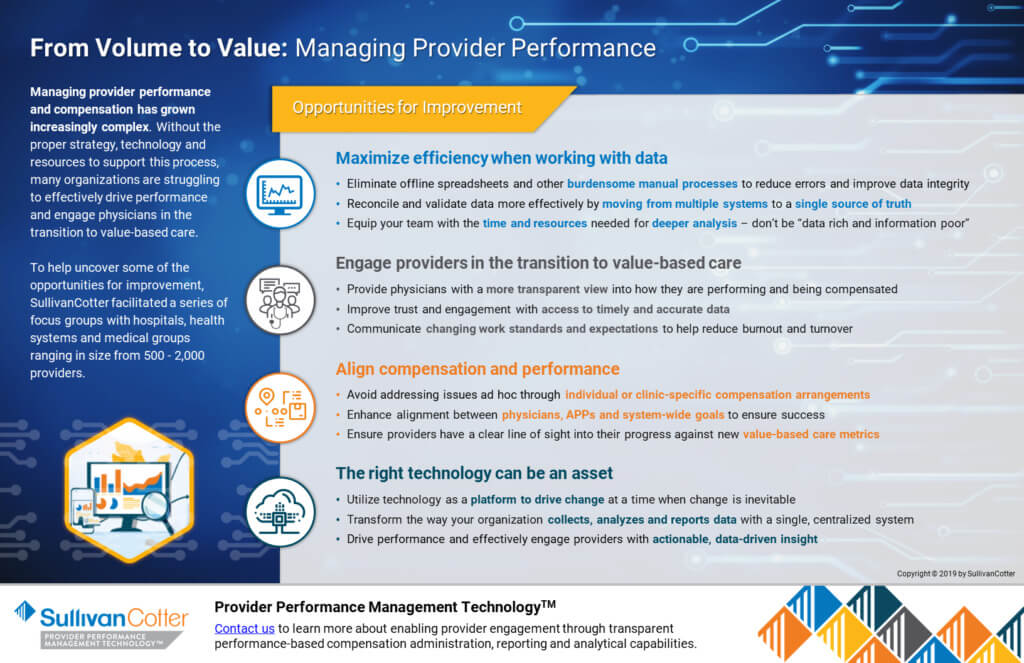
From Volume to Value: Managing Provider Performance
Managing provider performance and compensation has grown increasingly complex.
Without the proper strategy, technology and resources to support this process, many organizations are struggling to effectively drive performance and engage physicians in the transition to value-based care.
To help uncover some of the opportunities for improvement, SullivanCotter facilitated a series of focus groups with hospitals, health systems and medical groups ranging in size from 500 - 2,000 providers.
Learn more about how Provider Performance Management Technology can help.
DOWNLOAD ARTICLE

Modern Healthcare | 2019: Annual Executive Compensation Article
Hospitals and health systems focus on annual and long-term incentive strategies to help attract, retain and engage key executives
UPDATE: Don't miss the 2020 article
The industry goals of improving quality, access and satisfaction while also reducing costs remain a top priority in the transition to value-based care. Hospitals and health systems continue to explore bold new ideas impacting who administers care and how it is delivered, and must have executive leadership in place with the skills and experience necessary to lead such transformation.
With qualified talent in short supply as roles and responsibilities expand, a more deliberate approach to attracting, retaining and engaging key executives is required. Aligning pay with performance is critical, and organizations continue to focus on annual and long-term incentive strategies in order to keep pace in a rapidly evolving health care environment.
Learn more from Modern Healthcare's annual executive compensation article, featuring data from SullivanCotter's 2019 Manager and Executive Compensation in Hospitals and Health Systems Survey and insights from Managing Principals Bruce Greenblatt and Tom Pavlik.
READ FULL ARTICLE

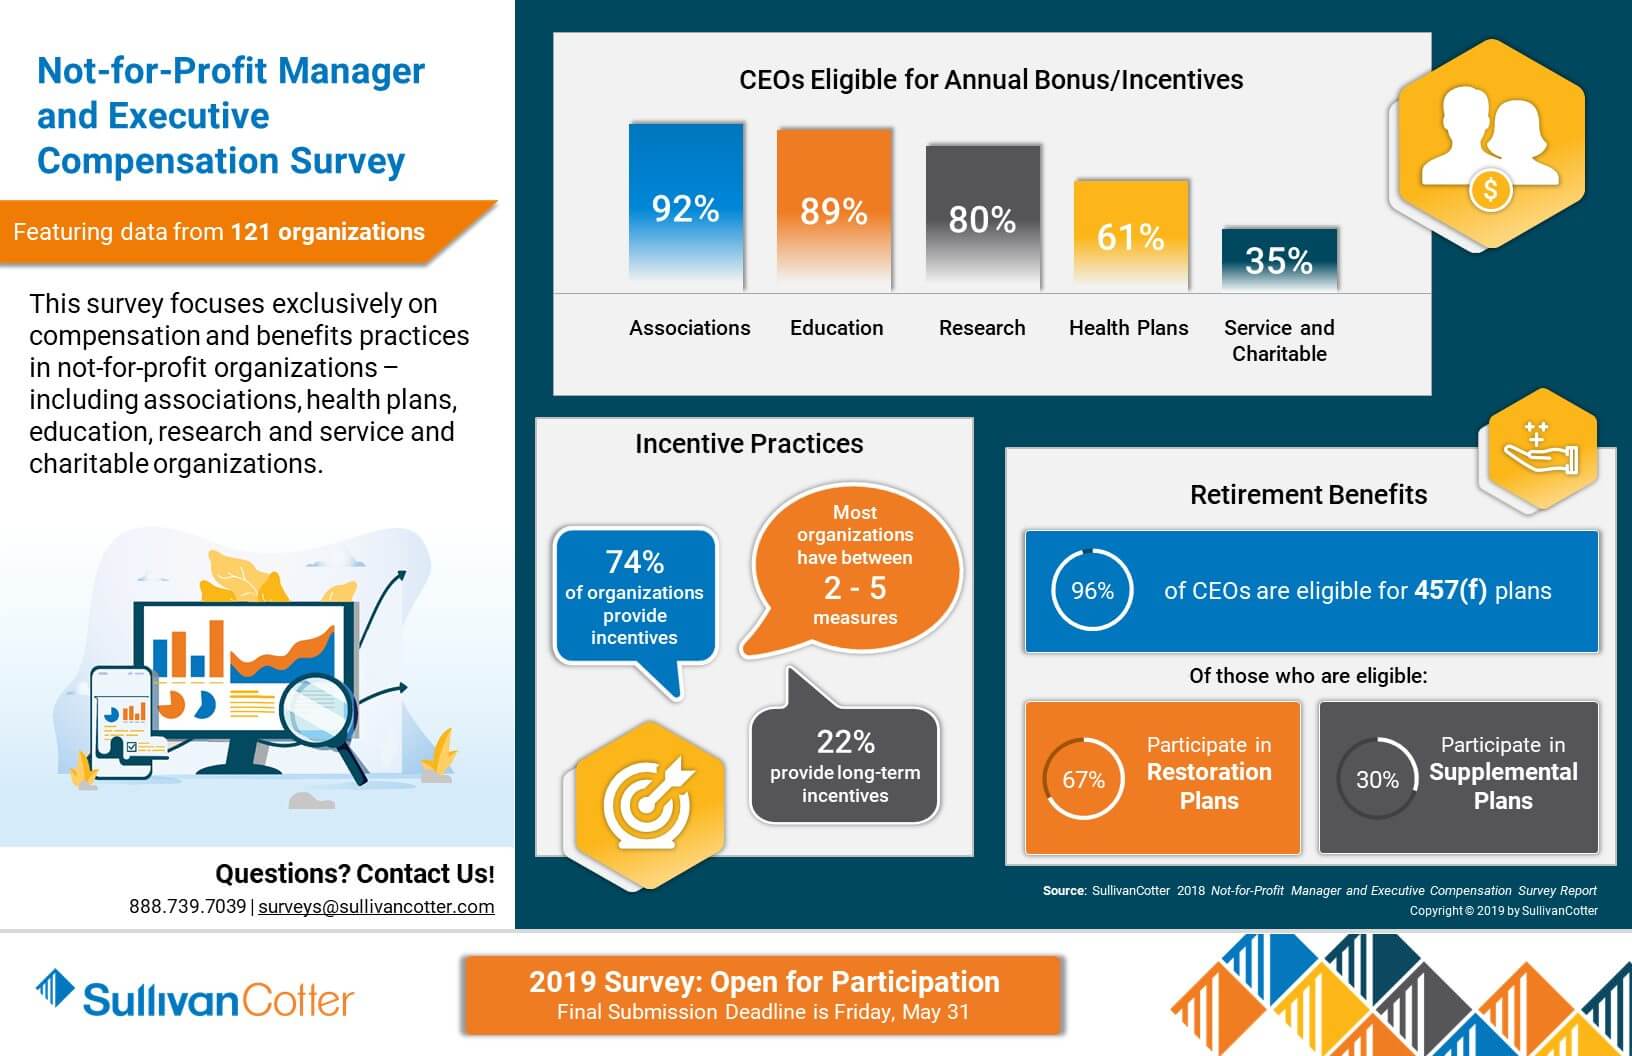
INFOGRAPHIC | 2018 Not-for-Profit Manager and Executive Compensation Survey
Featuring compensation and benefits data from 121 different not-for-profit organizations
Competitive compensation, benefits and talent strategies are essential to delivering on the mission of high-performing not-for-profit organizations. As organizations look to remain competitive in today's complex operating environment, attracting, retaining and engaging key talent is both a top priority and a constant challenge. Access to the right data is critical, and understanding key compensation benchmarks and pay practices can help to address the complexities that mission-based organizations are facing.
View highlights from the results of our 2018 Not-for-Profit Manager and Executive Compensation Survey, which features data from 121 organizations and focuses exclusively on compensation and benefits practices in service and charitable organizations, trade and professional associations, research institutes, health plans, education and more.
DOWNLOAD INFOGRAPHIC

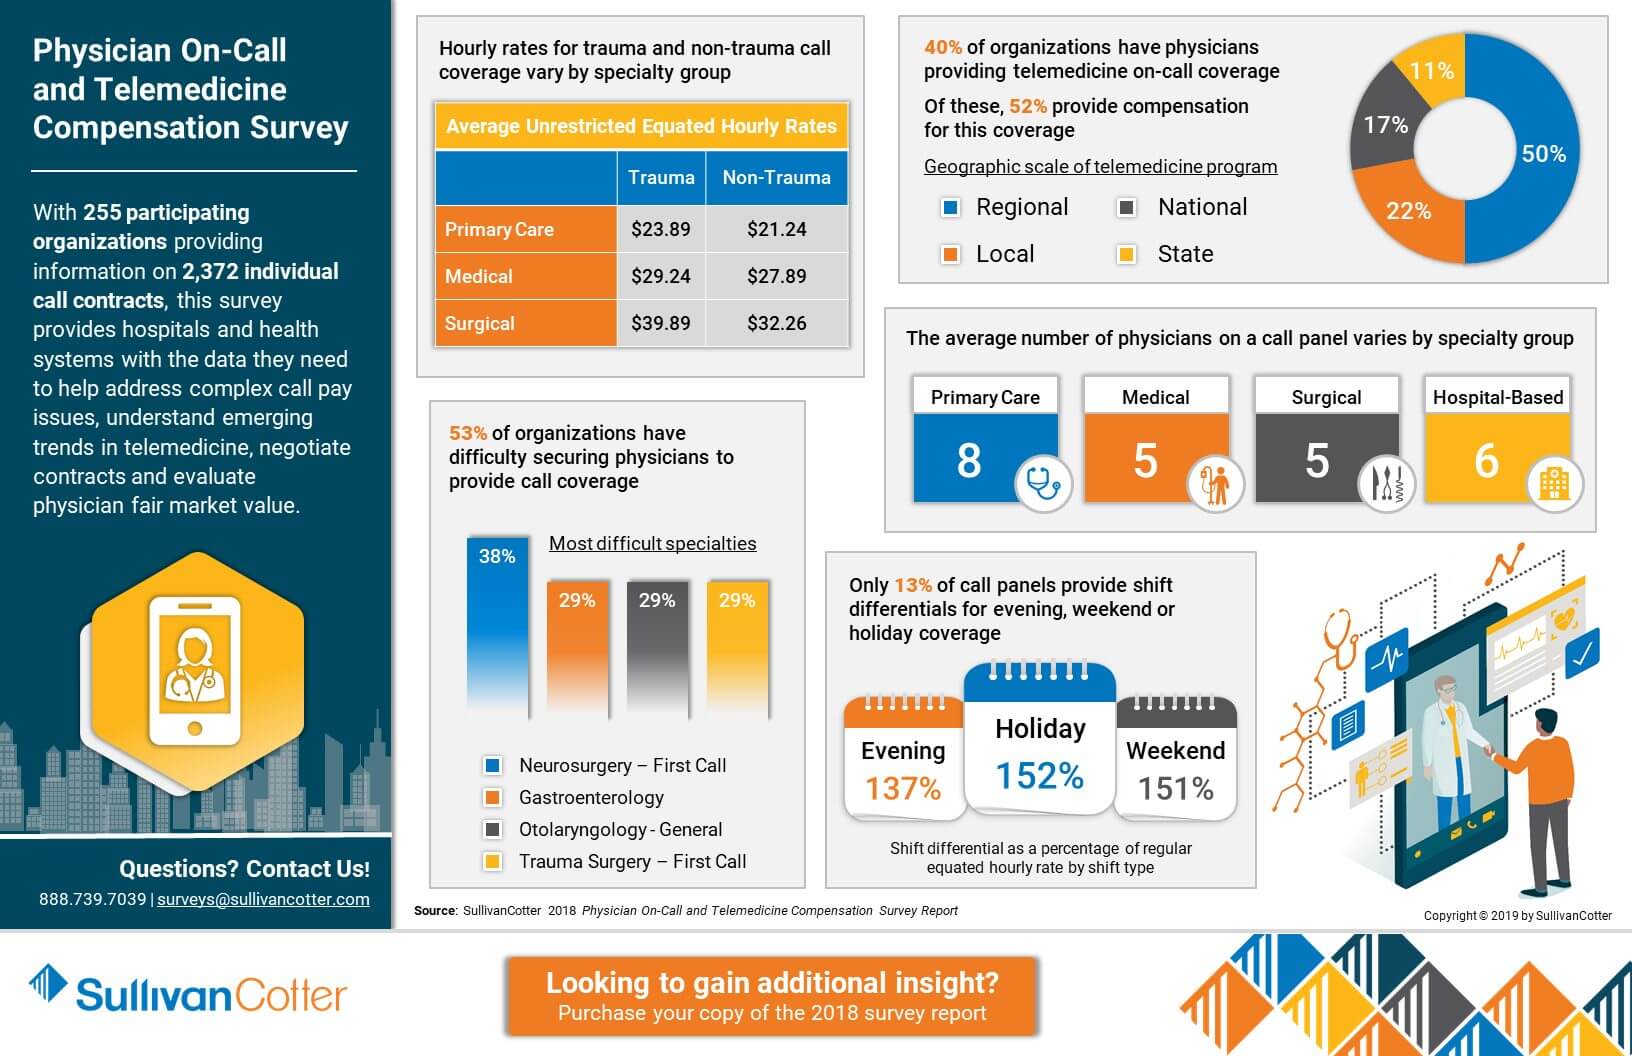
INFOGRAPHIC | 2018 Physician On-Call and Telemedicine Compensation Survey
Featuring complex physician call pay and telemedicine compensation data from over 255 participating organizations
With comprehensive information on 2,372 individual call contracts, SullivanCotter's Physician On-Call and Telemedicine Compensation Survey provides hospitals and health systems with the data they need to help address complex call pay issues, understand emerging trends in telemedicine, negotiate contracts and evaluate physician fair market value.
View highlights from the 2018 results to learn more, and purchase your copy of the survey report!
DOWNLOAD INFOGRAPHIC

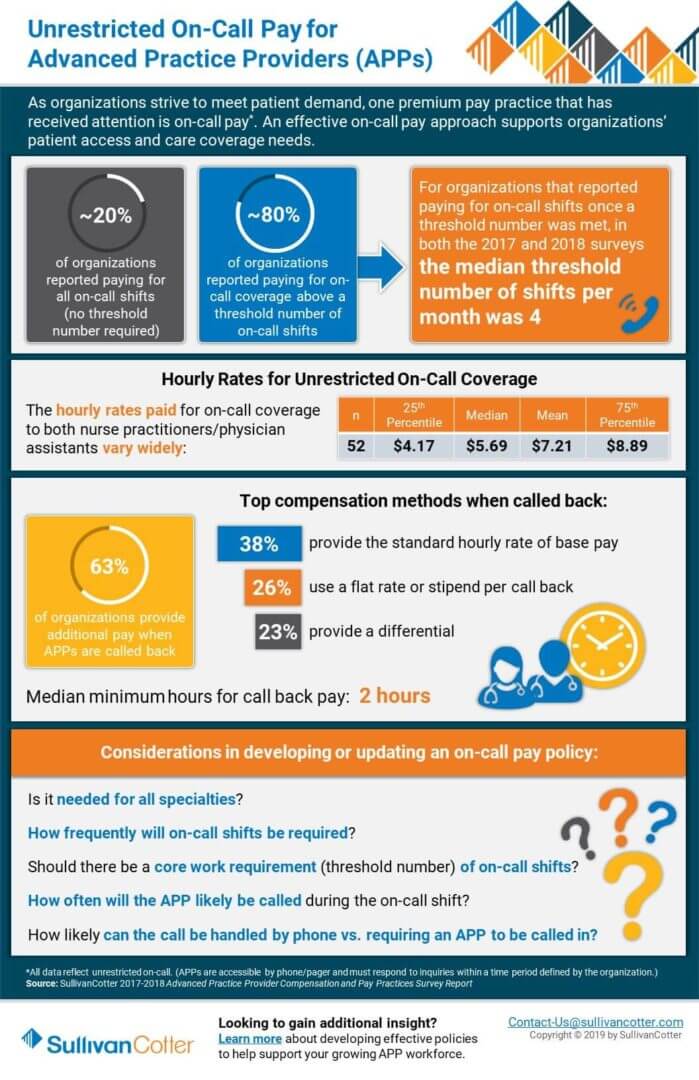
INFOGRAPHIC | Unrestricted On-Call Pay for Advanced Practice Providers
Insight into on-call pay practices for Advanced Practice Providers
Advanced practice providers (APPs) continue to be an important resource as organizations strive to meet patient demand. Developing an effective on-call pay approach for APPs helps to increase patient access and support care coverage needs, and understanding the data and benchmarks regarding this premium pay practice is critical. This infographic highlights important unrestricted on-call pay trends and metrics including prevalence, thresholds, hourly rates for call coverage, compensation methods and important considerations in developing or updating your organization's related policies.
Learn more about SullivanCotter's Advanced Practice Provider Compensation and Pay Practices Survey, featuring data from more than 600 organizations on nearly 67,000 individual APPs.
DOWNLOAD INFOGRAPHIC

CASE STUDY | The Value of APPs in Driving Organizational Performance
Advanced practice providers (APPs) are one of the fastest growing workforces in health care.
DOWNLOAD CASE STUDY
THE SITUATION
Advanced practice providers (APP) are one of the fastest growing workforces in health care. Not only has the APP workforce more than doubled in the last 15 years, but physician assistants and nurse practitioners are also ranked as the third and fourth best overall jobs in 2018 by U.S. News & World Report.
The focus on team-based care continues to intensify. In order to truly help transform care delivery, the role of APPs must be more clearly defined to better partner with physicians. Health systems and medical groups nationwide seek to drive better performance as the industry transitions from volume- to value-based care, and achieving the strategic goals of access, quality, affordability and provider satisfaction is a top priority.
As one of the top 10 largest children’s hospitals in the country and Arizona’s only pediatric quaternary care hospital for high acuity, complex conditions, leadership at Phoenix Children’s Hospital (PCH) recognized the need to utilize APPs more effectively to help transform patient care delivery.
Like many organizations, the number of APPs had grown swiftly and organically without a comprehensive strategy to support its sustainability. PCH realized that while they employed almost 100 APPs representing nearly $10 million in payroll, the lack of strategy had created obstacles regarding recruitment, utilization and job satisfaction. This left the organization unable to tap into the full potential of their rapidly growing APP workforce.
PCH partnered with SullivanCotter to develop a comprehensive workforce strategy to integrate, optimize and engage APPs in achieving the organization’s goals of increasing access, quality, affordability and provider satisfaction.
THE APPROACH
Senior leadership at PCH collaborated with a team of advisors from SullivanCotter to assess the utilization of their current APP workforce and developed a systemic approach to redesign care models and build the culture and infrastructure necessary to support the optimization of APPs.
Supported by decades of clinical and operational health care industry experience, as well as proprietary APP data on utilization, compensation and leadership structures, SullivanCotter provided unique insight into the evolving role of the APP and the challenges health systems and medical groups face when trying to utilize this workforce more effectively.
“Medical group, hospital and nursing executives must be fully aligned and work together
throughout the entire process to ensure the optimization and engagement of all team
members, including physicians, advanced practice providers, registered nurses and
medical assistants.”Dr. Jared Muenzer, MD, MBA
Senior Vice President and Chief Operating Officer, Phoenix Children’s Medical Group
The approach included three phases: education and assessment, program design, and implementation.
A number of PCH leaders were involved throughout the process – including the CEO, CMO, COO of the medical group, SVP/CNO, Surgeon in Chief, executive general counsel, and physician and APP leaders. Physicians were also meaningfully engaged in the assessment and design and led the implementation efforts in their divisions.
To start, all APPs were surveyed to learn more about their current utilization and perception of the culture at PCH. Key policies were also reviewed to assess current practices compared to federal and state regulations as well as national trends and leading practices.
Findings from the initial assessment uncovered the following:
- Only 42% of APPs felt they were being utilized to their maximum potential
- APPs were performing many activities that could be completed by other team members such as RNs, MAs or social workers
- Medical staff bylaws were more restrictive than state law or CMS requirements
- Clinical privilege lists were out of date
- There was no formal orientation program for APPs, though over 40% were hired as new graduates
- APPs received limited education on documentation and billing
- Multiple key stakeholders desired clarification on the NP and PA scope of practice
Using the findings from the assessment, SullivanCotter worked with PCH executives and physicians to develop a list of guiding principles. To help inform a comprehensive APP strategy, the organization determined it must:
- Define models of care based on patient needs and clinical specialty
- Ensure providers work to their full potential and support top-of-license practice
- Bill based on service provider
- Build a culture and infrastructure to support the utilization, retention and engagement of APPs
- Measure progress to ensure sustainability and identify new opportunities for improvement
- Develop a provider workforce plan that includes APPs in addition to physicians
Facilitated by SullivanCotter, these guiding principles were then used by multiple clinical divisions (cardiac surgery, CVICU, cardiology, emergency services, urgent care, orthopedics, urology, gastroenterology and transplant) to re-examine and redefine the role of APPs in patient care delivery.
Additionally, other project teams were enlisted to help ensure the continued optimization and engagement of the APP workforce. They focused on the development of new:
- Leadership structures
- Privileging and competency assessment (FPPE/OPPE) processes
- Onboarding processes with clearly defined roles for preceptors and physicians
- Documentation and billing education and guidelines
- Marketing and branding approaches more inclusive of APPs
The progress of the clinical and operational implementation was monitored by an executive steering committee on a quarterly basis through scorecards for each committee and clinical specialty.
“This process has produced clear and compelling results to reinforce the idea that APPs can
help drive organizational performance and improve outcomes. This is critical in an emerging
value-based health care environment and is necessary to meet the growing demand for
highly-trained health care providers.”Julie Bowman, MSN, RN
Senior Vice President, Patient Care Services and Chief Nursing Officer, Phoenix Children’s Hospital
THE RESULTS
The PCH leadership team understood that APPs were a valuable but underutilized resource and championed the optimization of this workforce as a key organizational strategy. This helped to improve access and health outcomes for its patients and achieve its goals for expansion and financial performance. Over a two-year period of redefining their care models and implementing the strategy, PCH was able to accomplish the following:
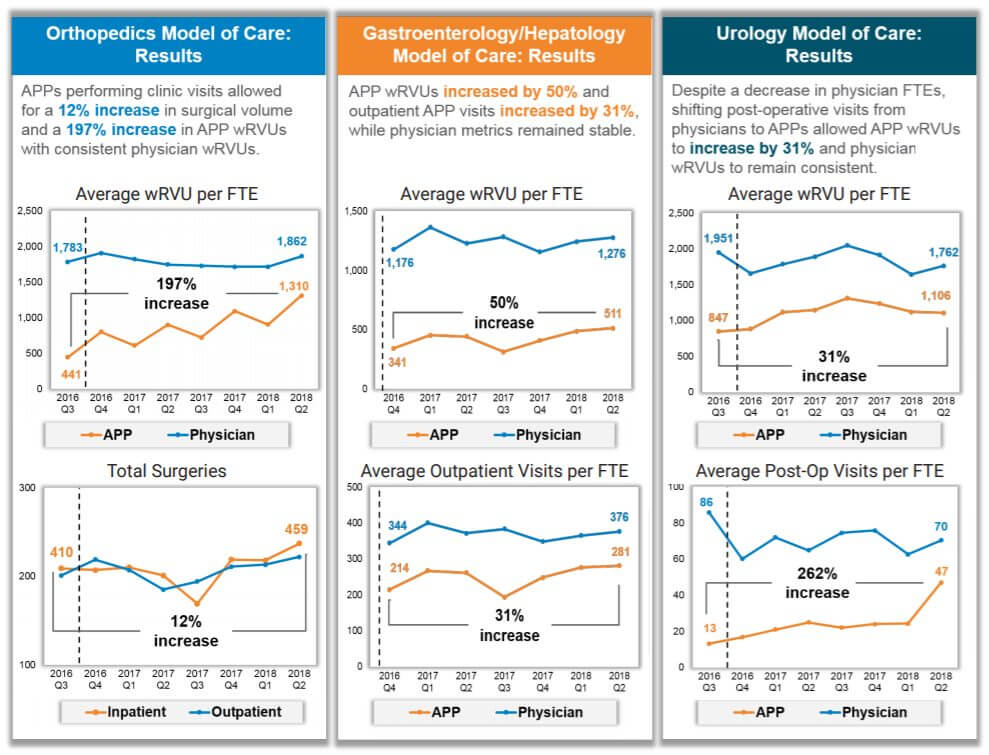
- In orthopedics, a 197% increase in APP wRVUs with no decrease in physician wRVUs, and a 12% increase in surgeries (productivity and revenue) with no additional staff
- In gastroenterology, a 50% increase in APP wRVUs with slight increase in physician wRVUs, a 31% increase in APP outpatient visits and a 9% increase in physician outpatient visits (productivity and access)
- In urology, a 31% increase in APP wRVUs with slight decrease in physician wRVUs due to a decrease in physician FTEs, and over 250% increase in APP post-operative visits
- In less than a year, reduced time to fill APP positions by 50% (down from 79 days to 38.5 days)
- APP turnover decreased by an average of 47% since 2016
- Implemented a comprehensive onboarding program for APPs that was also adopted for new physicians
- Added APP representation to multiple medical staff committees
LESSONS LEARNED
As health systems and medical groups consider developing their own APP strategies to improve the way care is delivered in today’s evolving market, PCH’s model is transferrable to both pediatric and nonpediatric organizations. There are a number of key lessons learned from PCH’s journey for other organizations to consider.
The following guidelines are essential to the implementation process:
- Ensure active participation and engagement from hospital, medical group, nursing and executive leadership throughout the process
- Identify physician champions early on
- Care model redesign must focus on all team member roles, including physicians, APPs, registered nurses, medical assistants, care managers and more
- Align physician and APP performance management, compensation and incentive plans
- Ensure some early successes
- Conduct regular key stakeholder meetings to provide updates on progress
- Agree upon implementation plan and hold key physician, APP and service line leaders accountable
About Phoenix Children’s Hospital
Phoenix Children’s Hospital (PCH) is one of the 10 largest children’s hospitals in the country and Arizona’s only “Best Children’s Hospital,” ranked in all 10 specialties by US News & World Report. This includes a 433-bed acute care facility with 18 clinical divisions and six sites of care serving pediatric inpatient, outpatient, urgent care, emergency and trauma services. In 2015, Phoenix Children’s Hospital had 18,773 inpatient admissions, 80,514 visits to the Emergency Department, 237,514 outpatient visits, and 16,491 surgical cases.
In 2017, Phoenix Children’s Hospital received the Phoenix Business Journal’s prestigious HealthCare Leadership Award and was named to Best Companies AZ’s “100 Best Arizona Companies” list for health care. An internal survey placed the hospital in the 90th percentile for employee satisfaction.

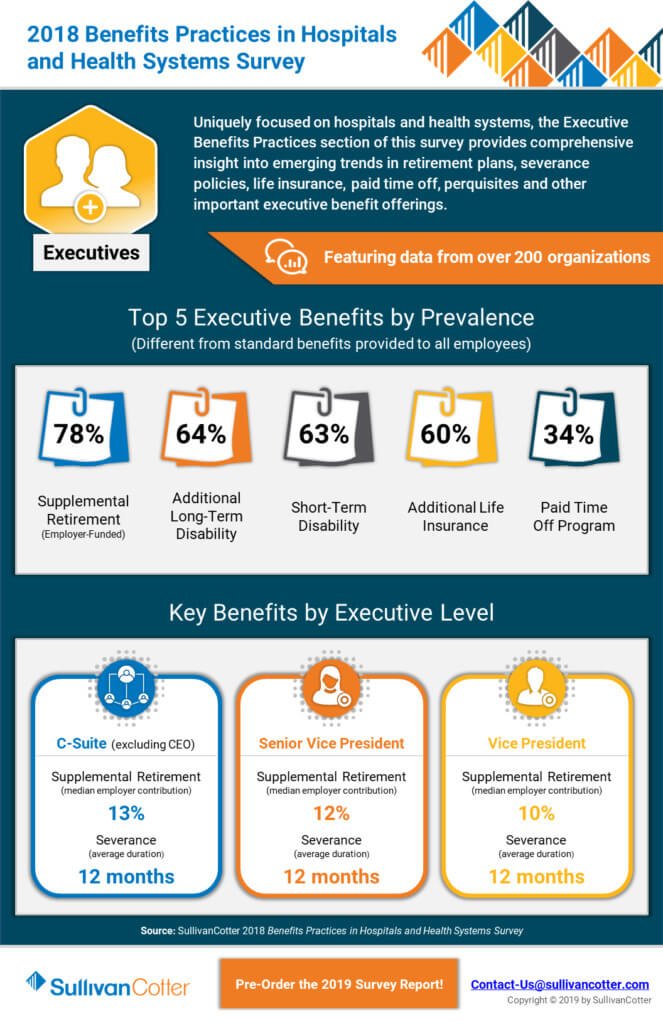
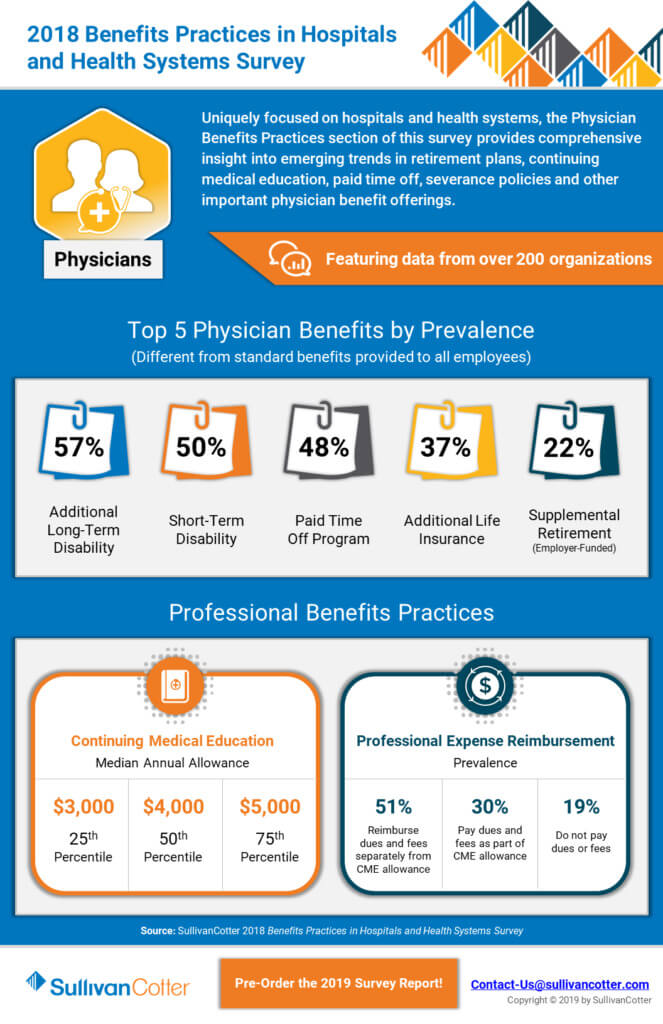
INFOGRAPHIC | 2018 Benefits Practices in Hospitals and Health Systems Survey
INFOGRAPHIC | 2018 Benefits Practice in Hospitals and Health Systems Survey
Data to to benchmark executive, physician and employee benefits programs
Uniquely focused on only hospitals and health systems, this survey helps organizations address challenges related to executive, physician and employee benefit programs. This includes comprehensive benchmarking data and insights as it relates to optimizing benefit offerings, implementing retirement plans for evolving executive and physician roles, and keeping pace with emerging trends in paid time off allowances, continuing medical education, severance policies, disability programs and more.
View highlights from two different sections of SullivanCotter’s 2018 Benefits Practices in Hospitals and Health Systems Survey, featuring data from more than 200 health care organizations.

AHA Trustee Insights | Key Action Steps for the Compensation Committee
Ensure alignment between executive compensation and key health system objectives
The marketplace for health care continues to evolve, and organizations are increasing the size and scale of their operations in response. New executive positions are emerging and growing in organization-wide impact while selected roles, especially at the subsidiary hospital-level, are narrowing in scope – leaving health care leaders to reconsider whether their current compensation strategy is still the best fit.
To help ensure continued alignment between executive compensation and key organizational objectives, not-for-profit hospitals and health systems must periodically review and update these programs in the context of a rapidly changing health care environment.
Featured in the March edition of the American Hospital Association's Trustee Insights, SullivanCotter highlights important action steps for the compensation committee as they determine if corresponding updates are necessary.