Provider Needs Assessment
SullivanCotter's Interactive Cloud-Based Application
SullivanCotter’s Provider Needs Assessment (PNA) enables health systems and medical groups to make better workforce decisions and optimize clinical performance by more accurately assessing and predicting their market needs. Access to market-specific provider supply and demand data via an updated PNA is critical as hospitals and health systems look to support growth, enhance value-based care delivery and reassess cost and efficiency concerns. Health care organizations must identify the right amount and type of providers in each specialty to operate effectively in the markets they serve with the goals of optimizing clinical performance to remain competitive in rapidly evolving environment.
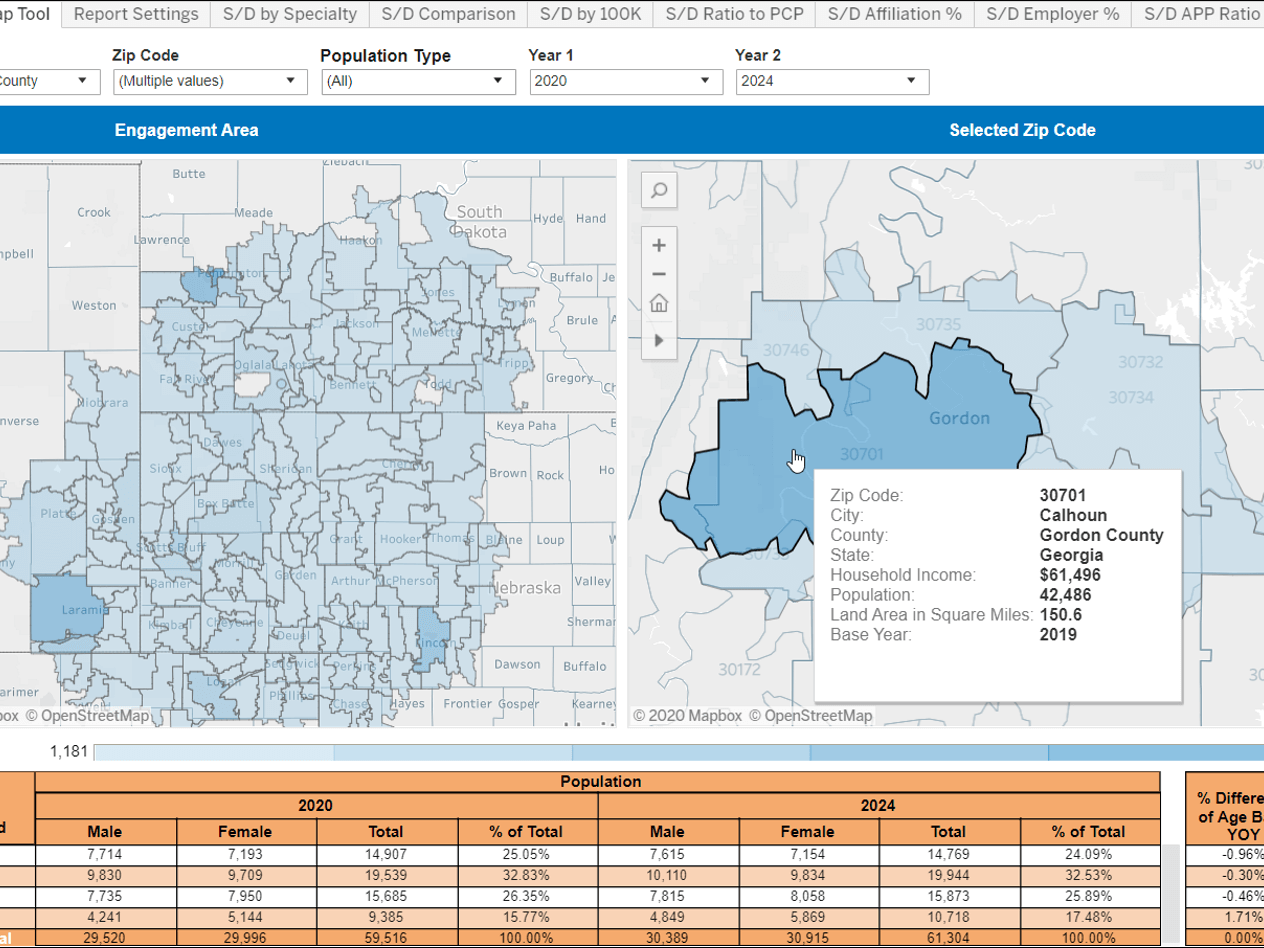
SullivanCotter’s PNA is an interactive cloud-based application that delivers accurate and actionable data-driven insights to help organizations identify, monitor and respond to changing service needs and provider staffing requirements. This product enables our clients to assess evolving workforce needs and model tailored forecasting scenarios with ongoing, real-time access to SullivanCotter’s database of physician and advanced practice provider (APP) supply and demand information.
Our Provider Needs Assessment Methodology
Our proprietary PNA methodology accurately identifies the physician and APP surplus or deficit within a specific market by determining supply and then forecasting wRVU utilization according to various demographic factors and payer types to calculate subsequent demand. This approach includes:
| SUPPLY | DEMAND |
|---|---|
| Multiple data sources are rigorously researched to identify all provider details and practice locations - including tracking of employment and affiliations | Applies Claritas Pop-Facts® demographic detail by zip code |
| Call verification team contacts every office location to confirm practicing provider details | Analyzes more than 2 billion unique claimsannually to forecast wRVU utilization by zip code |
| Proprietary algorithm adjusts for clinical full time equivalent based on SullivanCotter’s specialty-specific benchmarks | Utilizes SullivanCotter benchmark data from over 1,500 organizations and 400,000 physicians to calculate FTE |
| Client validation of market-specific providers by specialty and practice location | Defines FTE demand on over 100 subspecialty designations |
| Ongoing access to updated provider supply database for reporting and data mining | Combines data sources and forecasts utilization by market-specific demographics including geography, economic factors, age/gender, payment type and managed care |
To meet the needs of all health care organizations, SullivanCotter offers three distinct services:
| PNA Base | PNA Pro | PNA Enterprise |
|---|---|---|
| For individual hospitals | For multiple hospitals with large of shared geographies | For hospitals and health systems |
| Advanced supply and demand methodology to determine net physician needs for organization-defined service areas | Additional provider supply research | Call-verified supply of providers and expanded set of APP specialties |
| Incorporation of organization-specific provider rosters | Determination of quantitative net need for custom geographies | |
| Call-verified physician and primary care APP supply data for increased accuracy | Qualitative analyses to understand each market, service line and specialty | |
| Interviews, studies, and planning sessions to tier recruitment priorities | ||
| Delivery of a well-defined provider workforce plan |
| Product Features | PNA Base (Individual Hospital) | PNA Pro (Multiple Hospitals/Markets) | PNA Enterprise (Enterprise/Service Line Planning) |
|---|---|---|---|
| Physician Specialties | 62 | 87 | 98 |
| APP Specialties | 0 | 6 | 11 |
| Primary Data Sources (Supply Research) | 5+ | 20+ | 40+ |
| Contract Length | 2-3 Years | 3 Years | 3 Years |
| Estimated Implementation Timing | 2-4 weeks | 3-6 months | 4-8 months |
| Interactive Cloud-based Application | ✔ | ✔ | ✔ |
| Track Provider Language(s) Spoken | ✔ | ✔ | ✔ |
| Export Supply/Demand Data | ✔ | ✔ | ✔ |
| Access to Demand Version Updates | ✔ | ✔ | ✔ |
| View/Export Claritas Pop-Facts© Demographic Data | ✔ | ✔ | ✔ |
| Provider Practice Mapping Tool | ✔ | ✔ | ✔ |
| Succession Planning Calculator | ✔ | ✔ | ✔ |
| Static PNA Reports | ✔ | ✔ | ✔ |
| Report Catalog/Generator | ✔ | ✔ | ✔ |
| Individual Specialty-Specific Reports | ✔ | ✔ | ✔ |
| Interactive and Customizable Report | ✔ | ✔ | ✔ |
| Dedicated Subject Matter Experts | ✔ | ✔ | ✔ |
| PNA Application IT Support | ✔ | ✔ | ✔ |
| Customer Success Representative | ✔ | ✔ | ✔ |
| Unlimited User Licenses | ✔ | ✔ | ✔ |
| Call Verification of Entire Supply Roster | ✔ | ✔ | |
| Upload Client Provider FTEs | ✔ | ✔ | |
| Editable and Dynamic Supply Roster | ✔ | ✔ | |
| Customized Provider Affiliations and Employers | ✔ | ✔ | |
| Custom Preset Service Areas | ✔ | ✔ | |
| SullivanCotter Issued Stark Report(s) | ✔ | ✔ | |
| Provider Productivity Benchmarking | ✔ | ✔ | |
| User-Specific Training Sessions | ✔ | ✔ | |
| Key Stakeholder Interviews | ✔ | ||
| Provider and Organizational Leadership Surveys | ✔ | ||
| Patient Access Studies | ✔ | ||
| Facilitated Workforce Planning Sessions | ✔ | ||
| Detailed Recruitment Recommendations | ✔ | ||
| Workforce Development Plan | ✔ |
SullivanCotter's advanced PNA methodology helps organizations to:
- Determine provider demand by ZIP code, population demographics and payment types
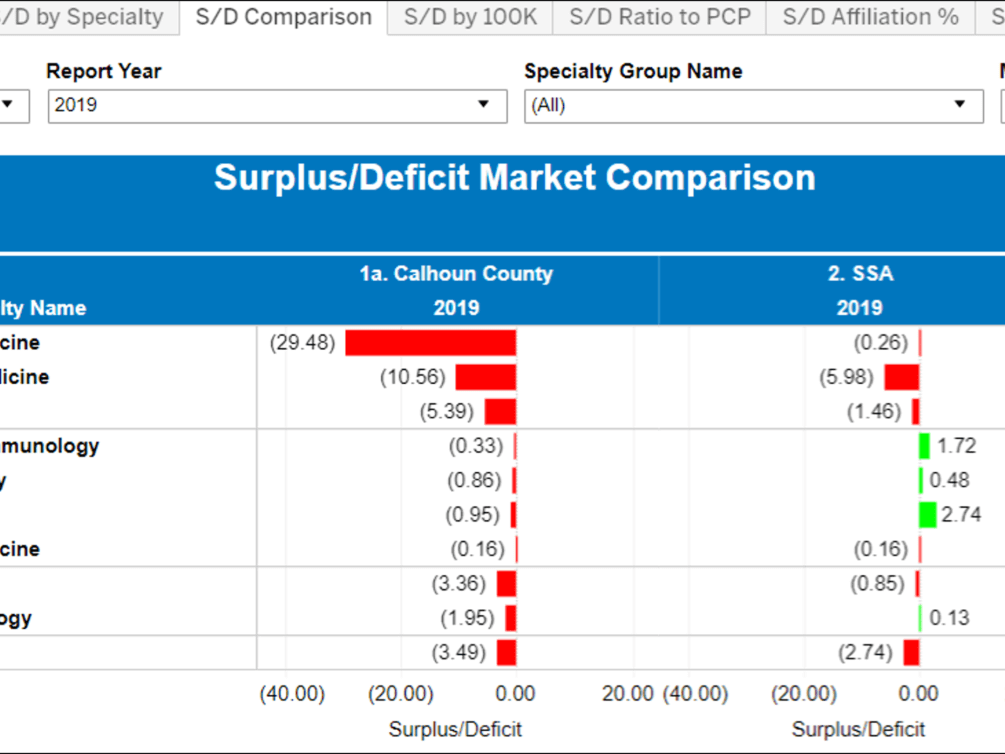
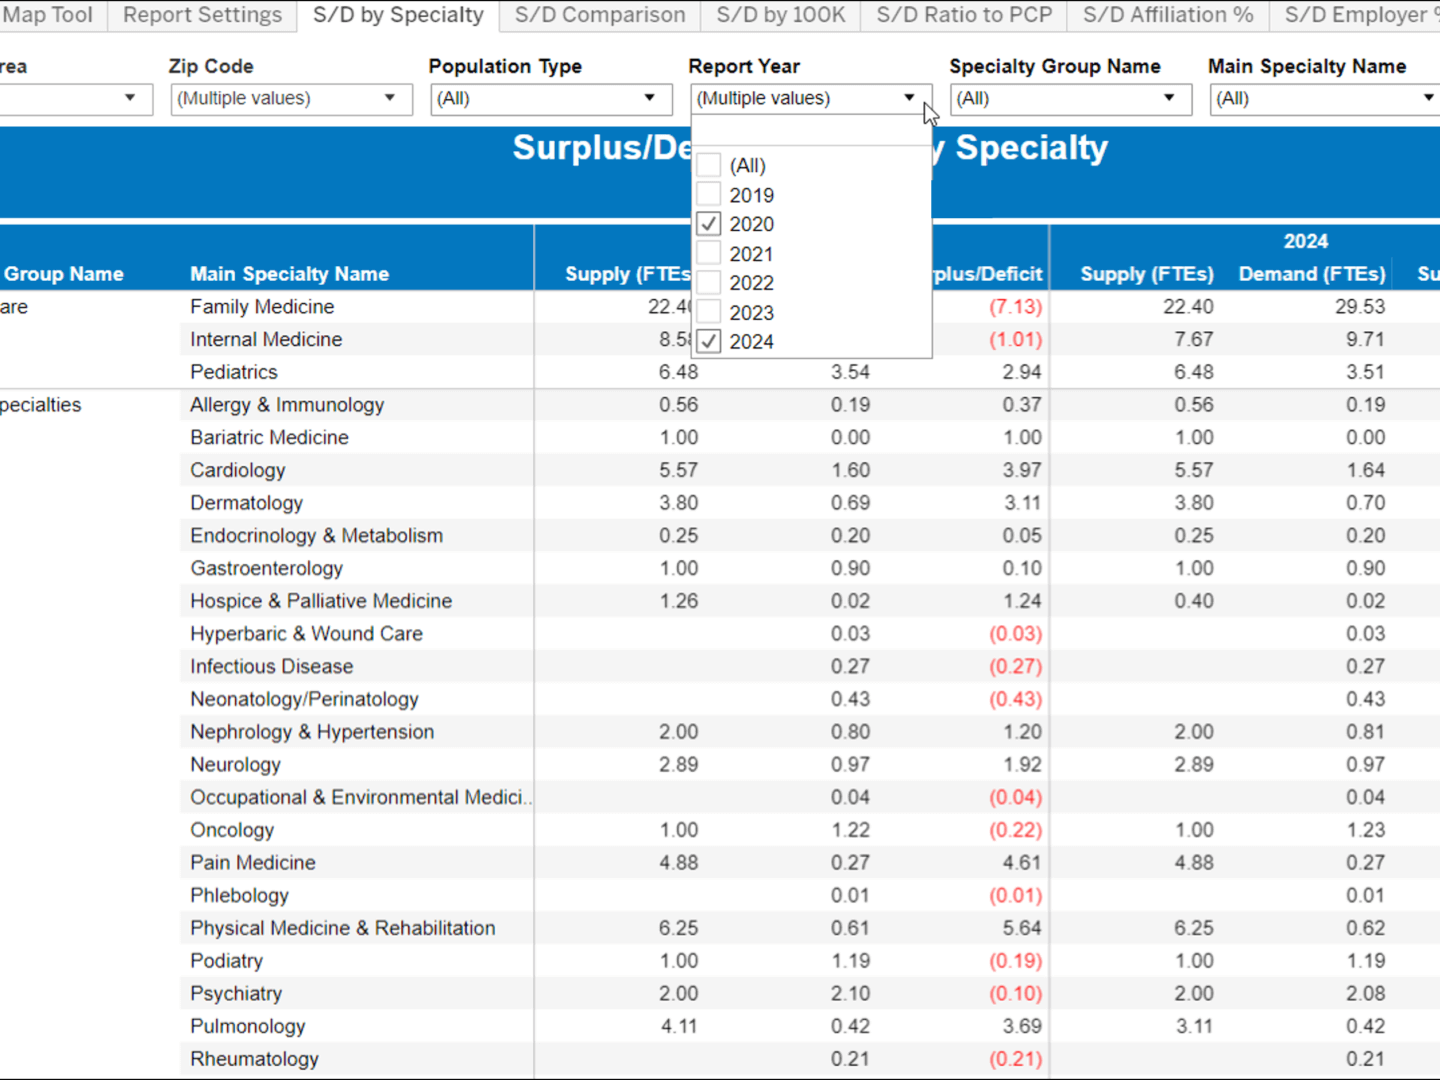
- Accurately capture the supply of providers to determine the current and forecasted surplus or deficit
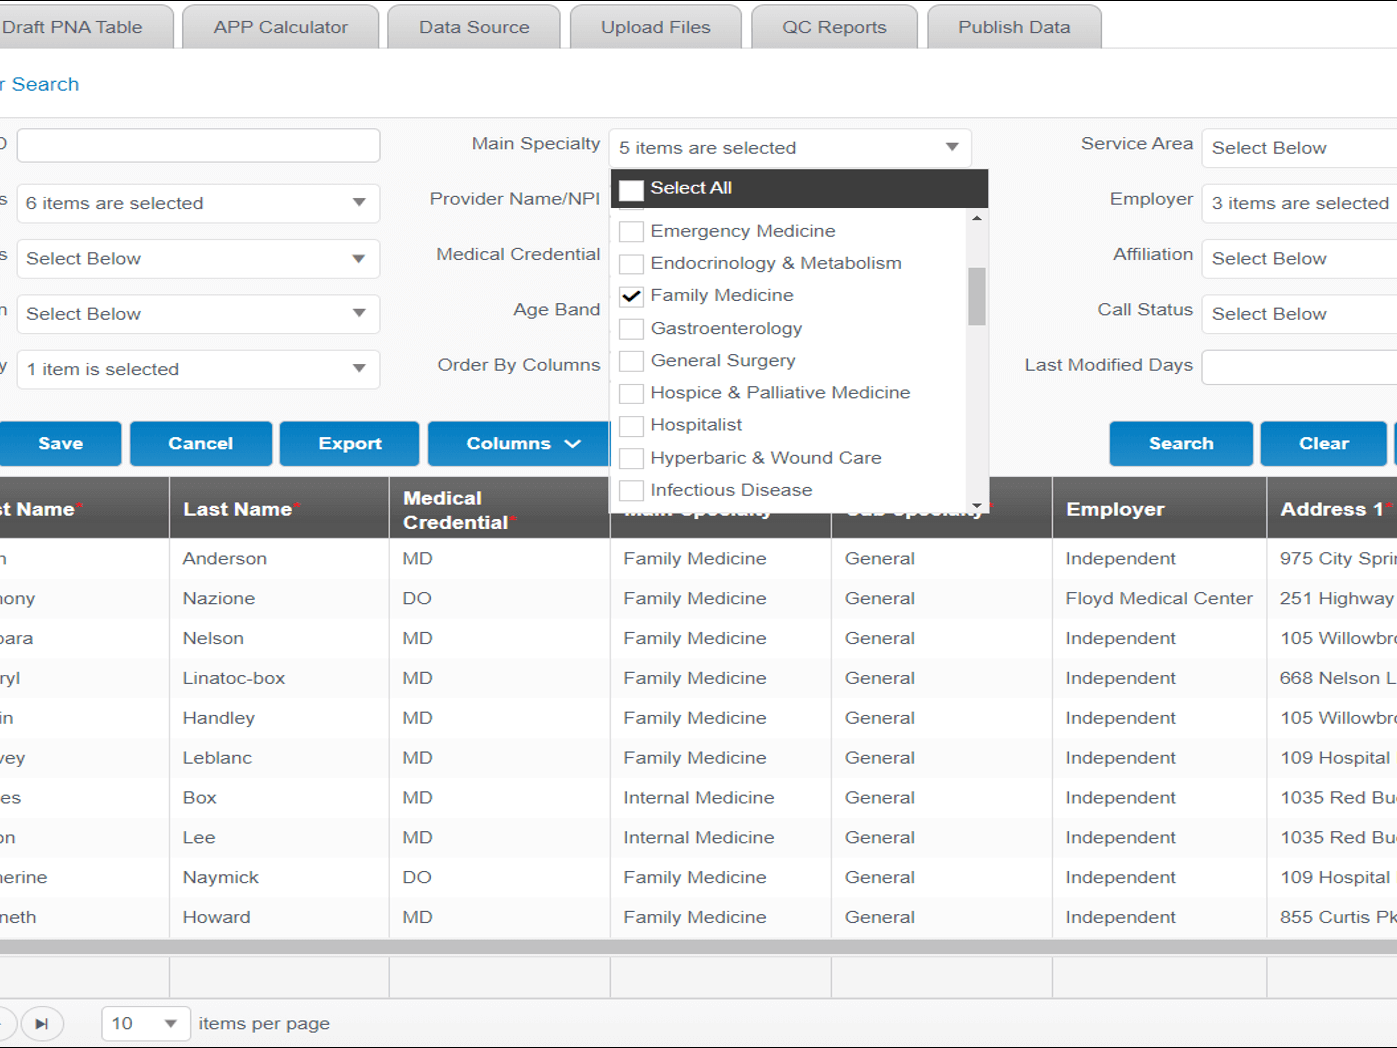
- Pinpoint employed and affiliated physicians and APPs by specialty
- Create a competitive edge by optimizing provider resources
- Identify service line delivery gaps and opportunities
- Improve provider staffing and recruiting decisions to help control cost of employment
- Inform provider strategy and alignment efforts to drive organizational performance
- Assess patient demand using predictive modeling founded on market-specific demographic utilization patterns
- Access to customizable reports to deliver actionable data-driven insights
Business Intelligence Reports
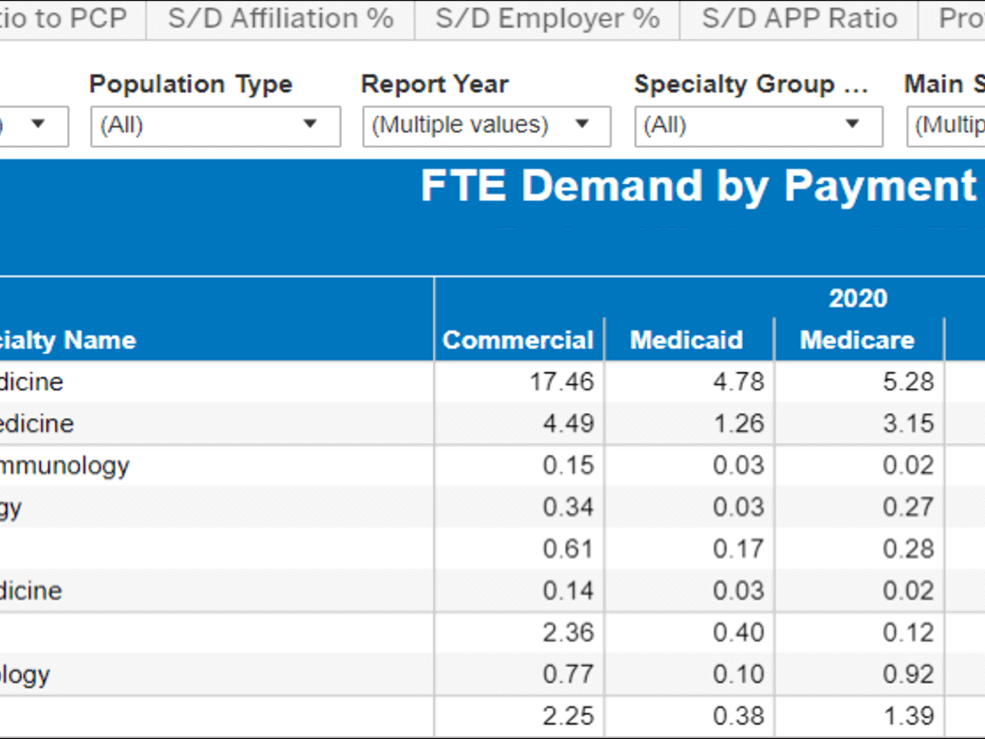
The application displays results and reports with a number of customizable filters for strategic consideration:
- Results Overview
- Service Area Mapping
- Comparative Market Results
- Demographic Trends
- Population Trends
- Demand by Place of Service
- Payer Demand by Specialty
- Predictive Modeling
- Physician Supply Roster
- Physician Age Analysis
- PCP APP Ratio Analysis
- Calculate Surplus/Deficit
- Net Need by Population Type
- Market Share Insights
- Specialty Summaries
- Ranked Needs and Priorities
Request a Demo
RELATED CONTENT
ARTICLE | Practice Acquisition Strategy and COVID-19: Adjusting for the New Normal
ARTICLE | Optimizing Care Delivery in Response to COVID-19
CASE STUDY | The Key Role of APPs in Today’s New Normal – The Stanford Story
Physician Affiliation and
Needs Assessment
In order to remain competitive in a dynamic health care environment, health care organizations are seeking to optimize clinical care and enhance performance through a wide range of physician-hospital affiliation models.
Learn more about enhancing your organization’s physician affiliation relationships >
SullivanCotter’s PNA application with interactive cloud-based dashboard helps organizations to:
- Reduce guesswork regarding population demographics
- Identify demand by selected services areas, population demographics and payment type
- Create competitive edge by optimizing
physician resources - Improve physician staffing and recruiting decisions to help control the cost of employment
- Pinpoint employed and affiliated market physicians by specialty
- Inform physician strategy and alignment efforts to enhance performance
- Gain insight into the influence of
APPs and emerging technologies - Utilize accurate listing of
physicians within a market - Identify service line delivery
gaps and opportunities
Learn more about our innovative new Provider Needs Assessment application
Related Resources
On-Demand Webinar | Building a Next Gen Operating Model
It's time to create a stronger health care enterprise...and we have the blueprint for building a next gen operating model! Watch our latest webinar to learn more.
Physician Faculty Recruitment: NIH Funding Cuts Intensify Recruitment Challenges
Academic medical centers are under intense pressure as funding cuts for National Institutes of Health being to take effect. How are organizations preserving the academic mission of advancing science, training future clinicians, and care for the nation's most complex patients?
Physician Compensation and Compliance: Mitigating Risk Through Effective Governance
Understanding the nexus between physician compensation and compliance is critical in an active enforcement environment. Learn how a robust governance process can help to support compliance and protect your organization from risk,
