
INFOGRAPHIC | 2026 CMS Physician Fee Schedule Changes
Navigating the New Normal
Despite the first increase to the Medicare Conversion Factor in 6 years, multi-faceted Physician Fee Schedule changes impacting both work relative value units (wRVUs) and practice expense RVUs mark the beginning of an ongoing three-year adjustment cycle.
As your organization moves forward, it’s important to fully understand the impact within your organization – including how reimbursement and RVU changes may affect compensation plan decisions, investment per physician FTE, hospital-based services and arrangements, and strategic workforce planning in facility settings.
Work RVU Changes
- Efficiency Adjustment: CMS reduced wRVU values for Current Procedural Terminology (CPT) codes to reflect improved clinical efficiencies over time.
- Beginning in 2026, there is a 2.5% reduction in wRVU values for specific non-time-based procedures.
- Adjustments will be recalculated and applied every three years going forward.
- Reductions do not apply to time-based codes like evaluation and management, care management, or behavioral health services.
- Efficiency Adjustments will impact over 7,000 unique CPT codes.
- Physician Compensation Implications: wRVU decreases, which could exceed 5% in certain specialties, may result in reduced compensation if not offset by changes to compensation plans.
Work RVU Market Insights and Changes by Specialty
Organizational awareness of the CMS wRVU Efficiency Factor adjustment is growing. However, many are still uncertain about the impact of it and if or how they will address it. Based on recent polling results, about 1/3 of organizations were planning no changes, 1/3 were still evaluating the impact to inform any potential adjustments, and the rest were contemplating a budget-neutral adjustment to rates.
Real-time wRVU changes typically appear in market survey data after 1-2 years, depending on the pace of market adoption.
The analysis below represents the anticipated impact of all Physician Fee Schedule changes between 2025 and 2026.
Hospital-Based
- Radiology – Neurointerventional: (660), -5.2%
- Radiology – Diagnostic: (326), -3.1%
- Radiology – Interventional: (171) -2.5%
- Pathology – Anatomic and Clinical: (171) -2.5%
- Pathology – Dermatopathology: (165) -2.5%
Surgical
- Dermatology – Mohs Surgery: (263), -2.1%
- Plastic and Reconstructive Surgery: (155), -2.1%
- Orthopedic Surgery – General: (148), -1.7%
- Otolaryngology – General: (98), -1.3%
Medical
- Cardiology – Electrophysiology: (239), -2.1%
- Cardiology – Invasive – Interventional: (179), -1.7%
- Cardiology – General: (76), -0.9%
- Neurology: (27), -0.6%
- Psychiatry – General: 18, 0.5%
Primary Care
- Family Medicine: 14, 0.2%
- Internal Medicine: 15, 0.3%
Practice Expense (PE) RVU Changes
Material reductions to PE RVUs in the facility setting, which signify a move towards site-neutral payments, may materially impact reimbursement. Adjustments will be recalculated and applied every three years going forward.
There is increasing activity regarding hospital-based services and PSA negotiations. Anticipate additional requests for support payment increases due to the reduction in PFS Facility PE RVUs and associated reimbursement. These anticipated requests may provide opportunities to modernize PSAs to address staffing mix, strategic alignment and performance to system goals.
Family Medicine
- Facility Reimbursement Change: (9.2%), ($24,487) per FTE
- Non-Facility Reimbursement Change: 8.2%, $32,142 per FTE
Cardiology – Invasive – Interventional
- Facility Reimbursement Change: (3.8%) ($19,617) per FTE
- Non-Facility Reimbursement Change: 12.0%, $73,341 per FTE
Cardiology – General
- Facility Reimbursement Change: (3.8%), ($14,752) per FTE
- Non-Facility Reimbursement Change: 5.1%, $23,696 per FTE
Endocrinology and Metabolism
- Facility Reimbursement Change: (8.4%), ($22,862) per FTE
- Non-Facility Reimbursement Change: 7.1%, $24,702 per FTE
Dermatology
- Facility Reimbursement Change: (10.6%), ($49,917) per FTE
- Non-Facility Reimbursement Change: 4.6%, $32,617 per FTE
Gastroenterology
- Facility Reimbursement Change: (7.4%), ($33,453) per FTE
- Non-Facility Reimbursement Change: 12.7%, $105,975 per FTE
Neurology
- Facility Reimbursement Change: (6.6%), ($15,628) per FTE
- Non-Facility Reimbursement Change: 6.7%, $18,977 per FTE
Oncology – Hematology and Oncology
- Facility Reimbursement Change: (8.8%), ($24,339) per FTE
- Non-Facility Reimbursement Change: 6.9%, $24,710 per FTE
Cardiothoracic Surgery
- Facility Reimbursement Change: (3.2%), ($16,478) per FTE
- Non-Facility Reimbursement Change: (0.9%), ($4,560) per FTE
General Surgery
- Facility Reimbursement Change: (4.9%), ($19,192) per FTE
- Non-Facility Reimbursement Change: 3.6%, $16,464 per FTE
Ophthalmology – General
- Facility Reimbursement Change: (9.9%), ($47,997) per FTE
- Non-Facility Reimbursement Change: 0.2%, $1,331 per FTE
Orthopedic Surgery – General
- Facility Reimbursement Change: (6.9%), ($39,653) per FTE
- Non-Facility Reimbursement Change: (0.3%), ($2,195) per FTE
Critical Care Medicine
- Facility Reimbursement Change: (4.0%), ($7,742) per FTE
- Non-Facility Reimbursement Change: 12.0%, $29,902 per FTE
Diagnostic Radiology
- Facility Reimbursement Change: 0.0%, $139 per FTE
- Non-Facility Reimbursement Change: 1.4%, $7,413 per FTE
Emergency Medicine
- Facility Reimbursement Change: 0.8%, $2,126 per FTE
- Non-Facility Reimbursement Change: 4.3%, $12,843 per FTE
Hospitalist (Internal Medicine)
- Facility Reimbursement Change: (6.1%), ($12,796) per FTE
- Non-Facility Reimbursement Change: (5.1%), ($10,795) per FTE
Pathology (Anatomic and Clinical)
- Facility Reimbursement Change: (0.2%), ($591) per FTE
- Non-Facility Reimbursement Change: 0.1%, $436 per FTE
Looking for support? Here’s how we can help!
- Conduct impact analysis using robust, proprietary datasets
- Evaluate care models to identify patient visit and productivity improvement opportunities
- Assess workforce requirements across clinical and non-clinical roles to enhance patient care delivery while unlocking operational and financial improvements
- Facilitate change management activities to evaluate options, including communication and implementation strategies
- Support the renegotiation of key Professional Service Arrangements


What Physician Retention Reveals About the Design of Health Care Systems
Physician retention is still a structural risk for health systems
Does your organization make it easier or harder for physicians to work at the top of their license?
By Erica Grant, Partner, and Daniel Ryan Charles, Consultant – Lotis Blue Consulting, SullivanCotter’s sister organization
Physician turnover remains one of the most disruptive and costly workforce challenges facing health systems. Each departure carries significant financial and operational consequences, including recruitment expenses, lost productivity, and disruptions in patient access. Discussion of physician attrition often focuses on the well-known pressures of the role. Media portrayals often paint the picture of long hours, emotional strain, and burnout as the primary drivers of physicians leaving their roles. Those pressures are real, but recent research shows that physicians’ intentions to stay with or leave their workplace are shaped less by workload alone and more by the design of the clinical system itself.
Physician retention ultimately comes down to a simple question: Does the organization make it easier or harder for physicians to work at the top of their license?
Findings from that research, captured in the Science of Staying study by SullivanCotter and Lotis Blue, show that physicians’ decisions to stay or quit are influenced by how effectively the clinical environment enables them to practice, navigate operational demands, and feel supported by the system around them.
Physicians Evaluate the Conditions of Practice
Physicians tend to judge their organizations through the conditions under which they deliver care each day. These conditions can be understood through the employee value proposition (EVP), which represents the psychological contract between employer and employee. It covers the tangible and intangible elements of the offering that relate to the employee experience.
That research further found that within the EVP, two dimensions, care environment and total rewards, account for more than 50% of influence on physicians’ decisions to stay or leave.
The Impact of the Care Environment
The care environment reflects whether physicians have the autonomy, resources, and operational support needed to deliver high-quality care. It includes the ability to exercise clinical judgment, access to staffing and equipment required for patient care, and work within systems that support rather than hinder clinical decision making. Across all 38 EVP factors, the care environment alone accounts for 28% of the weight in whether a physician will stay or leave a job, underscoring the importance of practice conditions. As Dr. Tony Jones, Professor Emeritus of Anesthesiology and Perioperative Medicine at UAB Medicine, has noted, “When physicians have the autonomy, resources, and trust to deliver care the way they were trained to, commitment follows.”
Retention risk tends to increase when operational barriers begin to interfere with how care is delivered. Administrative requirements, inefficient workflows, and insufficient support structures can gradually pull physicians away from the work that motivated them to enter the profession. Over time, these barriers can create a widening gap between professional expectations and the realities of daily work. As that gap grows, the organization may begin to feel less like a place that supports high-quality care and more like a system that complicates it.
Total Rewards Signal Professional Respect
Total rewards are often viewed primarily as a financial incentive, but for physicians, it carries a broader meaning. This dimension includes both benefits and compensation factors, together accounting for 30% of the decision to stay or quit, materially shaping how physicians interpret their value to the organization.
When compensation systems and benefits are transparent and equitable, they can reinforce trust and confidence in organizational leadership. When rewards appear inconsistent with expectations or contributions, however, they can intensify concerns that already arise in the presence of operational barriers. In these situations, total rewards become a signal that shapes how physicians interpret the organization’s priorities.
A Deeper Look at the Strongest Signals
While the patterns among physicians highlight the growing importance of the care environment and total rewards dimensions, the EVP model offers a more granular view of the signals behind physician turnover by looking at the individual factors that comprise each dimension. Examining these factors across the full EVP model reveals where the underlying pressure points are emerging and where organizations have the greatest opportunity to intervene before physicians reach the point of quitting.
- Being trusted to use their clinical discretion ranked highest, accounting for 22% of the weight in decisions to either quit or stay, compared to the 38 factors across the EVP. Professional integrity is foundational to their engagement.
- Pay equity emerges again, accounting for 15% of the quit or stay decisions, but is weighted much higher than simply pay level satisfaction (4%). This provides important nuance to total rewards. It is not just about pay alone. Pay equity and the other benefits they receive inform their view of the organization’s consistency and long-term commitment to physicians.
- Finally, care team culture plays a meaningful role. The quality of their relationships with colleagues accounted for 12% of their decision to quit or stay. This implies that having dependable teams that they enjoy working with anchors their commitment to the organization.
These signals provide leaders with precision when bolstering physician retention. Broad-brush perks or cultural slogans do little to move the needle. When tools, staffing, or safety standards fall short, it affects both morale and clinical confidence, as Dr. Jones has observed. Instead, organizations should focus on the levers that promote professional integrity, clinical agency, and adequate resourcing.
The Vital Remit for Health Systems
Physicians enter the profession with a clear sense of responsibility to their patients and their craft. The EVP can lend insight into what physicians value most from the organization in return for that commitment. When those expectations are reinforced in daily work, physicians are more likely to see the organization as a place where they can build their careers and contribute meaningfully to patient care.
For health system leaders, the implication is clear. Retention is not simply a workforce initiative or an engagement strategy; it is influenced by how the organization is designed and how work is completed. Leaders seeking to strengthen retention should examine whether their systems reinforce or interfere with physicians’ ability to practice medicine effectively. Do compensation structures signal fairness? Are care teams adequately resourced? Are operational processes supporting or constraining clinical judgement among physicians?
Organizations that address these structural factors will not only improve physician retention but may also strengthen the stability and quality of patient care. This expands the conversation beyond retention as a workforce metric. Rather, it elevates retention as a critical indicator of whether the health system is designed to effectively support the practice of medicine.
Frequently Asked Questions
Why is physician retention considered a structural risk for health systems?
Physician turnover creates significant financial and operational disruption for health systems. Each departure can lead to recruitment expense, lost productivity, reduced patient access, and instability across care delivery teams. More importantly, retention is not only a workforce issue. It reflects whether the health system is designed in a way that enables physicians to practice medicine effectively.
What does physician retention reveal about health system design?
Physician retention can serve as an indicator of whether a health system supports or obstructs the practice of medicine. When physicians feel that workflows, support structures, compensation, and clinical operations help them work at the top of their license, they are more likely to stay. When those systems create friction, retention risk increases.
What factors most influence whether physicians stay or leave?
Research shows that physicians’ decisions are shaped less by workload alone and more by the overall design of the clinical system, particularly the care environment and total rewards.
What is meant by the care environment?
The care environment refers to whether physicians have the autonomy, staffing, equipment, operational support, and trust needed to deliver high-quality care.
How do operational barriers affect physician retention?
Administrative burdens, inefficient workflows, and inadequate support can gradually pull physicians away from patient care and increase dissatisfaction, ultimately raising retention risk.
Why do total rewards matter beyond compensation alone?
Total rewards signal fairness, transparency, and professional respect. When aligned with expectations, they reinforce trust in leadership and organizational commitment.
What are the strongest signals behind physician turnover risk?
Key signals include clinical autonomy, pay equity, and care team culture, all of which influence how physicians perceive their experience and long-term fit within an organization.
What should health system leaders do to improve physician retention?
Leaders should evaluate whether systems support physicians’ ability to practice effectively, including workflows, compensation structures, and team resources, and make structural improvements where needed.

PODCAST | Physician Compensation Compliance: Building Defensible Governance Frameworks
We’re featured in a special episode of McDermott Will & Schulte’s Governing Health podcast
How are organizations navigating physician compensation compliance through the ‘Big Three’ and beyond?
In this episode of the Governing Health Series from McDermott Will & Schulte, SullivanCotter’s Tom Trachtman explores the latest developments in physician compensation governance.
Hear more from him on:
- Building mature and defensible governance frameworks in an era of heightened regulatory enforcement
- Developments in Stark Law, the Anti-Kickback Statute, and the False Claims Act
- Navigating dual-committee oversight, FMV standards, and more
- Balancing compliance with strategic goals

VIDEO | Improving Patient Access with Advanced Practice Providers
Patients are waiting longer than ever for access to care...
It’s time to unlock the full potential of your APP workforce!
As many health systems face rising costs and growing workforce shortages, patients are waiting longer than ever for access to care. Advanced practice providers are an often-overlooked opportunity to help address this issue. While most organizations employ nurse practitioners and physician assistants – many are not utilizing them to their full potential.
SullivanCotter’s Joel Villegas explains how APPs can help organizations to realize significant gains in productivity, access, and professional revenue. Dive deeper into APP utilization, deployment, and team-based models of care at SullivanCotter.com!
Leverage your APP workforce to address financial and access challenges!
Let’s start the conversation.
Video Transcript
My name is Joel Villegas and I’m a Consulting Manager with SullivanCotter. I work in our Physician and APP Workforce Practice, and for over 10 years I have been guiding health systems as they redesign advanced practice provider and physician care models and compensation plans to better support their providers and patients.
Many health systems today are facing financial challenges. Rising labor costs, growing demand for services, and ongoing workforce shortages are all creating real pressure. At the same time, patients are waiting longer than ever for access to care. One important opportunity often overlooked is how advanced practice providers, including nurse practitioners and physician assistants, are being utilized. Most organizations employ APPs, but in many cases their full potential remains untapped. We have found that with an intentional redesign of the care model, organizations can unlock significant productivity gains, improve access for patients, and enhance professional revenue.
Some examples of how APPs can optimize practice are:
Serving as primary care providers, expanding panel capacity, managing defined subsets of patients independently, seeing pre- and post-op patients as well as identifying candidates for surgery, managing consults and treating emergency patients, which allows physicians to focus on the most complex cases.
When APPs are deployed this way, they are practicing at the top of their license. That not only improves patient access and revenue, it also increases engagement for APPs and creates new ways for physicians and APPs to collaborate as a team. And we know from our work with clients that engaged APPs are more likely to stay with an organization rather than look for another opportunity.
At SullivanCotter, we help organizations evaluate the opportunity to increase APP productivity which impacts access and revenue. We also assess cultural readiness for change. Once that is understood, we support organizations through a care model optimization process that guides provider teams with change management strategies to create a new care model that optimizes the role of the APP.
If you are interested in learning how your organization can better leverage APPs to address financial and access challenges, we would love to connect.

VIDEO | Preparing for an aging physician workforce
25% of all physicians will reach retirement age by 2030...
Is your organization prepared for an aging physician workforce?
Accurately assessing changing service needs and clinical workforce staffing requirements is critical as market-specific supply and demand continues to evolve. In addition to determining the right number and type of physicians and advanced practice providers required to operate effectively in the communities they serve, organizations must also address other needs from their workforce planning initiatives.
In this video, Jaclyn Zurawski explains how SullivanCotter partners with organizations to identify the greatest gaps in the local markets, ensure proactive physician succession plans are in place, and develop long-term recruitment and retention strategies to meet demand in the coming years.
Learn more about our proprietary Provider Needs Assessment
We can help you accurately assess clinical staffing requirements and changing workforce needs!
Video Transcript
Hi, my name is Jaclyn Zurawski. I’m a Principal with SullivanCotter and have been with the firm for eight years. My focus is on workforce strategy, and I lead our Provider Needs Assessment team.
By 2030, approximately 20% of the total US population will be 65 or older. This is a 14% increase from today. These Medicare-eligible seniors continue to have longer lifespans and are higher utilizers of health care services.
As the population ages, so do the physicians caring for these patients. 25% of all physicians will reach retirement age by 2030. This creates a significant gap between patient demand and physician supply across all specialties.
The makeup of the population and physicians varies market to market, and therefore, it’s imperative that health care systems have an accurate understanding of the market need and the age and productivity levels of the physicians practicing in their specific markets to ensure proactive succession plans are in place to fill the gaps and meet patient demand in the coming years.
Accurately assessing changing service needs and clinical workforce staffing requirements is critical as market-specific supply and demand continues to evolve. In addition to determining the right number and type of physicians and advanced practice providers required to operate effectively in the communities they serve, organizations must also address other needs from their workforce planning initiatives.
This includes monitoring potential retirements and reductions in clinical productivity levels to help inform succession planning needs. As more physicians ease into retirement over the next three to five years, and early career physicians place greater value on work-life balance than past generations, having a succession plan in place can help fill key vacancies and support your organization’s overall talent strategy.
At SullivanCotter, we partner with health systems across the country to provide accurate, data-driven provider needs assessment insights to identify the greatest gaps in the local markets, ensure proactive physician succession plans are in place, and develop long-term recruitment and retention strategies to meet demand in the coming years.

Case Study | Radiology: Enhancing Service Alignment and Strategic Partnerships
Facing radiology coverage challenges?
Discover how we helped a regional not-for-profit health system modernize and realign its relationship with an independent radiology group!
Radiology is at a pivotal moment as many organizations are grappling with a growing shortage of specialists. This challenge has been intensified by an aging workforce, rapid advancements in technology, and rising demand for patient care services. In response, health care systems are pursuing a range of approaches –one of which is restructuring relationships with independent radiology groups.
In this case study, explore how we partnered with a health system to renegotiate its Professional Services Agreement with an independent radiology group.
Through a data-driven, collaborative approach, the organization addressed longstanding operational and financial challenges—ultimately establishing a more stable foundation for growth, improving physician engagement, and enhancing access to radiology services across the communities it serves.
What were this system’s challenges, how did we approach them, and what were the outcomes?
CHALLENGES
- Independent radiology group (Group) found it difficult to recruit and retain physicians due to gap between professional collections, operating expenses, and the market rate for imaging services
- Complex existing structures involved a mix of service line agreements and a Joint Venture (JV) – making it difficult to structure future alignment
- System leadership lacked a clear understanding of current market standards in compensation, productivity, and operational overhead to ensure FMV
- Difficulty overcoming the hospital-group deadlock required external mediation to secure a mutually beneficial agreement
APPROACH
- Conducted in-depth interviews with stakeholders on both sides to understand goals and impediments
- Performed robust market benchmarking assessment of the Group’s compensation, productivity, operations, and financial terms
- Analyzed existing JV and service agreements to compare benefits, malpractice expenses, staffing and equipment costs
- Facilitated joint planning meetings to guide both parties through the development of a new PSA structure
- Developed a detailed term sheet to address funds flow, subsidy arrangements, and operational expectations to ensure all expenses were transparent
OUTCOMES
Our two-phased assessment and negotiation process focused on transparency, data-driven insights, and consensus-building.
This enabled the system to realign its partnership and stabilize the provision of radiology services for the communities in which it operates.
New Alignment Structure: Successfully implemented a modernized Professional Services Agreement aligned with current market realities by integrating at-risk compensation tied to objective performance metrics – ensuring a fair-market, sustainable model for long-term growth.
-
Optimized Joint Venture Strategy: Assessment provided clarity on the JV – allowing both parties to foster a partnership focused on a mutually beneficial, long-term service expansion.
-
Data-Driven Consensus: Utilized objective market data to move the negotiation process from subjective debate to fact-based agreement. This significantly improved trust and engagement between the health system and the Group.
-
Long-Term Service Continuity: Ensured that clinical and operational performance metrics are aligned with the health system’s strategic objectives – strengthening access to high-quality radiology services for the region.
Is it time to renegotiate?
Professional services agreements are an integral part of a health system’s physician and service line strategy. Selecting the appropriate model, designing effective terms, and monitoring compliance and performance are critical to driving desired results.
As market dynamics, regulatory requirements, and organizational priorities evolve, agreements that once worked well can quickly become misaligned. Regular evaluation ensures your arrangements remain compliant, competitive, and strategically aligned.
Contact us to see how we can support you!


Healthcare Business Today | Why Stabilized Clinician Turnover Does Not Equal Recovery
Recent data from Lotis Blue and SullivanCotter indicates that while healthcare turnover rates have declined from pandemic highs, this shift does not signal a full workforce recovery. Turnover is a lagging indicator and does not reflect ongoing challenges related to staffing capacity, clinician workload, and care demand.
Data from our recent research entitled The Science of Staying: The Next Chapter in Clinician Retention, which features input from more than 1,000 clinicians across 300 organizations, shows that 80% of clinicians intend to stay in their roles. However, 11% report they are likely to leave within the next year. Among those who have recently exited, nearly 60% cite job-related factors as the primary reason for departure. These findings suggest that underlying drivers of dissatisfaction, many of which are within organizational control, remain in place despite lower overall turnover rates.
The report also highlights that retention is influenced by multiple factors. Compensation and benefits are necessary but are generally viewed as baseline expectations. Beyond that, clinicians place greater importance on elements such as workload, staffing levels, organizational support, and opportunities for professional growth. These factors have a more direct impact on long-term retention.
For health care leaders, the findings underscore the need to look beyond turnover metrics when assessing workforce health. Stabilizing exit rates is only one component of recovery. Addressing the root causes of dissatisfaction – particularly those related to the work environment and day-to-day experience – is critical to improving retention, maintaining capacity, and supporting consistent care delivery.
IN CASE YOU MISSED IT:
Get your hands on the full report!
This innovative research draws on feedback from more than 1,000 clinicians across 300+ health care organizations nationwide to provide the latest look into the psychological drivers behind turnover and clinician retention. It includes insight into 38 different elements of the Employee Value Proposition.
View our on-demand webinar!
During this session, we unpack data and insights directly from this year’s report. This includes underlying factors influencing the decision to stay, consider leaving, or quit, differences in employee value proposition drivers that most strongly predict retention for physicians, APPs and nurses, and key considerations for focusing retention efforts where they matter most.

VIDEO | Recruitment and Retention Challenges in Community Health Systems
There's a growing financial strain on community health systems...
Explore a smarter path forward with insights from our experts.
Community health systems, regional or local health systems whose primary mission is to provide accessible and affordable care, are facing growing financial challenges.
The gap between what physicians earn and what these health systems collect in these markets continues to widen – making it difficult to sustain physician compensation at competitive levels.
In this video, SullivanCotter’s Tim Stamper explains this imbalance and explores how community health systems can address these issues.
See how we can partner with your organization!
We can help your community health system leverage data-driven compensation strategies to strengthen physician recruitment and retention.
Video Transcript
Hi, my name is Tim Stamper. I’m a Principal with SullivanCotter in our Physician and Advanced Practice Provider Workforce. I’ve been assisting hospitals and health systems design and evaluate provider compensation plans and assess provider performance for over 15 years.
Community health systems, which we generally define as regional or local health systems whose primary mission is really to provide accessible and affordable care, play a critical role in care delivery across the country.
But right now, they’re facing growing financial challenges. Our latest Physician Compensation and Productivity Survey reveals a widening gap between what physicians earn and what the health system collects in these markets.
Community health systems generally can’t sustain compensation at similar levels to large health systems because their collections lag the national average by a larger percentage than cash compensation. For example, physicians in primary care, surgical specialties and hospital-based specialties all earn compensation approximately 3% to 5% below national benchmarks.
However, this leads to point number two, which is that collections are even lower. Across many specialty areas, collections are flat or even declining from prior years. Community health system collections in the same specialty area that I just noted are nearly 10% lower than national benchmarks. This is largely due to a lack of scaling power and leverage with insurers – likely leading to lower reimbursement rates.
The result of this issue is higher total cash compensation to collections ratios. In short, this is leading to a sustainability issue. Community health system organizations have to be competitive with the national market, but they aren’t collecting as much in professional revenue. This imbalance is continuing to drive labor costs higher and putting additional strain on financial sustainability at a time when resources are already stretched thin.
Given these issues, what’s our path forward? At SullivanCotter, we’re helping community health systems in this space by tackling the following issues:
1) Implementing core performance expectations. This includes clearly defining minimum work standards around what it means to be a provider within your system.
2) Building smarter care teams where everyone works at the top of their license. Given the current balance sheet of many health systems, workforce optimization is a very hot topic.
3) Investing in recruitment and retention strategies that really focus on the local community. So this includes provider needs assessments and proactive succession planning.
4) Reviewing professional services agreements to ensure that independent contractors are both aligned with system-wide strategies and market competitive from a benchmarking standpoint.
By grounding decisions in the right data, community health systems can really find that balance between competitive pay, strong performance, and long-term sustainability.
That’s how we shape future success.

Leadership Competency Models for the Next Era of Health System Leadership
In a time of transformation, health systems need a clearer definition of leadership.
But what, exactly, should that leadership look like?
By Jackie Basset, Principal, and Alexandra Bullock, Senior Consultant – Lotis Blue Consulting, SullivanCotter’s sister organization
The complexity of change in health care today, marked by workforce shortages—financial strain, growing demands for health equity, digitally-enabled care, and significant regulatory and policy shifts—is rapidly outpacing many organizations’ ability to respond. These challenges are not merely operational or strategic hurdles; they represent fundamental leadership issues that demand immediate attention and clear direction.
In this environment, health systems must elevate and equip leaders who can drive transformation while staying grounded in mission, culture, and strategy. But what, exactly, should that leadership look like?
Too often, organizations lack a consistent answer. Leadership expectations are implied rather than explicit. Development programs are well-intentioned but disconnected. Succession decisions default to tenure or reputation rather than readiness or fit. As a result, talent strategies remain fragmented and leaders are left without a clear picture of what’s expected of them.
Leadership competency models offer a better way forward. When thoughtfully designed and fully integrated, they define great leadership in the organization’s unique context. They align behavior with strategy, bring clarity to development, and strengthen accountability at every level.
Yet many health systems remain uncertain. Are competency models too abstract? Too HR-driven? Too time-intensive to be worth the investment?
This article aims to address those doubts. Drawing on research, we explore what leadership competency models are, why they matter, how they differ in health care compared to other industries, and how systems are using them today to shape the future of leadership—starting with a simple but powerful question.
If you asked ten of your leaders to define great leadership, would you get ten different answers?
This is the leadership alignment challenge that many health systems face. In a time when clarity, speed, and cultural consistency are paramount, organizations cannot afford ambiguity around what they expect from their leaders.
Competency models bring order to this ambiguity. At their core, they serve as a structured framework that defines the behaviors, skills, and mindsets required to lead effectively within a specific organization. They are not just a list of traits, nor are they generic templates pulled from other industries. When done right, they translate your health system’s vision and aspirations into concrete, observable leadership behaviors, that are required to execute your strategy and thrive in an increasingly challenging environment.
Contrary to common perception, these models are not only for HR. In fact, their greatest impact is felt when used by executives, mid-level leaders, and managers to guide real talent decisions, whether selecting the next CMO, designing a leadership development program, or conducting a performance conversation.
Nor are they static. The most effective models evolve alongside the organization’s priorities. Leading health systems revisit their models every three to five years, refining the language and focus to reflect changes in the environment and emerging expectations of leadership.
Competency models can be embedded in nearly every aspect of the talent lifecycle, from how leaders are hired and promoted, to how they’re developed, evaluated, and coached. And when embedded deeply, they serve as the connective tissue between leadership behavior and organizational performance.
What do top-performing health systems prioritize in their leadership models?
Our research across more than a dozen high-performing academic medical centers, integrated delivery networks, and regional health systems reveals a strong degree of alignment in the competencies they consider most critical.
Across these models, five themes consistently rise to the top:
- Leading Change and Fostering Innovation
As disruption becomes constant across care delivery, leaders must guide teams through change and create a culture of innovation. This includes navigating uncertainty, encouraging new ideas, and driving transformation proactively, not just reacting to it. - Strategic Thinking and Systemness
Leaders need to think beyond their individual areas and make decisions that support the broader enterprise. Systemness means aligning actions with system-wide goals, balancing local and organizational needs, and integrating clinical, operational, and financial perspectives. - Collaboration and Relationship Building
Strong relationships are foundational in health care. Leaders must foster trust and collaboration across teams, disciplines, and functions, ensuring that diverse voices are heard and aligned toward shared outcomes, both internally and with external partners. - Talent Development
Great leaders don’t just deliver results, they grow others. This includes coaching, mentoring, and creating development opportunities that build individual and team capacity, while ensuring long-term leadership and workforce strength. - Personal Accountability and Mission Alignment
Effective leaders model integrity, own their impact, and stay grounded in the organization’s mission. In health care, leadership is about stewardship—aligning personal behavior with the values, purpose, and priorities of the system.
These themes reflect not just what leaders need to do, but how they need to show up in a health care environment increasingly defined by complexity, integration, and human connection.
How leadership competencies have evolved over the years
Over the past five years, leadership competency models in major health systems have evolved significantly in response to the increasingly complex and rapidly shifting health care landscape. Key shifts include a move from a primary emphasis on clinical expertise toward strategic and systems thinking, recognizing that effective leadership now requires a broader, enterprise-wide perspective. Operational efficiency, while still critical, has given way to an expanded focus on innovation and digital transformation, as health systems strive to leverage technology for improved outcomes and patient experience. Additionally, traditional stakeholder management has evolved into collaboration and interdisciplinary leadership, reflecting the importance of fostering strong relationships across departments, disciplines, and external partnerships. Finally, with increasing workforce pressures, health systems have placed greater importance on resilience, stress management, and intentional talent development, ensuring a sustainable pipeline of capable, adaptive leaders equipped to navigate future challenges.
How health care leadership models differ from other industries
While many core leadership traits like communication, integrity, and results orientation are shared across sectors, health care leadership models reflect a distinct set of priorities rooted in the unique context of care delivery.
Mission-Driven Context: Health care leaders operate in a mission-driven environment where the stakes are higher and the definition of success is broader. Unlike corporate settings, where performance may be measured by growth or shareholder value alone, health systems must also consider patient outcomes, health equity, community impact, and cultural alignment.
Emphasis on Values-Based Leadership: Health care models place a stronger emphasis on values-based leadership. Competencies often include language around clinical collaboration, community accountability, and cultural humility—elements that are rarely emphasized in traditional corporate frameworks.
The Rising Importance of Emotional Intelligence: Another key distinction is the growing prioritization of emotional intelligence. While health care historically underinvested in leadership “soft skills,” that is changing rapidly. Today’s leaders must demonstrate empathy, manage complex interpersonal dynamics, and foster inclusive, psychologically safe environments, particularly in high-pressure, high-stakes settings.
Unified and Tiered Model Structures: Structurally, health care competency models tend to adopt unified system-wide frameworks with tiered behavioral expectations by leadership level, rather than developing role-specific competency maps. This approach promotes consistency across the organization while allowing for developmental nuance and progression.
Blending Science with Purpose: Ultimately, while health system models draw from behavioral science, they apply it through a lens of mission, ethics, and the lived realities of care. The result is a leadership approach that prioritizes not just what leaders achieve, but how they show up for their teams, their patients, and their communities.
How health systems are using competency models today
The best models are not theoretical, they are lived. They show up in the way leaders are selected, developed, and held accountable.
Across systems, we see models being used to guide 360-degree feedback processes, shape executive coaching conversations, and inform individual development plans that are grounded in real behaviors. Leadership programs are increasingly structured around key competencies, with curriculum aligned to the organization’s priorities.
Performance evaluations now often include both “what” and “how”, measuring results achieved as well as the way in which leaders lead. Succession planning efforts are also becoming more rigorous, with readiness assessed not only on experience, but on demonstrated alignment with core leadership expectations.
At one health system, the leadership model was used to elevate cultural humility as a core competency. That focus led to deeper integration of inclusive leadership practices into coaching engagements and succession decisions, resulting in a more diverse and values-aligned executive pipeline.
At another, competency models helped redefine how leadership success is measured, embedding both operational outcomes and culture-building behaviors into annual performance plans.
These examples underscore the point: competency models are not about checking a box. They are about operationalizing what leadership should look like in service of a broader mission.

Building a leadership competency model that works
Creating or updating a leadership competency model doesn’t require starting from scratch, but it does require intention and alignment. The most effective efforts begin by grounding the model in the system’s strategy, culture, and future direction, not by pulling in generic language from elsewhere.
The following success factors can help ensure your model is not only well-designed, but also adopted, applied, and sustained:
Anchor in Strategy and Culture: Creating or updating a leadership competency model should begin with a clear link to your organization’s mission, strategy, and culture. Rather than borrowing generic language, ensure the model reflects your unique values, priorities, and challenges. This grounding makes the model relevant and ensures it supports broader system goals, whether that’s improving patient outcomes, advancing equity, or navigating industry shifts. A well-aligned model becomes a strategic tool, not just an HR asset.
Engage Stakeholders Early: Involving a diverse set of leaders—clinical, operational, and administrative—early in the process is essential for buy-in and relevance. When stakeholders see their perspectives reflected in the model, they’re more likely to champion it. Cross-functional input also ensures the competencies reflect the lived realities of leadership in your health system, not just aspirational ideals. Engagement builds ownership and increases the model’s utility across roles.
Define Observable Behaviors: High-performing models go beyond abstract definitions to describe what each competency looks like in action. This means clearly articulating behaviors that signal proficiency at various levels. Observable indicators make expectations transparent and help leaders understand what “good” looks like. They also make the model easier to apply in development conversations, performance reviews, and coaching.
Pilot Before Broad Rollout: Before launching system-wide, test the model with a smaller group such as a specific leadership level or functional area. This pilot phase helps surface unclear language, missing behaviors, or unintended gaps. Gathering feedback allows you to refine the model and build early champions who can advocate for it during broader adoption. It’s a low-risk way to ensure the model is clear, relevant, and ready for scale.
Integrate Into Core Talent Processes: A competency model only gains traction when it’s embedded in the processes leaders already use like hiring, performance evaluations, development planning, and succession reviews. Embedding reinforces its relevance and creates consistency in how leadership is assessed and supported. It also enables leaders to use the model as a common language for expectations, growth, and accountability.
Keep It Dynamic: The best models evolve over time. As strategies shift and leadership challenges change, revisit the model every few years to ensure continued relevance. Treat it as a living tool to support leadership development, not a static document. Refreshing the model keeps it aligned to future needs and helps it remain a driver of learning, not just compliance.
Pro tip: Don’t try to do it all at once. Start by building and testing the model with one group such as executives or a specific leader segment before expanding it system-wide. Beginning with a focused cohort allows you to refine the model and create a strong foundation for broader adoption, ensuring clarity, cohesion, and long-term scalability.
The hidden cost of not having a model
Avoiding competency models due to concerns over rigidity or resource investment overlooks the significant costs of undefined leadership expectations: fragmented development, inconsistent promotions, reactive succession planning, and perpetuation of bias. Without clarity, organizations struggle to scale strategic execution, accountability, and cultural alignment.
In contrast, health systems leveraging clearly defined and integrated competency models are demonstrably better positioned to develop and retain top talent, drive cultural cohesion, and embed equity in leadership practices. Such systems cultivate leaders who lead purposefully, embodying mission-driven values at every level.
The case for defining leadership now
Defining leadership is not a luxury. It’s a strategic imperative.
As the workforce evolves, care models shift, and patient expectations rise, health systems need to be crystal clear about who they want leading the way forward and how they expect them to lead.
A strong competency model won’t solve every challenge. But it provides a powerful foundation for building the kind of leadership your system and your patients deserve.
If your health system is exploring how to define or evolve its leadership expectations, now is the time to invest in a model that reflects both where you are and where you’re going.
Editor’s note: A condensed version of this article first appeared in Chief Healthcare Executive. The full version is presented here.
Frequently Asked Questions
What is a leadership competency model?
A leadership competency model is a structured framework that defines the behaviors, skills, and mindsets leaders need in order to succeed within a specific organization. In health care, it translates a system’s strategy, mission, and culture into clear, observable leadership expectations.
Why do health systems need leadership competency models now?
Health systems are navigating workforce shortages, financial strain, health equity demands, digital transformation, and ongoing regulatory change. In that environment, competency models help reduce ambiguity by clarifying what leadership should look like and aligning talent decisions with organizational strategy.
Are leadership competency models only for HR?
No. While they are often associated with HR, their greatest value comes when they are used by executives, managers, and other leaders to make real talent decisions. They can guide hiring, promotion, succession planning, performance discussions, coaching, and leadership development.
What leadership competencies do top-performing health systems prioritize?
The article identifies five themes that consistently rise to the top: leading change and fostering innovation, strategic thinking and systemness, collaboration and relationship building, talent development, and personal accountability with mission alignment. Together, these reflect the demands of modern health care leadership.
How have leadership competency models evolved in recent years?
Over the past several years, health systems have shifted away from models centered primarily on clinical expertise and operational efficiency. Greater emphasis is now placed on strategic and systems thinking, innovation and digital transformation, interdisciplinary collaboration, resilience, stress management, and intentional talent development.
How do health care leadership models differ from those in other industries?
Health care leadership models are more explicitly mission-driven and values-based. They often emphasize patient outcomes, health equity, community impact, clinical collaboration, cultural humility, and emotional intelligence. They also tend to use unified, system-wide frameworks with tiered expectations across leadership levels rather than highly role-specific models.
How are health systems using competency models today?
Health systems are using competency models in practical ways across the talent lifecycle. They inform 360-degree feedback, executive coaching, individual development plans, leadership program design, performance evaluations, and succession planning. In strong models, competencies are not theoretical; they shape how leadership is selected, developed, and measured.
What makes a leadership competency model effective?
Effective models are grounded in organizational strategy and culture, shaped by stakeholder input, defined through observable behaviors, piloted before full rollout, and embedded into core talent processes. They also remain dynamic, with leading organizations revisiting and refining them every few years to keep pace with changing priorities.

ON-DEMAND WEBINAR | Redefining Health System Leadership
What do today’s market shifts mean for tomorrow’s CEOs?
Hosted by the American Hospital Association
Health care organizations are dealing with relentless financial pressure, continued workforce shortages, and growing expectations from boards, regulators and their communities alike.
These forces are reshaping how health systems operate.
During this session, experts from SullivanCotter and Lotis Blue Consulting explore how the role and required competencies of the CEO are evolving as the industry transforms itself.
In this session, Aaron Sorensen, Ph.D., of Lotis Blue Consulting and John Putnam of SullivanCotter will examine how industry disruptions are reshaping the expectations, capabilities and attributes of future health system CEOs. Drawing on data from high-performing organizations, the presenters will explore the leadership behaviors most closely associated with success in today’s volatile environment, including decision quality, strategic foresight, enterprise accountability and cultural leadership.
Watch our webinar on-demand to hear us discuss:
- New competencies and attributes associated with high-performing CEOs
- Methodologies to strengthen CEO assessment, selection, and development
- Executive compensation strategies aligned with changing CEO expectations
Want to dive deeper into the data? Get your hands on the full report!
SullivanCotter and Lotis Blue Consulting partnered to conduct new research on what will define successful health system CEOs in the next era of health care.
The findings are clear: The future belongs to leaders with the cognitive, relational, and adaptive capabilities to guide systems through complexity and sustained transformation.
The study introduces the Health Care Potential Index (HCPI) – a data-driven framework that moves beyond traditional measures such as professional history, background, and tenure to measure true leadership potential. From strategic clarity to empathy and agility, future-ready CEOs must navigate disruption and drive transformation.
Sign up for instant access to the recording!

On-Demand Webinar | Science of Staying: The Next Chapter in Clinician Retention
Clinician turnover may be stabilizing – but is your health care workforce committed to staying?
In our latest on-demand webinar, our experts unpack the psychological drivers behind why clinical professionals stay committed, consider leaving, or ultimately quit their health care jobs.
This includes the latest data and insights from new research from SullivanCotter and Lotis Blue, The Science of Staying: The Next Chapter in Clinician Retention – which draws on input from more than 1,000 physicians, APPs, nurses, and other licensed professionals across 300+ health care organizations.
During this session, we highlight:
- How stabilization in turnover and retention does not equal recovery
- Underlying factors influencing the decision to stay, consider leaving, or quit
- Differences in employee value proposition drivers that most strongly predict retention for physicians, APPs and nurses
- Key considerations for focusing retention efforts where they matter most
IN CASE YOU MISSED IT: Get your hands on the full report!
This innovative research draws on feedback from more than 1,000 clinicians across 300+ health care organizations nationwide to provide the latest look into the psychological drivers behind turnover and clinician retention. It includes insight into 38 different elements of the Employee Value Proposition.
Sign up for instant access to the recording:

INFOGRAPHIC | Physician Compensation Spotlight: Pediatric Anesthesiology
Spotlight: Pediatric Anesthesiology
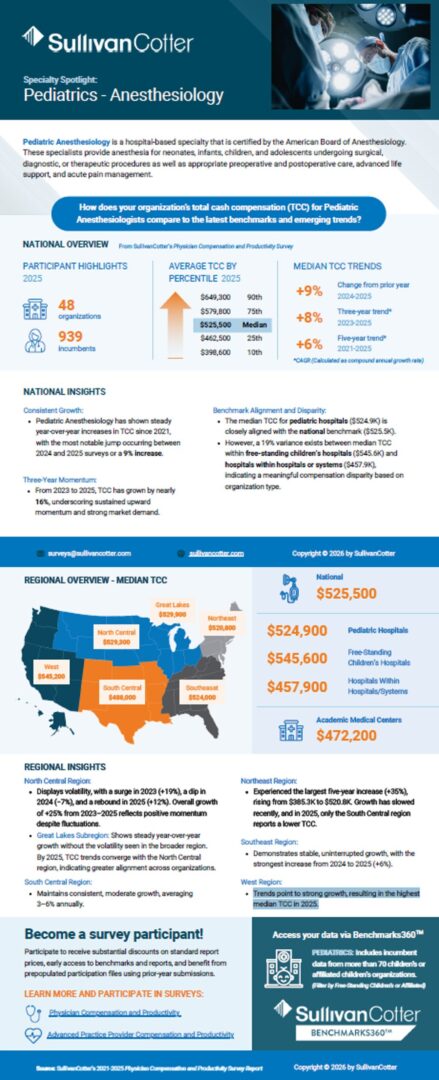
Pediatric Anesthesiology is a hospital-based specialty that is certified by the American Board of Anesthesiology. These specialists provide anesthesia for neonates, infants, children, and adolescents undergoing surgical, diagnostic, or therapeutic procedures as well as appropriate preoperative and postoperative care, advanced life support, and acute pain management.
How does your organization’s total cash compensation (TCC) for Pediatric Anesthesiologists compare to the latest benchmarks and emerging trends?
Explore the latest benchmarks from our 2025 Physician Compensation and Productivity Survey!
—
Don’t Forget: the 2026 Survey is Open for Participation
Secure exclusive pricing and benefits when you submit data to this year’s survey.
National Overview
from SullivanCotter’s 2025 Physician Compensation and Productivity Survey
Participant Highlights
- 48 organizations
- 939 imcumbents
Average Total Cash Compensation by Percentile
- 90th: $649,300
- 75th: $579,800
- Median: $525,500
- 25th: $462,5000
- 10th: $398,600
National Insights
Consistent Growth
- Pediatric Anesthesiology has shown steady year-over-year increases in TCC since 2021, with the most notable jump occurring between 2024 and 2025 surveys or a 9% increase.
Three-Year Momentum
- From 2023 to 2025, TCC has grown by nearly 16%, underscoring sustained upward momentum and strong market demand.
Benchmark Alignment and Disparity
- The median TCC for pediatric hospitals ($524.9K) is closely aligned with the national benchmark ($525.5K).
- However, a 19% variance exists between median TCC within free-standing children’s hospitals ($545.6K) and hospitals within hospitals or systems ($457.9K), indicating a meaningful compensation disparity based on organization type.
Regional Overview – Median TCC
- West: $545,200
- Great Lakes: $529,300
- North Central: $529,200
- Southeast: $524,000
- South Central: $488,000
Regional Insights
- North Central: Displays volatility, with a surge in 2023 (+19%), a dip in 2024 (−7%), and a rebound in 2025 (+12%). Overall growth of +25% from 2023–2025 reflects positive momentum despite fluctuations.
- Great Lakes Subregion: Shows steady year-over-year growth without the volatility seen in the broader region. By 2025, TCC trends converge with the North Central region, indicating greater alignment across organizations.
- South Central: Maintains consistent, moderate growth, averaging 3–6% annually.
- Northeast: Experienced the largest five-year increase (+35%), rising from $385.3K to $520.8K. Growth has slowed recently, and in 2025, only the South Central region reports a lower TCC.
- Southeast: Demonstrates stable, uninterrupted growth, with the strongest increase from 2024 to 2025 (+6%).
- West: Trends point to strong growth, resulting in the highest median TCC in 2025.
Learn more about our Physician Compensation and Productivity Survey!
For more than 30 years, this survey has been and continues to be the largest and most comprehensive physician compensation survey published.
Highlights include:
- Base salary and total cash compensation data as well as cost of benefits
- Productivity data and ratios, including work RVUs, collections, patient visits and panel sizes
- Value-based compensation approaches and amounts paid
- Data for multiple position levels from staff physicians to chairs
- National data reported by region, organization type, position level and specialty group
- Other data, including sign-on bonuses, retention bonuses, relocation assistance and other perquisites
- Data on over 231,000 individual physicians
- 500 participating hospitals, health systems and medical groups

On-Demand Webinar | What's Ahead for the Health Care Workforce in 2026?
Discover 5 imperatives for a changing health care landscape!
Intensifying financial pressures – from reimbursement challenges to rising labor costs – are forcing health care organizations to rethink how they operate.
Join us to explore five priorities to focus on in the year ahead to help your organization manage the workforce more strategically, strengthen performance, and support long-term sustainability:
1. Evaluate Organizational Structure
Evaluate span of control, clinical vs. non-clinical alignment, role clarity, and more
2. Assess and Refine the Operating Model
Support efficiency and adaptability
3. Ensure Leadership Stability
Strengthen continuity across the executive team and broader leadership bench
4. Enhance Models of Care
Improve access, team effectiveness, and patient experience
5. Attract and Retain the Clinical Workforce
Navigate persistent shortages and increasing demand
Sign up for instant access to the recording:

VIDEO | Rethinking the RN Pay Journey
Nursing has never been more complex – or more essential.
But does pay truly reflect the growth, expertise, and responsibility RNs take on throughout their careers?
We’re breaking down the latest data from our Registered Nursing Compensation Survey:
In this video, we explore early-career wage growth, mid- and late-career pay plateaus, and the growing impact of pay compression.
You’ll also learn how organizations are making targeted investments in RN leaders and managers, how specialty premiums are shaping base pay trends, and why regional differences matter more than ever.
Watch to see where RN pay stands today – and where it may be headed next.
Empower your organization to effectively shape your RN workforce strategy moving forward!
VIDEO TRANSCRIPT
Nursing has never been more complex – or more essential. Registered nurses grow continuously over the course of their careers. They gain experience, they expand skills, and they take on greater responsibility. But financially, many RNs are encountering a different reality. Career growth does not always lead to pay growth.
RNs who start their journey as a new graduate RN role experienced no movement in the first half of 2025. Early career pay growth is often the most meaningful up until year 10. But, as experience accumulates, wage progression often slows and in some cases, it flattens.
Survey experience-based medians for staff RNs show that pay increases steadily early on, then begins to plateau later in the career journey. The result is pay compression, where the financial value of experience erodes just as clinical judgment and operational reliance peak.
SullivanCotter’s latest nursing compensation data shows organizations are making targeted investments in RN pay, prioritizing certain roles, specialties, and geographies.
In the first half of 2025, RN leaders and managers saw the largest median base pay increases – 3.0% for leaders and 2.7% for managers. Meanwhile, supervisors, charge nurses, and staff RNs experienced lower median movement.
To maintain the long-term health and equity of nursing compensation programs, many organizations are addressing pay compression by first prioritizing managers and leaders.
That targeted approach is visible across regions as well. In the first half of 2025, organizations nationwide increased base pay for RN managers at a higher rate than staff or supervisory roles – marking a notable shift from recent years.
Across most regions, RN manager base pay grew between 2.3 and 2.9% in just six months. At the same time, staff RN base pay growth remained more modest – generally below 2%.
In most parts of the country, one region stands out. In the Northeast, Staff RN base pay increased by 3.6% – outpacing staff investment in every other region. This variation highlights how organizations are responding differently to local workforce pressures while continuing to prioritize leadership roles nationally.
Many nurses advance professionally without meaningful base pay progression. They become preceptors, charge nurses, senior or lead RNs. Each role carries more responsibility, more decision-making, and greater accountability. Yet base pay often changes very little. Advancement into supervisory or management roles is sometimes viewed as the only path forward, but that path is not for everyone.

CASE STUDY | Enhancing Value-Based Physician Compensation Through Payer Contract Alignment
Unlock greater revenue potential and increase physician participation in value-based initiatives!
Originally published by the American Association of Provider Compensation Professionals
Written by SullivanCotter: Rob Moss – Principal, Stan Stephen – Principal, and Jaime Lough – Consulting Principal
Amid the ongoing shift toward value-based care, organizations are under increasing pressure to ensure that physician compensation models effectively support both clinical excellence and financial sustainability. Yet many systems struggle to fully capitalize on payer incentive opportunities due to misaligned metrics, insufficient performance tracking, and limited physician engagement. This case study of a private, not-for-profit health system illustrates how a strategic restructuring of physician compensation – one anchored in payer contract alignment – can unlock greater revenue potential and increase physician participation in value-based initiatives while also improving quality-based outcomes.
Background and Challenges
Prior to this transformation, the health system faced structural and operational challenges within its physician compensation model. Although the organization participated in multiple payer pay-for-performance (P4P) arrangements, it left substantial revenue unrealized by capturing only 29% of available incentive dollars. This misalignment was problematic as the system was spending more than $10 million annually on physician performance incentives while recovering only $5 million through payer awards. The imbalance was not only a financial strain but also raised concerns from the health system and medical group leadership about the sustainability of the compensation model.
Further compounding the challenges, limited performance-tracking capabilities hindered the organization’s ability to improve results. Existing systems lacked the depth needed to identify high-value payer contract opportunities or to connect physician actions directly to contract performance. In addition, incentives were often applied uniformly across specialties, despite varying levels of influence over quality and utilization metrics. As a result, some specialists were unable to meaningfully impact the measures tied to their compensation – which led to frustration or disengagement.
Physician engagement represented another major hurdle. Only 25% of physicians regularly reviewed their performance scorecards, suggesting that incentives were not clearly understood or not viewed as actionable. Without transparency, relevance, or timely feedback, performance incentives failed to drive meaningful behavioral change which resulted in the inability to realize payer contract incentive dollars.
Strategic Transformation Process
To address these challenges, this organization worked with SullivanCotter to implement a comprehensive five-phase transformation approach designed to realign compensation with payer contracts while improving physician engagement and accountability.
The process began with data analysis and assessment, including a retrospective review of historical payer incentive performance. The organization identified high-value P4P opportunities across quality, utilization, and patient experience metrics, while also assessing every specialty’s ability to influence specific measures. This analysis established a clear baseline for future prioritization.
Next, there was a goal alignment phase in which service line objectives were restructured to focus explicitly on identifying additional payer revenue opportunities. The organization incorporated indirect performance metrics—such as care coordination and documentation quality—that, while not directly tied to incentives, significantly influenced overall contract performance. Specialty-specific performance targets were developed to ensure relevance and fairness.
Financial modeling then translated these goals into actionable physician compensation strategies. Detailed financial models were created to project potential impact, established return-on-investment (ROI) thresholds for new value-based measures, and developed risk-adjusted compensation scenarios to balance opportunity with accountability.
Recognizing the importance of physician understanding and buy-in, the organization emphasized stakeholder engagement by forming multidisciplinary steering committees and specialty-specific work groups. These forums allowed physicians to provide input, validate assumptions, and understand how compensation changes would be connected to broader organizational goals.
Finally, the implementation and infrastructure phase focused on execution. The organization deployed a compensation management technology platform, enhanced reporting capabilities, and established care team support structures to help physicians succeed under the new model.
Key Innovations and Solutions
There were three critical areas underpinning the success of the transformation:
- Specialty-specific design ensured compensation and incentives reflected each specialty’s sphere of influence. Metrics were carefully selected to align with specialty-relevant quality measures, and performance thresholds were designed to be motivational – challenging yet attainable.
- Technology integration played a critical role. Advanced performance tracking tools enabled near real-time reporting, while improved data accessibility allowed physicians to monitor progress, identify gaps, and course-correct throughout the performance year—rather than reacting after the fact.
- Equally important was the development of a supportive infrastructure. Dedicated care teams, quality improvement resources, and structured performance review processes helped physicians translate data into action. This support shifted the perception of compensation from a retrospective evaluation tool to a proactive performance management system.
Conclusion
For compensation administrators and health system leaders, this case serves as a practical blueprint for navigating the complexities of modern physician compensation while advancing organizational and clinical goals. Aligning physician incentives with payer contract opportunities is essential for financial sustainability, but success also requires specialty-specific design, transparent performance tracking, and strong operational support. Technology alone is insufficient without physician engagement and the infrastructure needed to drive improvement.
The successful transformation of this health system’s physician compensation model demonstrates that intentional alignment between provider incentives and payer contracts can produce measurable gains in both financial performance and care quality. By grounding compensation in data-driven insights, engaging physicians as partners, and investing in enabling infrastructure, organizations can unlock the full potential of value-based care.

INFOGRAPHIC | Physician Compensation: Actionable Insights for Academic Medical Centers
Academic medical centers – let’s talk strategy.
Consider the following:
- Does faculty physician compensation support recruitment and retention?
- Do productivity levels support financial sustainability and growth?
- Does work effort allocation support patient access and the academic mission?
- Is APP compensation competitive compared to peers?
If these questions are top of mind – we have the data to help.
This infographic highlights key findings from the AMC Module of our Physician Compensation and Productivity Survey, reflecting data from more than 101,000 academic physicians and 58,000 APPs across 192 specialties.
Explore some highlights from the latest results!
—
Don’t Forget: the 2026 Survey is Open for Participation
Secure exclusive pricing and benefits when you submit data to this year’s survey.
What does the data say?
Clinical Full-Time Equivalents by Specialty Area and NIH Funding Level
- Primary Care | All AMCs: 0.74 – Less than $400M NIH Funding: 0.78 – More than $400M NIH Funding: 0.63
- Pediatrics | All AMCs: 0.80 – Less than $400M NIH Funding: 0.80 – More than $400M NIH Funding: 0.60
- Hospital-Based | All AMCs: 0.85 – Less than $400M NIH Funding: 0.90 – More than $400M NIH Funding: 0.79
- Surgical | All AMCs: 0.85 – Less than $400M NIH Funding: 0.90 – More than $400M NIH Funding: 0.80
- Medical | All AMCs: 0.75 – Less than $400M NIH Funding: 0.80 – More than $400M NIH Funding: 0.60
Median Total Cash Compensation for Staff Physicians and All Faculty
- Primary Care | Broad Market: $308,000 – All AMC Faculty: $261,000 – More than $400M NIH Funding: $246,000
- Pediatrics | Broad Market: $334,000 – All AMC Faculty: $290,000 – More than $400M NIH Funding: $282,000
- Hospital-Based | Broad Market: $363,000 – All AMC Faculty: $413,000 – More than $400M NIH Funding: $396,000
- Surgical | Broad Market: $551,000 – All AMC Faculty: $503,000 – Less than $400M NIH Funding: $450,000
- Medical | Broad Market: $362,000 – All AMC Faculty: $347,000 – Less than $400M NIH Funding: $305,000
Median Base Pay and Total Cash Compensation* for Nurse Practitioners and Physician Assistants Combined
- Primary Care | AMC Base Hourly Rate: $65.45 – AMC TCC Hourly Rate: $67.63
- Hospital-Based | AMC Base Hourly Rate: $67.97 – AMC TCC Hourly Rate: $71.48
- Surgical | AMC Base Hourly Rate: $67.72 – AMC TCC Hourly Rate: $69.64
- Medical | AMC Base Hourly Rate: $66.03 – AMC TCC Hourly Rate: $67.61
- *TCC Hourly Rate calculated using 2,080 annual hours excluding premium
Learn more about our Physician Compensation and Productivity Survey!
For more than 30 years, this survey has been and continues to be the largest and most comprehensive physician compensation survey published.
Highlights include:
- Base salary and total cash compensation data as well as cost of benefits
- Productivity data and ratios, including work RVUs, collections, patient visits and panel sizes
- Value-based compensation approaches and amounts paid
- Data for multiple position levels from staff physicians to chairs
- National data reported by region, organization type, position level and specialty group
- Other data, including sign-on bonuses, retention bonuses, relocation assistance and other perquisites
- Data on over 231,000 individual physicians
- 500 participating hospitals, health systems and medical groups


VIDEO | Attracting and Retaining Physicians in Pediatric Organizations
The pediatric physician workforce is at a critical inflection point.
Advances in treatments for children with complex needs have increase the demand for subspecialty care.
However, the number of physicians looking to specialize in pediatric care is not keeping pace – resulting in a highly competitive recruitment environment.
In our latest video, SullivanCotter’s Clara Hurtt shares how some pediatric organizations are responding by:
- Developing annual physician recruitment plans
- Conducting provider needs assessments to quantify future access gaps
- Increasing sign-on bonuses, relocation assistance and student loan repayment
- Evaluating compensation competitiveness and design
- Optimizing team-based care models to support physicians
Dive deeper into our expertise!
We can help your pediatric organization leverage data-driven compensation strategies to strengthen physician recruitment and retention.
Video Transcript
Hi, my name is Clara Hurtt. I’m a Principal with SullivanCotter in our Physician and APP Workforce Practice. I’ve been helping pediatric organizations assess and design physician performance and compensation strategies for almost 10 years.
The physician recruitment environment in pediatrics is highly competitive. Advances in treatments for children with complex needs have increased the demand for subspecialty care – resulting in nearly 40% of children in middle childhood and adolescence having at least one chronic condition.
However, the number of physicians who wish to specialize in pediatric care isn’t keeping pace with the demand. The pediatric residency match in 2024 was the worst in match history with only 92% of available slots filled versus 97% in 2023. While there was a rebound in 2025 with the largest number of future pediatricians in match day’s history, the number of residents interested in pediatrics still isn’t enough to keep pace with the growing demand.
Given the mounting market pressure and high demand for services, what are pediatric organizations doing to recruit and retain physician talent? Based on data gathered by SullivanCotter, as well as our experiences in the market, we are seeing organizations take multifaceted approaches.
First, there’s been a slight increase in the number of organizations creating and utilizing annual physician recruitment plan. Some organizations are completing provider needs assessments to support organizational strategies and reinforce the recruitment plan. As an example, one pediatric organization was able to quantify the potential impact on patient access through projected provider deficits in its geographic area within a three year timeframe based on anticipated clinician departures. This allowed the organization to create a succession plan and targeted recruitment plan to avoid future care gaps.
Second, the competition for talent is causing organizations to invest in recruitment strategies. We’ve seen an increase not just in the use of relocation assistance and sign bonuses but also in the value of these payments. In addition, we are hearing from more organizations that are considering student loan repayment and recruitment strategies as well.
Third, organizations are assessing the overall competitiveness of their compensation program. Many organizations start with an evaluation of available pediatric market survey data sources as they are doing their best to keep pace with market movement. Recognizing that it’s not just about the actual compensation, but how the compensation is delivered, organizations are also reviewing compensation design strategies to ensure that the resulting compensation balances retention with compliance.
Finally, organizations are assessing care teams to ensure that all providers, physicians, and advanced practice providers are working to the top of their license and appropriately building incentives to drive and reinforce team-based behaviors – which helps alleviate some, but not all, of the pressure on the number of physicians needed to meet patient demand.
By making decisions based on available data, pediatric organizations are better positioned to recruit and retain physician talent and, more importantly, to better meet patient care needs.

VIDEO | Enhancing Patient Access in Academic Medical Centers
Explore the key to maintaining patient access without compromising on your organization's critical academic and research commitments!
Academic medical centers operate in an increasingly complex environment – one in which they still need to uphold their tripartite mission of clinical care, teaching, and research.
In the midst of ongoing funding challenges that are impacting financial sustainability, one of the greatest challenges AMCs face is with maintaining patient access.
In this video, Bob Madden explains how SullivanCotter partners with academic medical centers to address these challenges through strategic workforce planning, clear performance expectations, and sustainable compensation design.
Dive deeper into our expertise!
Learn how we can help your organization to strengthen patient access, enhance performance, and sustain your mission in a rapidly evolving health care environment.
Video Transcript
Hi, my name is Bob Madden. I’m a Principal with SullivanCotter in our Physician and APP Workforce Practice. I’ve been assisting academic medical centers on all matters physician compensation for nearly 15 years.
Academic medical centers operate in an increasingly complex environment. They need to support their academic and clinical missions in the midst of ongoing funding challenges that impact financial sustainability.
Primary care strategies in AMCs have emerged to strengthen the community footprint, to improve patient access and the continuity of care – which often involves the treatment of highly acute patients. Patient access is almost always at or near the top of the list of ongoing challenges that our AMC clients are facing.
We leverage our data, research, and experience to help. Our physician compensation and productivity dataset includes over 80,000 AMC physicians, with data points on FTE, allocations, compensation, productivity, and pay-to-production ratios. In addition, we collaborate with the American Association of Medical Colleges on numerous research projects including surveys focused on faculty physician recruitment and retention.
So here is what our data research and experience suggest:
- AMCs are increasing clinical FTEs to refocus efforts on patient access and clinical productivity. The gap in clinical FTE between established and new-hire faculty physicians is as much as 20 percentage points according to current survey findings.
- The top initiatives cited by AMC leadership from our AAMC collaborative survey is improving patient access and care delivery alongside changing FTE allocations and work expectations.
- Primary care is a focal point of growth within most AMCs – not only to improve market share, but also to free up specialists to focus on the specialty and subspecialty care they train for rather than general patient care.
- Measuring patient access can be challenging. Variation exists in the market with respect to measuring and rewarding patient access and the physician compensation model.
In the midst of an evolving and challenging landscape, SullivanCotter is helping AMCs address their most pressing challenges in a variety of ways:
- We often start by conducting a comprehensive current state assessment to identify improvement opportunities in the following areas, improving patient care delivery by studying and optimizing care models to ensure that all care team members are working at top of license – which can improve patient access.
- We help standardize clinical FTE allocations and methodologies to support patient access while also maintaining adequate time to devote to the academic mission.
- We help implement minimum work expectations, including the core work expectations tied to FTE status and base salary, while also defining criteria for incentive eligibility.
- We help set clear benchmark parameters, including survey source selections and uses to create a common performance measurement platform.
- We also help define clear tracks for faculty whose work effort is predominantly research-focused or clinically-focused. The benchmarking of work expectations and compensation structures should be tailored to reflect these unique work profiles.
Once these foundational elements are in place, we assist AMCs with the development of new or enhanced compensation models to reward top performers across multiple dimensions of performance, such as patient access, in a financially sustainable way.

Case Study | Restoring Credibility and Capacity Through Co-Sourcing
Your trusted compensation partner
See how we worked alongside the in-house HR team at a large pediatric health system to regain control of critical compensation and HR processes via out innovative co-sourcing solution!
When a large pediatric health system faced significant leadership gaps, operational breakdowns and mounting credibility concerns within its compensation function, it needed more than temporary support — it needed a trusted partner. An HR leadership void, unclear workflows, underutilized technology and staff departures had left the team struggling to manage day-to-day operations while maintaining stakeholder confidence.
Through a flexible co-sourcing arrangement, SullivanCotter embedded experienced compensation leaders alongside the internal HR team to restore stability, strengthen processes and rebuild executive trust. By aligning strategy with execution, optimizing technology and enhancing team capacity, the partnership not only addressed immediate challenges but repositioned the compensation function for long-term success.
What were this system’s challenges, how did we approach them, and what were the outcomes?
CHALLENGES
- Leadership Gaps: An HR leadership void left the compensation team with limited experienced oversight
- Operational Breakdown: Unclear workflows with no defined compensation strategy and multiple data integrity issues
- Credibility Concerns: Slow decision-making caused by lack of confidence in compensation function
- Capacity Shortfalls: Team unable to handle day-to-day operations due to staff departures
- Widespread Inefficiences: HR technology investments were underutilized due to low adoption
APPROACH
- Embedded Expertise: Advisors with in-house compensation leadership experience provided guidance on strategy and execution
- Process Improvements: Redesigned workflows and introduced a centralized inbox to improve stakeholder experience
- Technology Optimization: Identified dormant platforms and implemented solutions that enhanced efficiency without added cost
- Vacancy Support: Designed interview guides, screened candidates, and onboarded staff to help fill critical gaps
- Strategic Alignment: Participated in executive-level planning sessions on fiscal management, workforce design, and more
OUTCOMES
By consolidating multiple projects into a more streamlined and flexible co-sourcing arrangement, SullivanCotter was able to deliver innovative solutions and insights as an embedded extension of the health system’s internal team
Operational Improvements
- Established a shared compensation inbox, streamlining processes and improving the customer experience
- Delivered technology solutions that enabled faster offer turnaround times and lowered candidate declination rates
Strategic Value
- Restored credibility with executive leadership, helping to guide and inform decision-making at the highest levels
- Partnered with business leaders beyond HR to assess current state of compensation practices and develop strategies for improvement
Talent Support
- Recruited and onboarded critical compensation staff to enhance team capacity and engagement
- Strengthened internal capability and team resiliency through training and process improvements
Business Impact
- Built lasting capabilities and optimized processes to reposition the compensation function
- Partnership was extended into the following year, underscoring its long-term strategic importance
See how co-sourcing can work for your organization!


Press Release | SullivanCotter Expands Health Care Valuation Capabilities with Acquisition of Specialized Team from Huron
Addressing a broader range of valuation needs with greater depth, speed, and precision
February 25, 2026 – CHICAGO – SullivanCotter, the nation’s leading independent consulting firm in the assessment and development of total rewards programs, workforce solutions, and data products for health care and not-for-profits, announced today the acquisition of the health care valuation services team from Huron, a global professional services firm.
The addition of these specialists – including six experienced professionals with deep expertise in valuation services – significantly expands SullivanCotter’s capabilities and strengthens its ability to serve health care organizations across an increasingly complex regulatory, transactional, and investment landscape.
The firm is pleased to welcome:
- Shane Goss, ASA – Managing Principal
- Patrick Kendall, CPA/ABV – Principal
- Patrick Nolan, CFA – Technical Lead – Health Care Business Valuation
- Julie E. Route, MAI – Consulting Manager
- Christopher Luedtke – Consulting Manager
- Elizabeth Kwan – Consulting Manager
“This acquisition represents an important step forward in our continued investment in valuation services,” said Mark Ryberg, President, SullivanCotter. “By adding dedicated resources and new technical capabilities, we are well-positioned to help our clients address a broader range of valuation needs with greater depth, speed, and precision.”
Building Dedicated Scale and Specialized Expertise
As SullivanCotter expands its services in response to changing market needs and growing client demand, this enables the firm to further develop its valuation services at greater scale with specialized resources.
While SullivanCotter has long provided business and practice valuation services to not-for-profit and for-profit health care organizations nationwide to help support compliance, transactions, physician alignment, and strategic planning, the addition of this team expands these capabilities to include real estate and specialized tangible asset valuations.
This includes expertise and unique insight into:
- Fair market value real estate appraisal
- Real estate rental rate analyses
- Fair market value equipment appraisal
- Equipment rental rate analyses
- Asset impairment studies
- Facility review and capital planning
- Facility life analyses
- Service line carveouts
- Development and valuation of MSO arrangements
- Litigation support
- Financial reporting and financial feasibility studies
- and more…
“We are now able to deliver a more comprehensive valuation offering under one roof,” said Courtney Dutton, Managing Director and Clinical Workforce Practice Leader, SullivanCotter. “Clients increasingly need integrated valuation support across businesses, practices, real estate, and tangible assets, and this enables us to better meet that demand.”
Supporting Complex Joint Ventures
In addition to not-for-profit health care organizations, the acquired team brings extensive experience serving for-profit health care entities, including private equity-backed organizations and joint ventures between nonprofit and for-profit partners.
“Our team has a deep bench of experience working across non-profit, for-profit, and private equity environments – and brings a complementary perspective to the firm’s existing work,” said Shane Goss, Managing Principal, SullivanCotter. “This expertise in complex joint ventures and investment structures further strengthens our ability to support clients navigating today’s evolving health care marketplace.”
Commitment to Client-Focused Growth
The new team members will join SullivanCotter’s valuation practice and collaborate closely with the firm’s physician and advanced practice provider (APP) compensation, workforce, governance, and strategy experts to deliver integrated, data-driven solutions.
“This acquisition aligns with our strategy of thoughtful, capability-driven growth,” said Ryberg. “Most importantly, it enhances the value we deliver to our clients by expanding what we do and how we can do it.”
For more information, please visit www.sullivancotter.com, email info@sullivancotter.com, or call 888.739.7039.
—
About SullivanCotter
SullivanCotter partners with health care and not-for-profit organizations to improve performance through integrated workforce strategies. Using industry-leading data, expertise, and analytics, SullivanCotter helps organizations align compensation and workforce practices with their mission and goals.