

Turn insight into impact.
Drive meaningful results across your organization with Benchmarks360™.
Our powerful Workforce Compensation and Clinical Productivity Manager can help you elevate your strategy and align performance with system-wide goals.
Combining our trusted physician and APP compensation data with proven consulting insights, Benchmarks360™ delivers a smarter approach to compensation and productivity benchmarking and workforce decision-making.
By identifying retention risks and analyzing productivity, our platform enables health systems to accelerate performance improvements, enhance workforce stability, and adapt confidently to market trends at scale.

Unlock Actionable Insights from Your Compensation Data
Access SullivanCotter’s best-in-class market data
Leverage the industry’s most comprehensive physician and APP compensation database.
Upload and validate your own organization’s data
Securely integrate your internal data with industry benchmarks for complete insights.
Benchmark with confidence— at scale and in real time
Make data-driven decisions with real-time benchmarking across your entire organization.
Turn Data Into Direction with Advanced Applications
Streamline data management, visualize market positioning, and unlock new opportunities with Benchmarks360™’s advanced tools—all in one platform.

Manage Data
View market benchmarks and organizational data side by side.
Compile, blend, and compare datasets to identify performance trends.
Access past submissions or upload incumbent data to inform benchmarking and workforce planning.
Survey Report
Access and filter market data effortlessly.
Leverage SullivanCotter survey data and build custom views for more tailored insights.
At-A-Glance
Enable quick comparisons and smarter strategic planning with greater insights into a clinician’s compensation and performance.
Generate visual reports that highlight key percentiles.
Market Positioning
Benchmark performance with precision.
Calculate Total Cash Compensation (TCC) and wRVU percentiles to evaluate alignment across incumbents, specialties, and groups.
Visualize these results through detailed tables and graphs.
Leverage opportunity assessments to highlight areas of strength and target opportunities for improvement.
Market Modeling and Market Trends
Coming Soon: Market Modeling and Market Trends
Scale reporting with aggregated summaries and advanced insights.
Load custom market benchmarks, track performance trends over time, and benchmark against a broader set of variables to drive more informed, data-driven decisions.
Advanced Applications for Smarter Workforce Decisions

At-A-Glance
Data in. Insights out. Strategy forward.
Gain immediate market insight into a clinician’s compensation and productivity with clear, visual benchmarks.
Generate a streamlined summary by entering individual’s details and selecting relevant market data sources—quickly plotting key percentiles to support quick comparison and strategic decision-making.

Health Check
Proactively Flag Outliers.
The Health Check feature enhances data integrity and transparency to support more reliable insights and decision-making.
Proactively identify errors or quality issues by:
Validating Data Composition: Ensures datasets are complete and structured according to SullivanCotter defined standards and guidelines.
Flagging Variances: Automatically identifies when Total Full-Time Equivalents exceed 1.0 or when compensation values fall below established benchmark norms.

Market Positioning
From Data to Direction: Position with Precision
Evaluate market positioning for individual clinicians and broad specialty groups based on the benchmarks most relevant to your organization.
Aggregate these results by specialty and specialty group to enable deeper analysis and areas for further review.
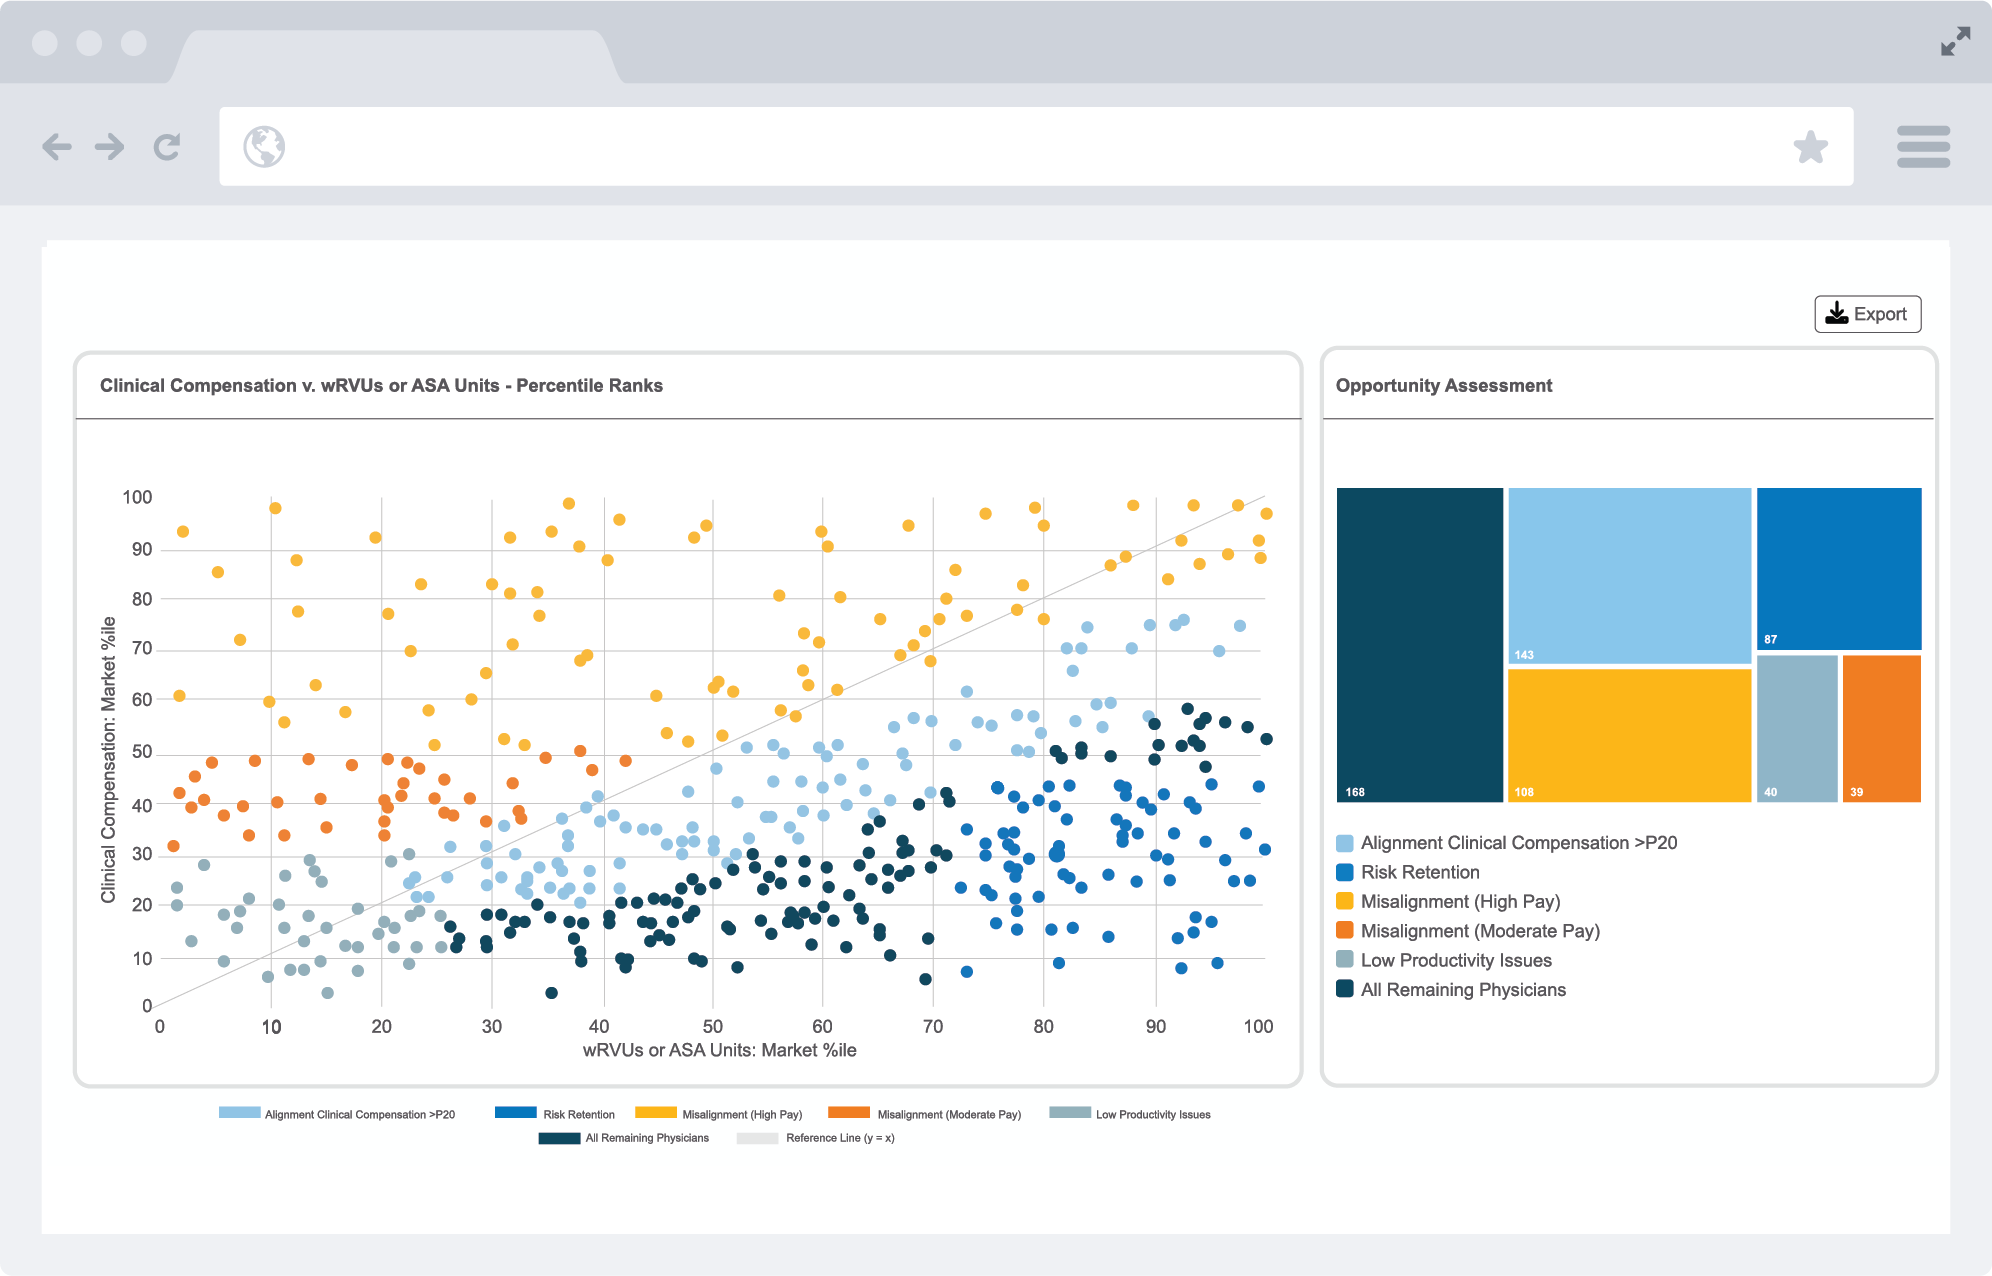
Opportunity Assessment
Reveal Strategic Opportunities and Potential Risks
Review your organization’s incumbent-level data to identify outliers that may warrant further evaluation.
We’ll help you:
Identify potential retention issues based on individual compensation and productivity relative to market benchmarks.
Detect misalignment of pay and productivity in highly compensated individuals.
Schedule a Demo
Experience the power firsthand—book your personalized walkthrough and see how it works for you.
Optimizing workforce performance across health care
Smarter compensation insights. Scalable workforce strategies. Built for the future of health care.
Workforce intelligence powered by SullivanCotter’s unparalleled clinical benchmarking data and consulting expertise.
Explore our comprehensive flagship survey data