INFOGRAPHIC | 2023 Physician and APP Compensation Trends
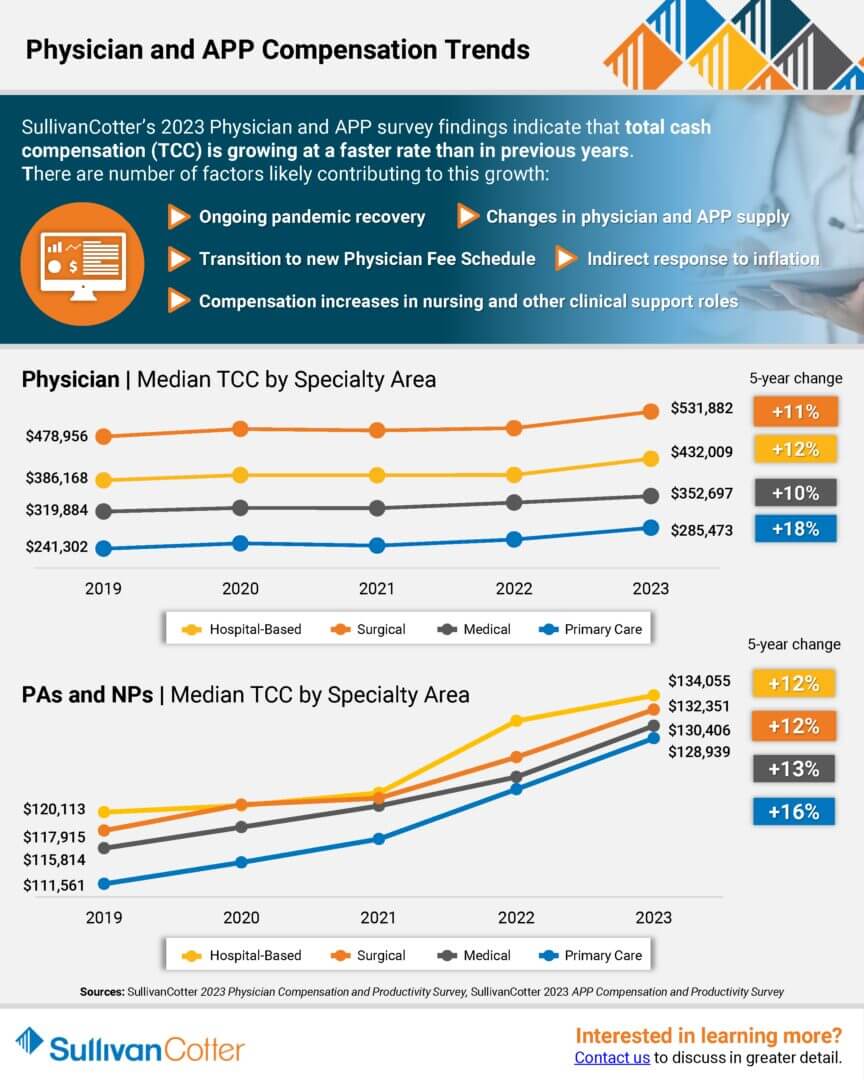
Median total cash compensation for physicians and APPs continues to grow across all major specialty areas
SullivanCotter’s recent survey findings indicate that total cash compensation for physicians and advanced practice providers is growing at a faster rate than in previous years.
There are a number of factors likely contributing to this growth:
- Ongoing pandemic recovery
- Changes in physician and APP supply
- Transition to the new Physician Fee Schedule
- Indirect response to inflation
- Compensation increases in nursing and other clinical support roles
Learn more about median TCC by specialty area and track the growth in annual compensation for Primary Care, Medical, Surgical and Hospital-Based specialties over the past five years. Findings are from SullivanCotter’s 2023 Physician Compensation and Productivity Survey and SullivanCotter’s 2023 APP Compensation and Productivity Survey.
INFOGRAPHIC | 2023 Total Rewards Pulse Survey
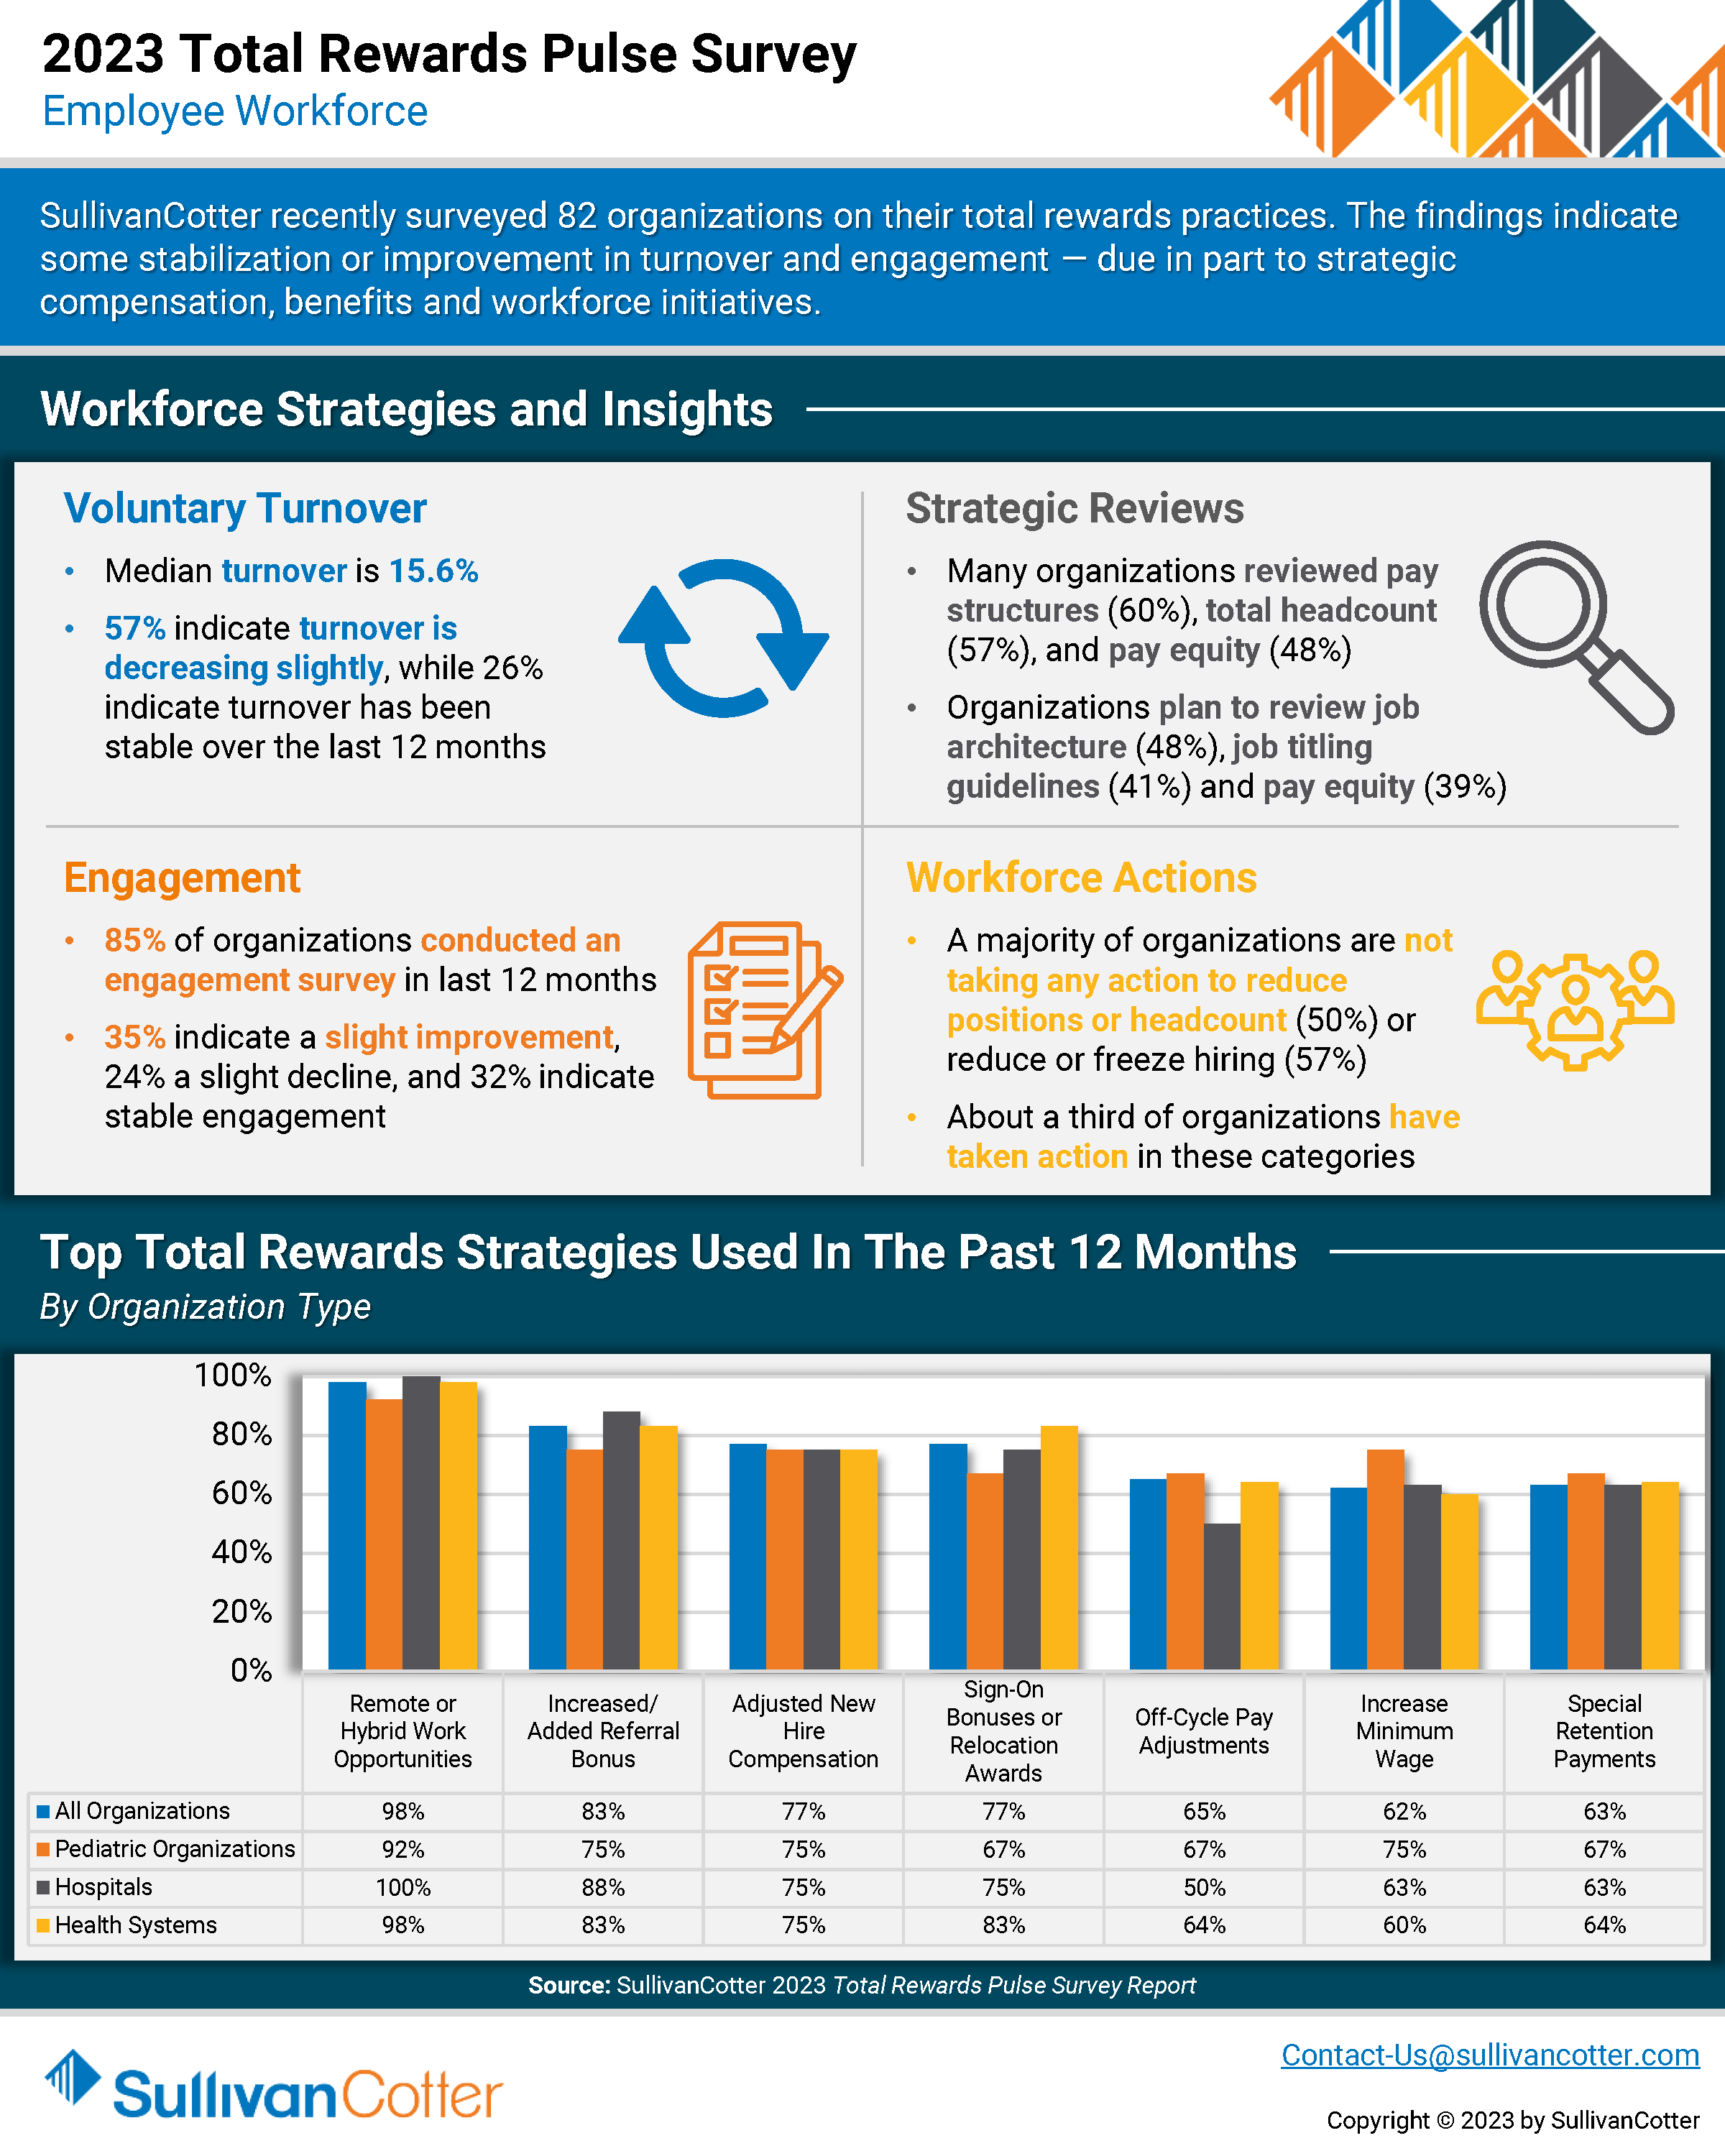
Total rewards strategies continue to evolve in response to ongoing health care workforce crisis
SullivanCotter recently surveyed 82 healthcare organizations on their total rewards practices. The findings indicate some stabilization or improvement in turnover and engagement — due in part to strategic compensation, benefits and workforce initiatives.
In light of recent healthcare workforce challenges, many organizations are reassessing various workforce strategies in order to stay competitive in a tight marketplace for talent. This includes reviewing employee pay structures, pay equity, job architecture, headcount and more.
Learn more about the top total rewards strategies that organizations have utilized within the past 12 months, different actions organizations are taking to address turnover, and other additions and enhancements being introduced.
INFOGRAPHIC | APP Workforce Insights – Inpatient Cardiology
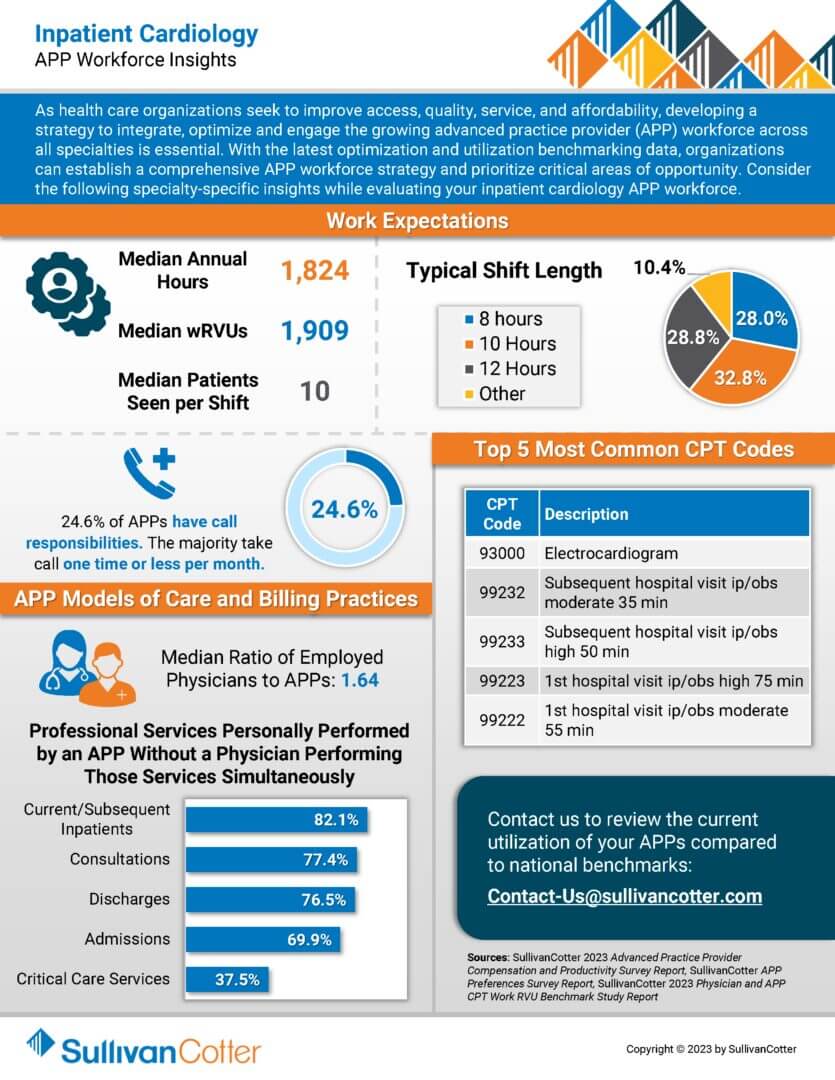
Learn more about specialty-specific work expectations, models of care, billing practices and more.
As health care organizations seek to improve access, quality, service, and affordability, developing a strategy to integrate, optimize and engage the growing advanced practice provider (APP) workforce across all specialties is essential. With the latest optimization and utilization benchmarking data, organizations can establish a comprehensive APP workforce strategy and prioritize critical areas of opportunity. Consider the following specialty-specific insights while evaluating your inpatient cardiology APP workforce.
INFOGRAPHIC | APP Workforce Insights – Outpatient Cardiology
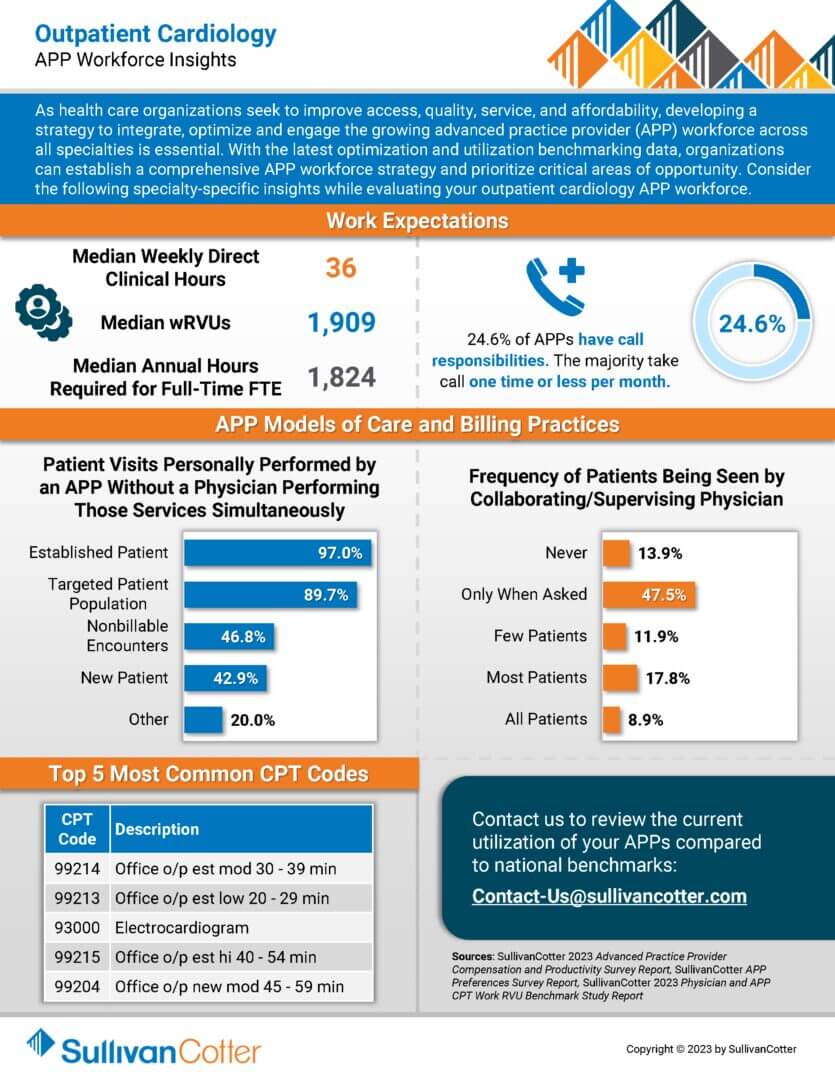
Learn more about specialty-specific work expectations, models of care, billing practices and more.
As health care organizations seek to improve access, quality, service, and affordability, developing a strategy to integrate, optimize and engage the growing advanced practice provider (APP) workforce across all specialties is essential. With the latest optimization and utilization benchmarking data, organizations can establish a comprehensive APP workforce strategy and prioritize critical areas of opportunity. Consider the following specialty-specific insights while evaluating your outpatient cardiology APP workforce.
PRESS RELEASE | Median Hourly Rates Up by Over 5% for Health Care Employees
Survey report indicates upward pressure on compensation for hourly employees due to health care workforce crisis
—
December 7, 2023 – CHICAGO – SullivanCotter, the nation’s leading independent consulting firm in the assessment and development of total rewards programs, workforce solutions, and data products for health care and not-for-profits, has released the findings from its 2023 Health Care Staff Compensation Survey Report.
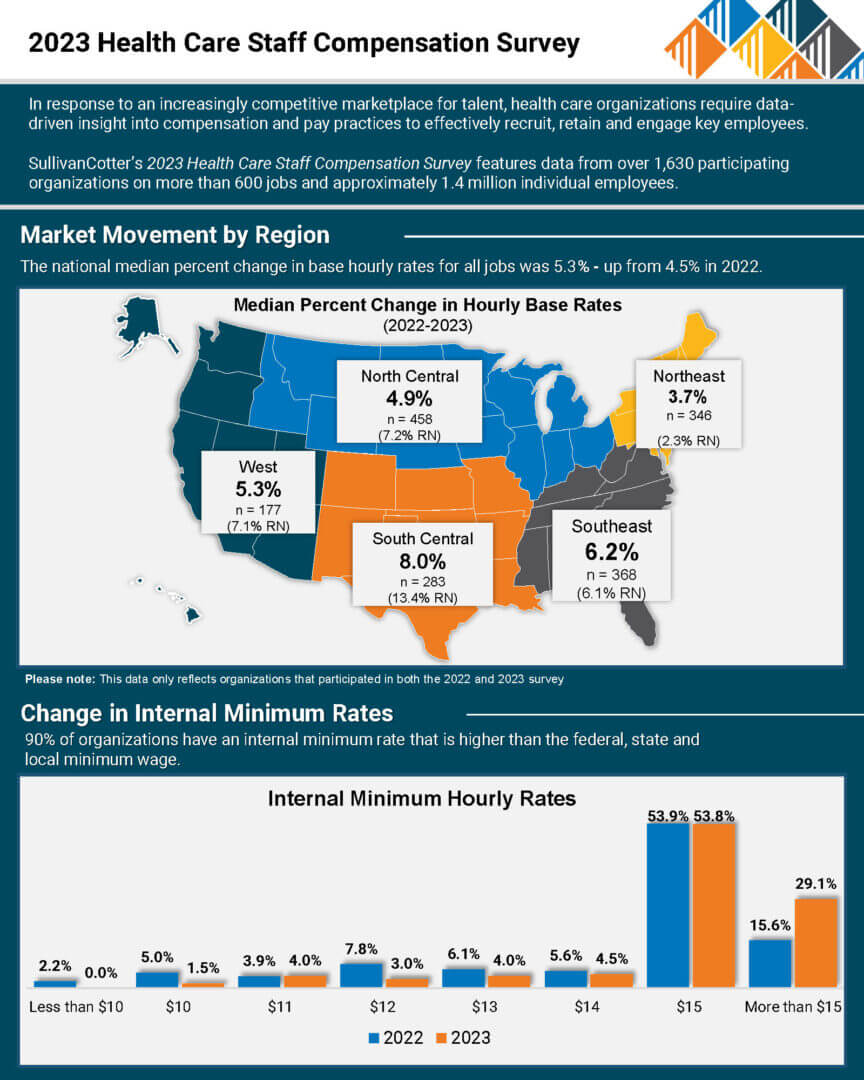
Despite annual salary budget increases returning to pre-pandemic levels of 3.0% to 3.5%, the report finds that actual median base hourly pay across all jobs nationally increased by 5.3% in 2023 – continuing the growth trend experienced in the prior two years. The most significant gains are in the South Central and Southeast regions, which go beyond the national median at 8.0% and 6.2%, respectively. When looking specifically at registered nurses (RNs), most regions are also seeing increases in base hourly rates well above the national median increase rate for all jobs of 5.3%, with RN pay growth in the South Central region reaching double-digits at 13.4%.
With findings reported from over 1,630 organizations representing more than 600 positions and approximately 1.4 million individuals, SullivanCotter’s dataset represents the largest and most comprehensive health care staff compensation resource for hospitals and health systems.
Health care organizations nationwide continue to grapple with a number of external market forces that are shaping how they operate. Labor shortages amidst growing staff and provider burnout remain an issue and are creating upward pressure on compensation to help organizations attract and retain staff and hourly employees in a tight market for talent.
Significant Increases in Median Base Pay
Many new roles demonstrated high percentage increases on both the clinical and non-clinical sides. On average, pay for some clinical jobs increased more than 11% from last year. While Certified Medical Assistant (9.3%) remains from last year’s list, RN Surgical Services (13.0%), Surgical Technologist First Assistant (10.1%), RN Ambulatory/Outpatient Care (9.5%), and EKG Technician (9.1%) are all new entrants seeing significant market movement compared to last year when they ranged from 3.0% to 8.0%.
Historical pay change levels have not been as high for non-clinical jobs as compared to clinical jobs. The exception is the recruiting and retention function, which remains an important priority for many organizations. This year, the median base pay for the Talent Acquisition Specialist role increased by 14.0% – landing itself just under Wellness Program Coordinator (17.9%) on the high-growth list.
Premium Pay Practices
Most organizations recognize the need to pay premiums to compensate for less desirable shifts and ensure full staffing. More than 80% of organizations offer premium pay programs. Of those, roughly 80% pay premiums as flat dollar amounts, while most others utilize percentages of hourly rates. Premium pay eligibility is more widespread for the clinical job group and more frequently paid due to the nature of staffing those jobs. Bedside RNs and Clinical Pharmacists have some of the highest rates.
Change in Internal Minimum Pay Rates
90% of organizations have an internal minimum pay rate that is higher than the federal, state, and local minimum wage. In 2022, there was a significant rise in organizations choosing to increase their internal minimum rate above the federal, state, or local minimum – from 64% in 2021 to 82% in 2022. The trend continued in this year’s survey, with a staggering 90.4% of respondents setting internal minimum rates above federal, state, or local minimums. “The establishment of internal minimum rates at a higher level has become a necessity for many organizations as they compete for employees within an increasingly competitive marketplace. Additional market pressures such as specific health care wage requirements, pay equity initiatives, collective bargaining pressures and pay transparency requirements are also driving wages up,” said Cathy Loose, Employee Workforce Practice Leader, SullivanCotter.
Considerations for 2024 and Beyond
External health care market forces continue to change how organizations are responding both strategically and operationally to recent workforce challenges. As organizations look cautiously towards greater financial stability and expect a return to pay growth more akin to pre-pandemic levels, it is important to take the following planning considerations into account:
- Market-driven base salary increases will focus more acutely on high-performing executives, critical clinical roles and the resolution of internal equity.
- Performance-based incentive compensation is expected to moderate.
- In a tight market for talent, leaders should ensure both pay levels and compensation delivery methods are aligned with the organization’s talent strategy.
- The aging baby boomer population will have a profound effect on the supply of executive and provider talent.
- Difficult choices and changes in the workforce will support an organization’s financial sustainability.
About SullivanCotter
SullivanCotter partners with health care and other not-for-profit organizations to understand what drives performance and improves outcomes through the development and implementation of integrated workforce strategies. Using our time-tested methodologies and industry-leading research and information, we provide data-driven insights, expertise, and data products to help organizations align business strategy and performance objectives – enabling our clients to deliver on their mission, vision, and values.
For more information on SullivanCotter’s surveys, please visit our website at www.sullivancotter.com, or contact us via email or by phone at 888.739.7039.
Note to media: Additional data and interviews are available on request.
INFOGRAPHIC | 2023 Health Care Staff Compensation Survey
Median base hourly rates for healthcare staff increased by more than 5% nationally
In response to an increasingly competitive marketplace for talent, healthcare organizations require data-driven insight into compensation and pay practices to effectively recruit, retain and engage key employees.
SullivanCotter’s 2023 Health Care Staff Compensation Survey features data from over 1,630 participating organizations on more than 600 jobs and approximately 1.4 million individual employees.
ARTICLE | Assessing Pay Equity
Build and Sustain Value-Based Workplaces
Originally published by the American Association of Provider Compensation Professionals
READ FULL ARTICLE
Fairness is a universal value that we acquire early in life. Children are quick to point out the injustices they encounter in their lives with the oft-repeated expression, “That’s not fair!” Over time, our concept of fairness expands to the concept of equity, which translates individual experiences to those at the group identity level (such as men versus women).
As adults, we have perceptions of what is equitable and what is not, including when it comes to compensation. When compensation is not perceived to be equitable, an emotional reaction may be elicited in response. Sometimes, this response is useful and other times, it can
be destructive.
How, then, do we effectively monitor, measure, and achieve pay equity in our healthcare organizations to encourage calm waters?
In this article, SullivanCotter provides insight into:
- Important factors impacting pay equity such hiring and selection regime, supporting staff resources, training and career opportunities, quality of leadership and mentoring, and more
- The driving forces behind pay equity studies
- A defined process for completing a pay equity study to ensure it yields optimal benefits
- Practical application of pay equity study results including both preventative measures and remediation actions
Instituting Layoffs Amidst a Labor Shortage
Strategic Workforce Optimization
Lower Costs, Avoid Layoffs, Build Resilience
Despite continued labor shortages in vital patient-facing roles and the post-COVID “great resignation,” many health care organizations have had to consider layoffs in the past year. Human resources professionals are experiencing numerous operational pressures, often including an increased push to reduce labor costs. As these teams grapple with balancing increased burnout, turnover, and staffing shortages with a need to cut costs, they seek alternative strategies to address these challenges.
Health care organizations need help resetting their financials based on the post-COVID labor shortages and increased costs. While layoffs are often an option, they are not always the best and fastest way to find savings. Implementing cost-cutting measures requires a comprehensive workforce optimization approach that includes employee, leader, manager, and legal considerations and careful analyses to understand where labor costs, benefit offerings and positions can be streamlined. If layoffs are imminent, consider the above recommendations and consult your legal counsel and leaders. By doing so, HR professionals can navigate the process with empathy, transparency, and compliance, minimizing negative impacts and maintaining organizational stability during challenging times.
In this article, SullivanCotter outlines:
- Unprecedented Financial Pressures
- Pressures on Labor Costs
- Layoff Trends in Health Care
- Cost Cutting Alternatives
- Instituting Layoffs
PRESS RELEASE | 2023 Advanced Practice Provider Compensation and Productivity Survey
SullivanCotter Reports Median Total Cash Compensation for APPs Rose 16% Over Last Five Years, Growing Faster than Physician and Nursing Pay
—
November 15, 2023 – CHICAGO – SullivanCotter, the nation’s leading independent consulting firm in the assessment and development of total rewards programs, workforce solutions, and data products for health care and nonprofits, has released its 2023 Advanced Practice Provider Compensation and Productivity Survey report.
The 2023 report revealed that APP compensation has continued to grow across all specialties. While 2022 saw higher-than-normal growth in primary care and hospital-based specialties, the 2023 results show larger increases for primary care, medical and surgical specialties (each at 5%) and modest growth for hospital-based specialties (2.5%) for both base and total cash compensation (TCC).
Although this year’s increases are more in line with historical APP compensation increases, the 3-year trends reflect a continuing market demand for these clinicians. Median TCC for nurse practitioners and physician assistants rose 13.0% for primary care, 10.2% for medical, 9.4% for surgical, and 10.9% for hospital-based specialties from 2020-2023.
Consistent with the past several years, the demand for anesthesiology providers remains high, which continues to put upward pressure on compensation. Certified Registered Nurse Anesthetists (CRNAs) saw a 9.6% increase in median TCC in 2023. In looking at the 3-year trends for CRNAs, median TCC rose 15.6% from 2020-2023, and median hourly rates increased from $89.62 in 2020 to $102.91 in 2023.
“The anesthesiology care team continues to see unprecedented changes as the shortage of physicians and CRNAs grows, yet the need for their services continues to increase at an unprecedented pace. As competition for CRNA talent increases, we are seeing organizations adjust CRNA compensation packages such as including sign-on and retention bonuses, student loan repayments, and adjustments to work effort expectations, roles and responsibilities. They are also looking at increasing salaries to stay competitive,” said Zachary Hartsell, APP Practice Leader, SullivanCotter.
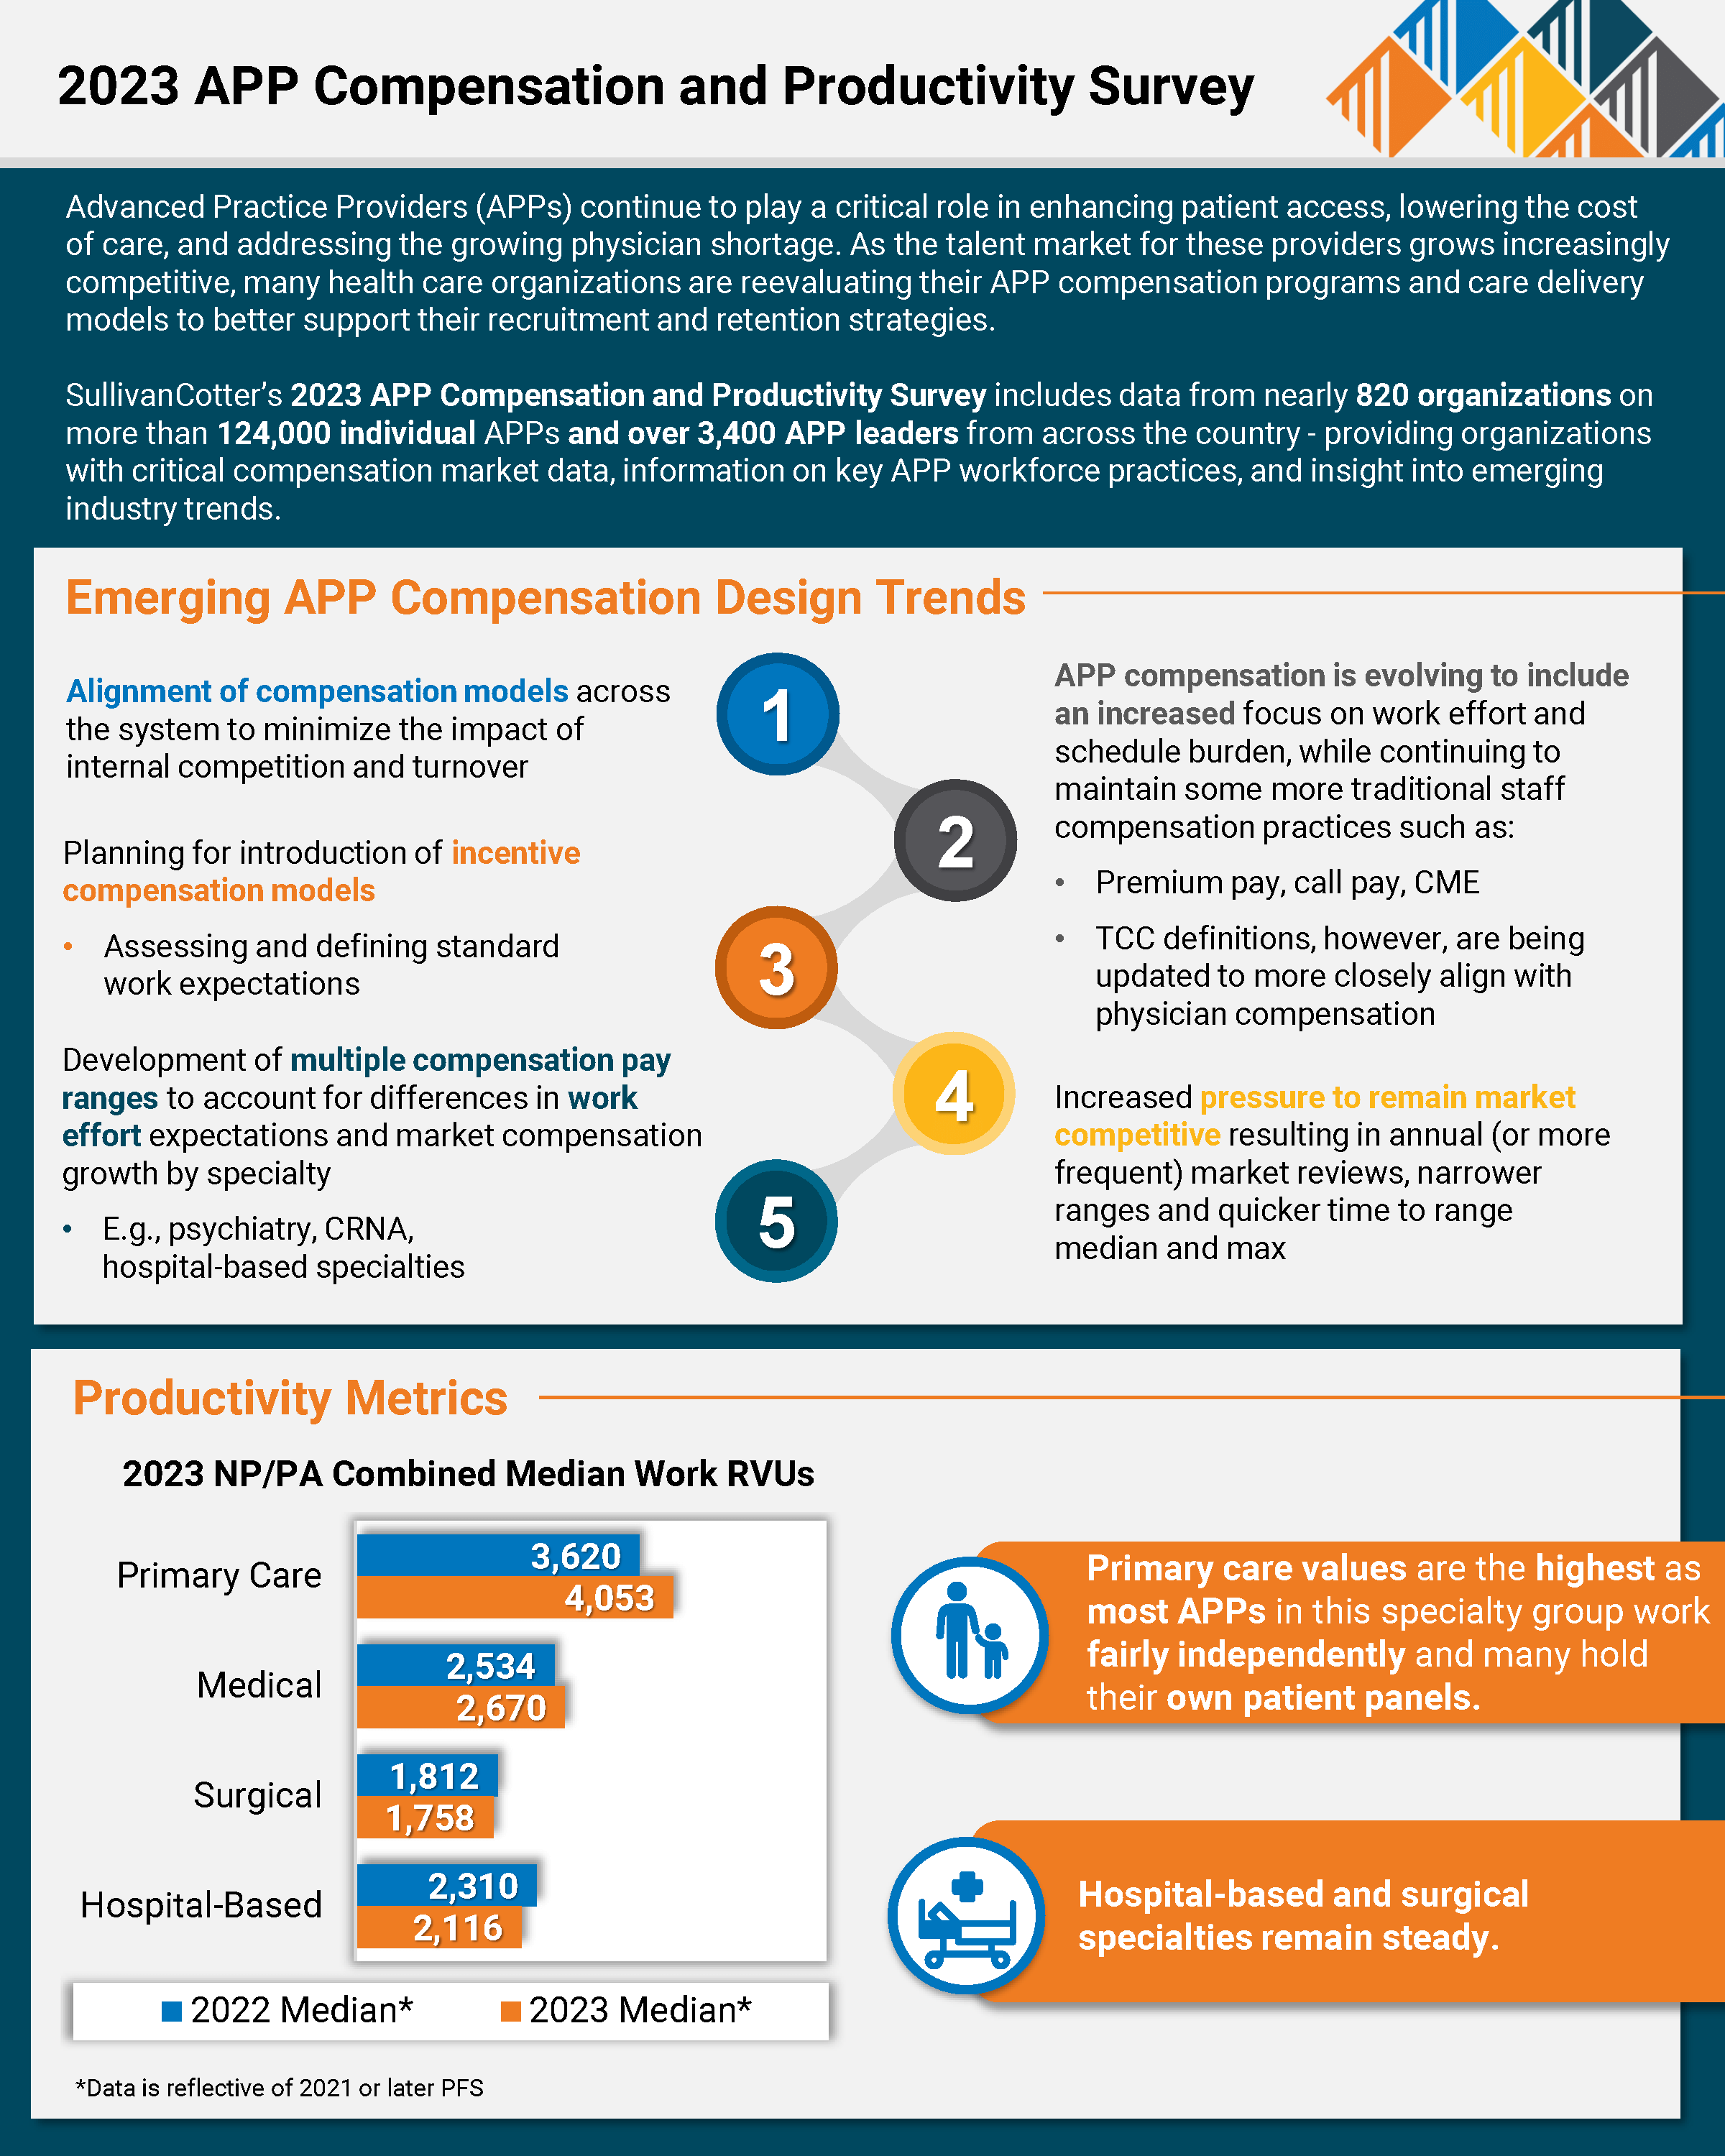
In addition to steady pay increases, the 2023 survey indicated that APP compensation is evolving, often including the introduction and refinement of incentive compensation models, particularly in primary care. The 2023 survey reported that 48.1% of organizations utilize incentive pay for at least some of their APPs, with 75.9% of these organizations structuring incentives as add-on dollars. APP compensation models are also becoming more consistent within systems, which will help minimize internal turnover for these clinicians.
APP compensation programs continue to evolve to include an increased focus on work effort, schedule burden, and premium pay to minimize burnout while meeting coverage needs. Similarly, organizations are taking a closer look at how APPs practice within a team-based care model. “While state practice acts can drive APP scope of practice, hospital bylaws often impose additional restrictions. Ideally, pay practices are structured to support optimal use of all members of the care team,” said Hartsell.
There is increased pressure to remain market competitive with pay, resulting in annual (or more frequent) market reviews, narrower ranges and quicker time-to-range median and max.
“In addition to compensation, organizations should evaluate care delivery models and how APPs are utilized as this can be a significant driver of turnover, regardless of compensation level. Adding APP leadership roles can help organizations ensure APPs have the appropriate scope of practice and improve APP recruitment and retention,” said Hartsell.
SullivanCotter’s 2023 Advanced Practice Provider Compensation and Productivity Survey provides critical benchmarking data on compensation levels and pay practices. As one of the most comprehensive resources of its kind for hospitals and health systems nationwide, the survey includes information from 816 organizations representing more than 124,000 individual APPs and over 3,400 APP leaders.
About SullivanCotter
SullivanCotter partners with health care and other not-for-profit organizations to understand what drives performance and improves outcomes through the development and implementation of integrated workforce strategies. Using our time-tested methodologies and industry-leading research and information, we provide data-driven insights, expertise, and data products to help organizations align business strategy and performance objectives – enabling our clients to deliver on their mission, vision, and values.
For more information on SullivanCotter’s surveys, please visit our website at www.sullivancotter.com, or contact us via email or by phone at 888.739.7039.
Note to media: Additional data and interviews are available on request.
INFOGRAPHIC | 2023 APP Compensation and Productivity Survey
Advanced Practice Providers (APPs) continue to play a critical role in enhancing patient access and lowering the cost of care. Many healthcare organizations are reevaluating their APP compensation programs and care delivery models to combat the ongoing physician shortage and the increasingly competitive talent market.
Featuring data from SullivanCotter’s 2023 Advanced Practice Provider Compensation and Productivity Survey Report, this infographic features emerging APP compensation design trends as well as insight into important compensation and pay practices data.
ARTICLE | Studying the Effects of Pay Transparency
Many states have enacted pay transparency laws that are intended to enhance the visibility of compensation practices to job candidates and current employees. One of the purposes, if not the primary one, is to create pay equity between disadvantaged groups and others by making information about pay programs widely accessible. Indeed, where transparency is earnestly practiced, the differences in salaries between groups decline.
Not all organizations, however, are proponents of pay transparency. These organizations argue that while these laws are directed toward a particular policy outcome of pay equality, the mechanisms by which this is achieved are unclear and that there may be unintended consequences. Foremost on the metaphorical minds of organizations are concerns about corporate profitability and the potentially disruptive effects that open dialog about money may have on employee pay and performance. Therefore, for organizations that wish to effectuate changes that truly promote fair pay practices, there are several questions they should ask and answer as they introduce their versions of pay transparency.
SullivanCotter suggests empirically examining the following questions using carefully crafted experimental designs and concomitant controls.
1. HAS PAY TRANSPARENCY REDUCED THE DIFFERENCES IN PAY BETWEEN GROUPS AND IF SO, HOW?
This is a pre-post comparison of group differences with the caveat that differences can be closed either by reducing the compensation of the higher-paid or elevating the compensation of the lower-paid. The data suggests (all allusions to “data” or research” in this paper are attributable to the articles in the reference section) that salary parity tends to be produced by lower starting salaries for males (in most studies) and allocating smaller pay increases over time. However, these results are influenced by how pay transparency information is provided and the messaging of those communications.
2. ARE THE EFFECTS OF PAY TRANSPARENCY UNIFORM ACROSS THE ORGANIZATION?
Currently, there is little information available on how pay transparency may differentially affect higher versus lower-paid positions or positions in different functional areas. Nevertheless, organizations will want to examine if greater changes are more probable for certain positions, functions, or levels in the organization. Certain areas of the organizations may have greater competitive pressures to find and retain talent or be less constrained by narrow and rigid salary structures, allowing for greater discretion and greater potential for pay inequities.
3. DOES HOW PAY TRANSPARENCY DATA IS PORTRAYED AFFECT WHO IS ATTRACTED TO THE ORGANIZATION?
Research shows that pay transparency information can differentially appeal to certain audiences, attracting more or less men and women. Similar to the evidence on job postings, pay transparency information can portray environments that are more or less competitive or cooperative, which, in turn, influences the attractiveness of organizations to would-be candidates.
4. DOES PAY TRANSPARENCY AFFECT EMPLOYEE PRODUCTIVITY AND PERFORMANCE?
Unfortunately, the impact on productivity and performance is unclear. There is some indication that the connection between pay and performance is reduced. With the allocative movement toward equality (versus equity), other compensatory factors such as market values, time in position, and functional area increasingly explain differences in pay. If an organization has a reliable and valid performance program and a statistically adequate history of ratings (or other metrics), the relationships between pay and performance can be contrasted pre- and post-introduction of salary information.
5. DOES PAY TRANSPARENCY AFFECT CORPORATE PROFITABILITY?
This assessment depends on the combined influences of employee productivity and compensation expense. If, for example, egalitarian pay practices undermine principles of merit and effort, then an organization may experience reductions in productivity and operating margin. If pay transparency affects total compensation costs, then labor-intensive industries such as health care may see an increase or decrease in EBITDA, depending on the direction of the per capita expense. Thus, fully embracing the aims of pay transparency may entail the simultaneous management of performance-based expectations, hiring practices, and employer costs.
6. HOW DOES PAY TRANSPARENCY AFFECT THE ORGANIZATIONAL CULTURE?
The kinds of practices organizations ultimately adopt should be consistent with their overall cultural preferences. For example, organizations that openly share their financial information with staff will most likely find that sharing compensation guidelines and practices with employees is a philosophically digestible step. An organization’s position on pay transparency is a highly visible communicative device that says quite a lot about the corporate culture. What organizations have to say about pay transparency says a lot about its cultural orientation toward information sharing and an ethic of openness.
There is a truism that when it comes to research, no question is simple. One action can affect, and be affected by, myriad variables in unexpected ways. It takes an inquisitive and self-reflective organization to want to cut through the noise and discover what the data says about the effects of the new transparency laws on their organization’s functioning. If the goals are to improve the organization’s culture and financial standing and the well-being of staff by instituting fair compensation practices, then knowing how current transparency laws influence organizational outcomes would be a prudent course of action.
References
Baer, J.B., Pinkley, R., Barsness, Z., Mazel, J., Bhatia, N., & Sleesman, D.J. (2023). Gender, pay transparency and competitiveness: Why salary information sometimes, but
not always, mitigates gender gaps in salary negotiations. Group Decision and Negotiation, 32, 1143-1163.
Bennedsen, M., Simintzi, E., Tsoutsoura, M., & Wolfenzon, D. (2022). Do firms respond to gender pay gap transparency? The Journal of Finance, , 4, 2051-2091.
Oblog, T. & Zenger, T. (2022). The influence of pay transparency on (gender) inequity, inequality and the performance basis of pay. Nature: Human Behavior, 6, 646-655
Download PDF >WEBINAR | 2023 Clinical Workforce Trends
View SullivanCotter’s on-demand webinar, revealing the latest health care industry trends, informed by our recent employee workforce surveys. During this webinar, we explored today’s labor challenges impacting the clinical workforce and how organizations are adapting clinical care models to ensure continuity of care. We discussed the latest trends in compensation for nurses and APPs, including base pay, salary increases, compensation design and more.
This webinar covers:
- Relevant market trends and insights on how organizations address labor shortages and retention issues through strategic compensation practices
- Organizational responses to increased nursing union participation and union/non-union compensation
- Typical nursing reporting structures and spans of control
- Trends in nursing compensation, including geographic differentials, compensation design, and salary increase planning
- Trends in APP compensation, including emerging compensation designs
Fill out the form below to access the full webinar.
INFOGRAPHIC | A Data-Driven Approach to Clinical Workforce Planning
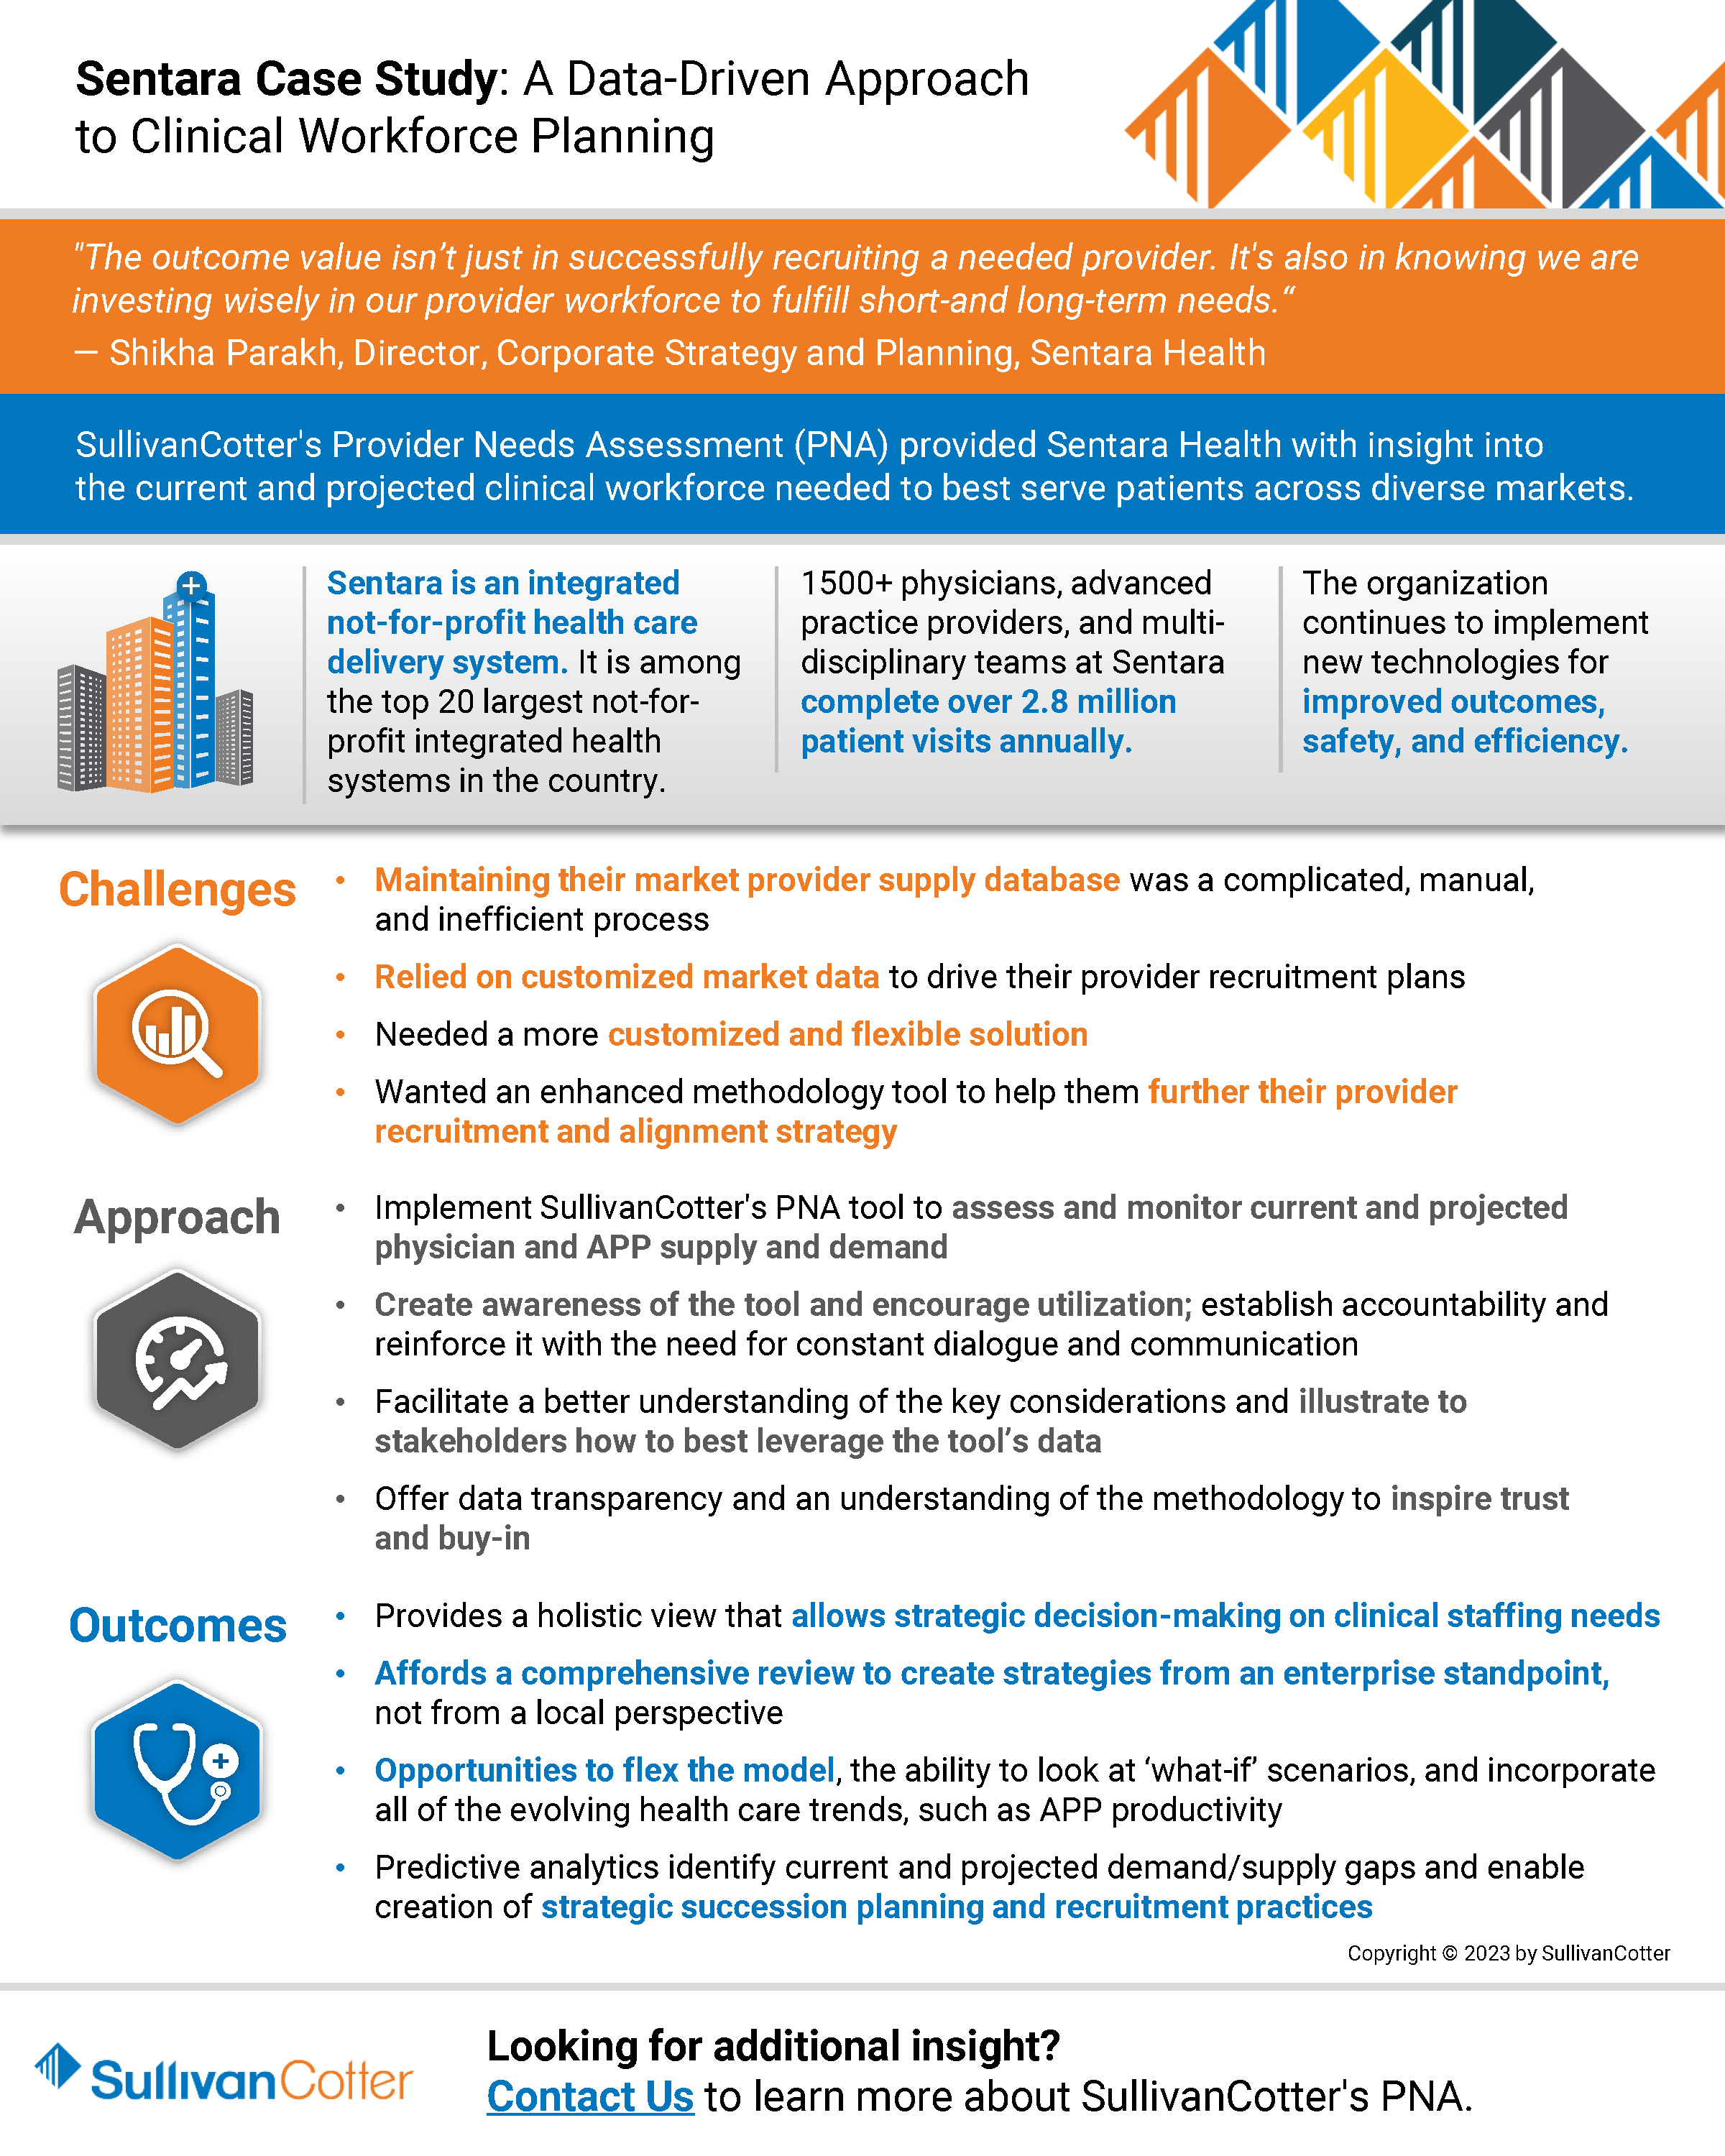
SullivanCotter’s Provider Needs Assessment (PNA) provided Sentara Health with insight into
the current and projected clinical workforce needed to best serve patients across diverse markets.
Sentara Health: A Data-Driven Approach to Clinical Workforce Planning
Sentara Health is a prominent health system in the U.S. Mid-Atlantic and Southeast regions. It ranks among the country’s top 20 largest not-for-profit integrated health systems. With a workforce of 30,000 dedicated employees, Sentara encompasses 12 hospitals in Virginia and northeastern North Carolina. In addition, the Sentara Health Plans division effectively manages the healthcare needs of over 1.2 million members in Virginia and Florida. Nationally recognized for its commitment to clinical quality and safety, Sentara remains steadfastly focused on innovation and delivering an exceptional healthcare experience to its patients and members. The Sentara Medical Group (SMG), comprising more than 1,500 physicians, advanced practice providers, and multi-disciplinary teams, completes over 2.8 million patient visits annually. The organization has a strong commitment to innovation and continues to implement new technologies for improved outcomes, safety, and efficiency.
The Challenge
Though a forward-thinking organization in the healthcare industry, Sentara faced significant challenges in clinical workforce staffing, recruiting, and planning across urban and rural settings. As a growing health system with the need for an efficient, flexible solution, Sentara sought a partner to provide an enhanced methodology to further develop and complete its provider recruitment strategy and provider needs assessment.
While delivering quality care to a large and diverse population is one of Sentara’s key missions, tracking a fluctuating number of care providers had become challenging. Maintaining a roster of the organization’s physicians required frequent and manual updates. Amid an ongoing health care workforce crisis, Sentara recognized the need for an innovative workforce strategy to balance the operational post-COVID realities, align with organizational and cultural needs, and meet their transformation goals.
A key priority for the solution was a self-service and comprehensive workforce planning platform that would provide their team easy access to real-time data.
The Approach
After a comprehensive search, Sentara chose SullivanCotter’s Provider Needs Assessment (PNA) tool. PNA is an interactive cloud-based application that delivers accurate and actionable data-driven insights to help organizations identify, monitor and respond to changing service needs and provider staffing requirements.
“We began the RFP process in search of a predictive model that could adjust to population-specific criteria, be calibrated based on area-specific consideration, and incorporate all of the evolving health care trends, such as APP productivity,” noted Shikha Parakh, Director, Corporate Strategy and Planning at Sentara Health. “SullivanCotter’s PNA tool stood out because of the opportunities to flex the model, the ability to look at ‘what-if’ scenarios, and also have the provision of a best-in-class solution. They were the clear winner,” added Parakh.
Strategy Implementation
Sentara utilized fundamental change management principles at the beginning of the PNA implementation process, including creating awareness, establishing accountability, and reinforcing the need for constant dialogue and communication. As part of the related communications toolkit, Sentara provided over 80+ leaders access to data including regional provider needs assessments, service area reports, and specific reports by service line.
Collaborating with SullivanCotter, Sentara created an FAQ document to ensure team members weren’t reviewing reports in a bubble. “We wanted to facilitate a better understanding of the key considerations and illustrate to stakeholders how to leverage the tool’s data best,” said Parakh. “Providing data transparency and an understanding of the methodology inspired a greater amount of trust and buy-in,” Parakh noted.
SullivanCotter’s PNA allowed for robust analysis and straightforward reporting – creating custom reports with only a few clicks. Sentara established a community needs assessment council, including members from the legal and strategy teams, to review and approve all provider recruitment plans.
The Results
PNA gave Sentara the ability to measure demand for specific services in their markets, helping them estimate the number of providers needed in those areas. This information proved invaluable for recruitment, enabling them to develop service line strategies, identify growth opportunities, and determine surplus/deficit areas to plan for the next budget year.
Sentara quickly benefitted from using SullivanCotter’s PNA, particularly noting the ease of downloading data, the visual appeal of the maps, the ability to clearly identify surplus/deficit, and the predictive modeling capability as far as five years out. PNA also provided Sentara with a more strategic view of local market needs by factoring in provider supply in the adjacent geographic areas. Often, collaborating with adjacent market service providers allowed them to fulfill the market need without adding more FTEs. In addition, the predictive modeling allowed Sentara to analyze demographic information to help assess potential retirements and know where succession planning was needed.
Sentara quickly realized numerous benefits, including:
- Financial and operational efficiencies
- Improved decision-making and strategic recruitment
- Effective succession planning
- Increased synchronization between provider teams, strategy teams, and local market operators
“A key aspect of the tool is that the data can be modified, and we can apply qualitative insight to the mathematical model. We aren’t limited to just using the tool to flesh out the information. The provider roster can be updated to keep up with what is happening in each local market, and all of the insights that come with that,” stated Parakh.
PNA’s ability to create robust, custom reports with only a few clicks, makes the analysis and reporting process significantly easier. The ability to measure the demand for services in their markets supports Sentara in efficiently meeting the needs of their communities, resulting in improved patient access. “Using the tool to create strategies, specifically in our rural markets where geographic location is a barrier to care, has resulted in a new service pattern,” shared Parakh.
Post-launch Challenges and Resolution
Despite the overall success of PNA’s launch, Sentara did face a few challenges. As expected, internal adoption and use of a new tool can often be difficult. Sentara realized that additional education was required for the organization to leverage its insights, understand the methodology, and ensure data transparency. To tackle these challenges, Sentara provided ongoing education workshops on compliance regulations and collaborated closely with SullivanCotter for guidance and support.
Key Takeaways for Businesses
The successful launch of SullivanCotter’s PNA tool at Sentara Health offers valuable insights for health care organizations considering a new product launch:
- Employ Change Management Principles: Engage stakeholders through awareness, accountability, and constant communication while introducing the new product.
- Collaboration is Key: Partner with the product creator to allow for greater understanding and ensure use of the product to its full potential.
- Focus on Data-driven Insights: Combine quantitative and qualitative data to drive better decision-making and strategy development.
- Ongoing Education and Support: Ensure all stakeholders can access resources and support throughout the adoption and post-launch stages.
“PNA affords us an overall holistic review, which is critical due to the unique nature of our markets. This enables us to create strategies from both an enterprise standpoint, and a local perspective. Working together through the team site ensures collaboration between the provider team, strategy team, and local market operators to meet market needs effectively and strategically,” noted Parakh.
Sentara Health’s experience highlights the importance of a flexible, data-driven, and innovative approach to successfully completing a robust provider needs assessment and clinical workforce planning process. By leveraging SullivanCotter’s PNA tool, Sentara tackled the challenges of workforce staffing, recruiting, and planning. This enabled them to efficiently adapt their healthcare services to meet the needs of an ever-changing landscape.
“Implementing the SullivanCotter PNA has provided Sentara with the tools and data to understand the supply and demand in our market. The outcome value isn’t just in successfully recruiting a needed provider. It’s also in knowing we are investing wisely in our provider workforce to fulfill short-and long-term needs. This is the first time we’ve had that kind of insight – it is very exciting and has convinced us that this is the future,” remarked Parakh.
Pay Equity: More than an Annual Analysis
There are several statistical methods used to examine pay equity between select groups. However, all attempt to achieve the same ends of controlling for differences between groups when analyzing the compensation between those groups. Thus, if the groups are equivalent in all relevant respects, would they (e.g., men and women) be paid the same?
However, even when a pay equity analysis comes back citing no statistical differences between groups, organizations still must pause to consider if these results reflect a true state of affairs or if inequities are buried deeper within their organizations that an analysis of compensation alone does not reveal. Other fundamental questions need to be asked and answered before the results of a pay equity analysis can be fully embraced as true. We discuss 5 of these questions below, using gender as our example group.
Do men and women separate from the organization at different rates?
If lower-paid women, or those who receive lower counter-offers than men when pursued by competing organizations, exit organizations at a higher rate, then the remaining organizational sample is biased. The sample for the pay equity analysis includes only higher-paid women who have stayed with the organization. Those who have felt unfairly treated have left.
Solution: Test for group differences in organizational exits, examining if compensation is a factor in separations.
Do men and women perform at the same levels?
Equity suggests that those who contribute more should be paid more and vice versa. Thus, for example, a woman who performs at a lower level (e.g., is less productive) should be paid less than a man who performs at a higher level and is paid more. The results of a pay equity study will conclude that is okay. However, if women's performances are lower than men's, we must ask, "Why?" Perhaps performance ratings are biased against women or their true performances are negatively affected by actions that impair performance. For example, women may be provided with fewer resources, developmental opportunities, or mentors.
Solution: Assess performance differences between groups and, where they exist, the reasons for those differences.
Do women get financially penalized for part-time work?
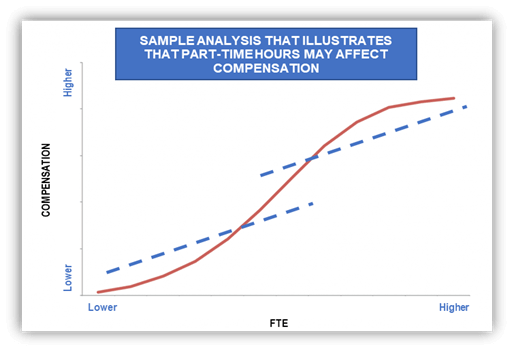
Many more women than men work part-time (or do not work at all) because they remain the family’s primary caretaker for home and children. These facts are reflected in a recent report from the Center for American Progress (The State of Women in the Labor Market in 2023) that shows employment rates of women are 40% lower than that of men when children under the age of 5 are at home. This gap narrows to 5% when no minors are at home. Additionally, the report indicates that women are 5 to 8 times more likely to have their employment prospects disrupted by caregiver responsibilities through reduced hours or by dropping out of the workforce altogether.
The decision to work part-time, in itself, may unduly undermine women’s performance and career prospects. For example, part-time workers may be excluded from training opportunities, important meetings and committees, have less access to critical information and resources, be allotted the most disadvantageous work times, and are often forced to contend with the stigma that they are not serious about their professional lives. Taken together, women who work part-time may be at a profound disadvantage, placing their performance and careers at risk for the good of the family.
Solution: Examine the relative incidence of part-time work by group and whether part-time work adversely affects performance and compensation.
Are men and women promoted at the same rates?
In many organizations, the typical financial progression is upward through salary levels. However, that path may be more difficult and time-consuming for women. In this case, women who have faced long periods of stagnation within a job level may receive incremental pay increases that gradually move them higher and higher within their salary ranges, and consequently appear to be well compensated for their work. The pay of women, therefore, may aptly reflect their extended tenures by being paid highly within their ranges, but this obscures the fact that many women may have been passed over for well-deserved promotions and really should be at a higher job level and receiving greater compensation.
Solution: Investigate time to promotion by group.
Is the market biased against women?
Occupations differentially populated by women sometimes do not get the market recognition these positions are owed: the value of the job to organizations is greater than the market gives credit for. And, yet, pay equity studies in the United States are conducted as if the market perfectly assesses value. For example, one job that is immensely complex and central to the operational excellence in healthcare is the Chief Nursing Officer (85% female ). There has been ample speculation that the market does not fully recognize the import of this position to organizations. Thus, women who are paid to market may be getting less than their true value to the organization, requiring a pay equity analysis that evaluates the worth of jobs independently of the market.
Solution: In addition to the customary benchmarking of positions, evaluate positions independently of the market using standard job criteria and relate those values to current compensation.
These are a few of the more common questions we suggest that organizations ask and answer. The relief experienced when a pay equity study returns favorable outcomes should only offer partial comfort. A deeper, more inquisitive analysis is required to understand if true equity exists and, if it does not, to make meaningful changes so that it can.Download PDF >
PRESS RELEASE | 2023 Physician Compensation and Productivity Survey
Responding to supply and demand forces, SullivanCotter’s 2023 Physician Compensation and Productivity Survey results indicate significant increases in Total Cash Compensation (TCC).
—
CHICAGO–(BUSINESS WIRE)–SullivanCotter, the nation’s leading independent consulting firm in the assessment and development of total rewards programs, workforce solutions, and data products for health care and not-for-profits, has released its 2023 Physician Compensation and Productivity Survey report.
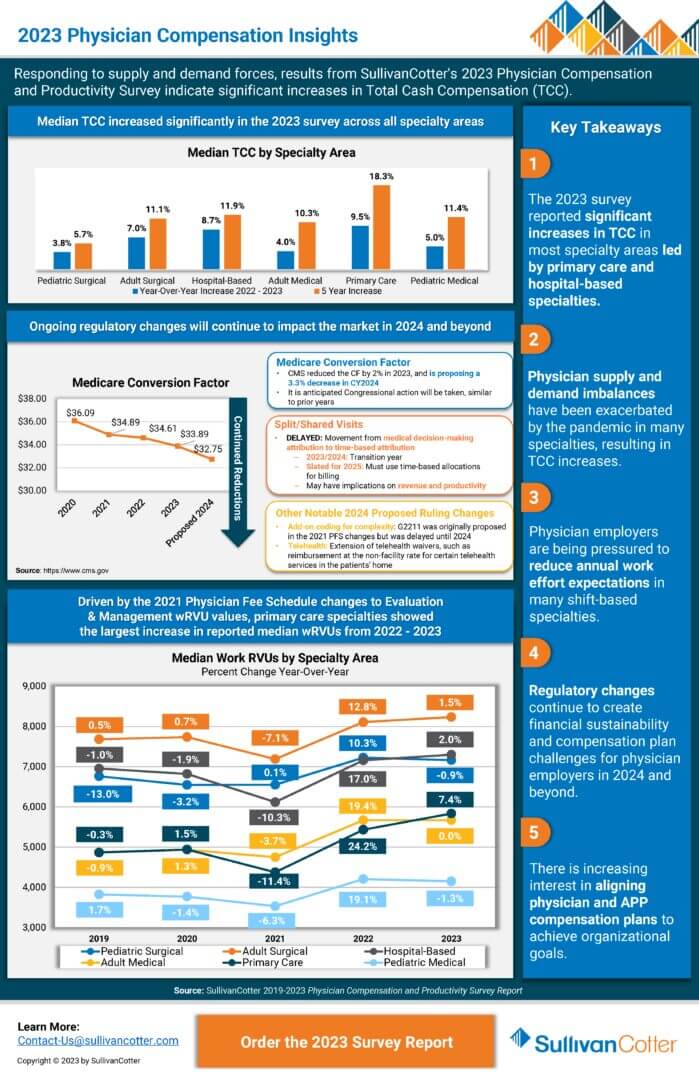
The report reveals the most significant median total cash compensation (TCC) increases for Primary Care (9.5%) and Hospital-Based (8.7%) specialties, and finds increases across most specialty areas in 2023. With the anticipated shortage of primary care physicians (survey respondents reported the highest percentage turnover in primary care at 8.4%) projected to increase, healthcare organization leaders will confront sustained upward pressure on compensation for these roles moving forward.
SullivanCotter’s data represent the largest and most comprehensive physician compensation resource for health systems and hospitals, with findings reported on more than 306,765 physicians, APPs and PhDs.
Numerous market forces continue to influence health systems’ strategic and operational focus for 2023, many of which are directly impacting the provider workforce. Clinical workforce demand continues to outpace supply, which has been exacerbated by increased turnover and physician burnout and has created upward pressure on compensation. Regulatory changes, including a proposed reduction in the Medicare conversion factor for 2024 and changes to split/shared billing for 2025, continue to create financial sustainability and compensation plan challenges. Finally, in part due to physician supply and demand imbalances, more health care organizations are working to better align physician and advanced practice provider (APP) care delivery models and eliminate potential compensation barriers to team-based care delivery.
“For primary care specialties, the Physician Fee Schedule transition is still impacting physician compensation as compared to last year’s survey results. As for the hospital-based specialties, many of the physician specialties with the most significant reported TCC increases in the 2023 survey were on the front lines in the pandemic, including hospitalists, intensivists, and emergency medicine,” said Dave Hesselink, Managing Principal, SullivanCotter.
The survey also reported that primary care had the largest increase (7.4%) in reported median wRVU productivity from 2022 to 2023. “As primary care patient volumes have rebounded post-pandemic and wRVU values have shifted due to the Physician Fee Schedule changes, this jump in reported wRVU productivity is expected,” Hesselink added. Across all specialty categories, TCC per wRVU rates saw moderate increases over 2022 survey levels with a spike in pediatric surgical rates (8.8%).
The 2023 report showed that base salary and wRVU components continue to be prevalent in primary care, medical, and surgical specialty compensation plans. About 70% of survey participants report using those plan components in their compensation plans, which is consistent with the 2022 survey results. Value-based or quality incentives are used by about 50% of organizations and payments range from 6-8% of TCC for specialists, and 8-9% for primary care, reflecting a slight increase over 2022 survey results which reported ranges of 5-6% and 6-8%, respectively.
Additionally, the prevalence of team-based incentive compensation continued to trend. Similar to the 2022 survey results, approximately one-quarter of organizations (23%) indicated they used team-based incentives in their compensation plans. Of those with team-based incentive compensation, the incentive accounted for 11% of physician TCC, which has been trending upward since 2020 when it was reported at approximately 8%. Just over half of organizations (52%) defined a “team” as including both physicians and advanced practice providers (APPs).
“Increased use of team-based incentive compensation correlates with the growing focus our clients have on population health, care coordination, and positioning APPs to practice at top of license. Now, more than ever, we see organizations evaluating how APPs can most effectively partner with physicians and care teams to deliver high-quality patient care,” said Mark Ryberg, Managing Director and SullivanCotter’s Physician Workforce Practice Leader.
About SullivanCotter
SullivanCotter partners with health care and other not-for-profit organizations to understand what drives performance and improves outcomes through the development and implementation of integrated workforce strategies. Using our time-tested methodologies and industry-leading research and information, we provide data-driven insights, expertise, and data products to help organizations align business strategy and performance objectives – enabling our clients to deliver on their mission, vision, and values.
For more information on SullivanCotter’s surveys, please visit our website at www.sullivancotter.com, or contact us via email or by phone at 888.739.7039.
Note to media: Additional data and interviews are available on request.
INFOGRAPHIC | 2023 Physician Compensation Insights
According to SullivanCotter’s 2023 Physician Compensation and Productivity Survey report, physician supply and demand imbalances have resulted in total cash compensation increases as well as increased pressure on physician employers to reduce annual work effort expectations in many shift-based specialties. Gain additional insights and view key takeaways.
PRESS RELEASE | 2023 Executive Compensation Survey
Health care organizations and boards should continue to balance competitive talent markets with an uncertain performance environment.
—
October 12, 2023 – CHICAGO – SullivanCotter, the nation’s leading independent consulting firm in the assessment and development of total rewards programs, workforce solutions and data products for health care and not-for-profits, has released its 2023 Health Care Management and Executive Compensation Survey report.
Base Salaries
The report details year-over-year changes in median base salaries for healthcare leaders (i.e., salary, merit, across-the-board, market adjustments). This year’s 4.1% increase for all healthcare executives is slightly lower than the 2022 increase (4.3%). The findings represent the largest and most comprehensive resource for hospitals and health systems, surveying more than 3,000 organizations representing roughly 42,160 individual incumbents.
“Health systems have been under pressure to ensure that leaders have the skills needed to address a complex operating environment, including workforce shortages, increased labor, supplies and borrowing costs, and ongoing revenue shortfalls due to service mix changes, access limitations and low volumes,” said Bruce Greenblatt, Executive Workforce Practice Leader, SullivanCotter.
As a result, base salary levels are trending up, as health systems seek to attract, retain and motivate the right leaders in a competitive market. And compensation committees are working to balance the financial, operational, and talent risks as they oversee the executive compensation program.
Incentive Awards
While 2023 salaries increased, incentive awards moderated. Incentive plan payouts were lower for 2022 performance compared to 2021, reflecting a more challenging operating environment and sustained financial headwinds. As a result, the year-over-year increase in 2023 total cash compensation (TCC, equal to base salaries plus annual incentive awards) was lower than the increase in base salaries. While health system executives’ base salaries increased by 4.8%, median TCC levels increased by 3.5%. Median annual incentive payouts for 2022 were moderately below target, compared to payouts that were moderately above target last year. The data showed no significant shifts in annual incentive plan prevalence or award opportunity levels.
“The year-over-year change in TCC was more modest due to a dip in incentive plan payouts in 2022, which reflected more pressures and variability in performance,” said Tom Pavlik, Managing Principal, SullivanCotter. “Incentive plans are working as designed, given the challenges in meeting performance goals.”
Differentiation in Salary Adjustments for Select Roles
Given the increasing complexity of health systems and the focus on integration, health system executive salary increases (4.8% at median) outpaced subsidiary hospital executive salary increases (3.9% at median), continuing a trend observed over the past several years.
Health system positions that noted higher increases in pay (roles with median base salary increases of 5.0% or higher) tended to be those focusing on strategy/planning, technology, financial sustainability and risk, integration, and workforce strategy:
- Top Leadership Roles: Chief Executive Officer, Chief Operating Officer, Chief Financial Officer
- Technology Roles: Chief Information Officer, Top Information Security Executive
- Business/Operating Roles: Top Planning Executive, Top Risk Management Executive, Top Internal Audit Executive
- Workforce Leadership Roles: Chief Human Resources Officer, Diversity, Equity, and Inclusion Officer
Planning for 2024 and Beyond
Health care organizations and their boards should ensure that executive compensation programs and governance are able to adapt to today’s challenging environment. As it relates to compensation and talent strategy, organizations should consider the following:
- Anticipate base salary increase budgets for FY2024 that include both core merit increases (estimated to be 3.0% at median) and market adjustments to retain key contributors and address pay equity issues.
- Focus incentive plan measures and goals on key operating and strategic priorities, including quality of care, efficiency, growth, access, and employee wellness/engagement.
- Differentiate rewards so limited dollars are directed to address retention/recruitment needs and reward high performers critical to the organization’s short and long-term leadership plans; ensure that the compensation philosophy allows for flexibility to differentiate rewards and programs.
- Conduct a risk assessment to determine where there may be potential retention concerns for critical roles; develop an intervention plan to mitigate risks, considering compensation, professional development, and other tactics.
- Focus on internal leadership development and talent-building to help retain and grow the current leadership team – such an approach reinforces the organization’s desired culture and may potentially reduce costs related to external recruitment.
- Regularly review and refine succession plans; memorialize professional development plans; ensure a strong talent pipeline; determine gaps or emerging skills where external hires may be necessary.
- Review the leadership organization structure, to assess if the executive headcount, distribution, and spans of control are optimal; consider if executive leveling criteria should be evaluated to support integration and talent strategy.
- Ensure adequate flexibility to support recruitment, retention, and performance, including using a range of peer groups, tailored competitive positioning based on criticality and performance, and individualized compensation arrangements (including tailored incentives and multi-year retention awards for select individuals).
About SullivanCotter
SullivanCotter partners with health care and other not-for-profit organizations to understand what drives performance and improve outcomes through the development and implementation of integrated workforce strategies. Using our time-tested methodologies and industry-leading research and information, we provide data-driven insights, expertise, and data products to help organizations align business strategy and performance objectives – enabling our clients to deliver on their mission, vision, and values.
For more information on SullivanCotter’s surveys, please visit our website at www.sullivancotter.com or contact us via email or by phone at 888.739.7039.
Note to media: Additional data and interviews are available on request.
FOR IMMEDIATE RELEASE
Contact: Becky Lorentz, SullivanCotter
beckylorentz@sullivancotter.com
314.414.3719
Amy Fisher, Padilla
amy.fisher@padillaco.com
612.805.5707
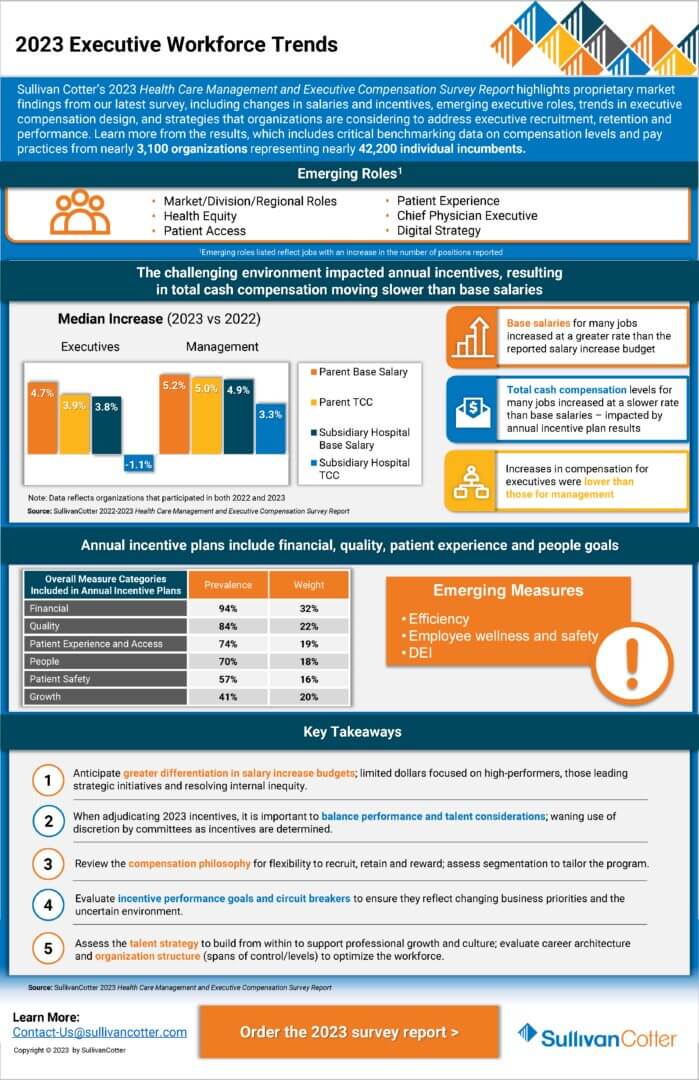
INFOGRAPHIC | 2023 Executive Workforce Trends
Sullivan Cotter’s 2023 Health Care Management and Executive Compensation Survey Report highlights proprietary market findings from our latest survey, including changes in salaries and incentives, emerging executive roles, trends in executive compensation design, and strategies that organizations are considering to address executive recruitment, retention and performance. Learn more from the results, which include critical benchmarking data on compensation levels and pay practices from nearly 3,100 organizations representing nearly 42,200 individual incumbents.
The 2023 survey report is now available for purchase.
Bridging the Union vs. Non-Union Compensation Gap
Short and Long-term Strategies to Attract and Retain Clinical Talent
Organizations increasingly recognize the need to pay non-union nurses competitively to compete against union members and the broader market. Although this is critical to bridging the gap, flexibility and balance are also important considerations in delivering innovative solutions that meet workforce needs.
In our recent article, “The Presence and Impact of Labor Unions among Health Care Workers,” Cathy Loose, Managing Principal and Employee Workforce Practice Leader at SullivanCotter, offers some short and long-term approaches to creating a competitive rewards program to attract and retain clinical talent.
Fill out the form below to download the full article.

