
SullivanCotter Launches New C3 Nonprofit Consulting Group
Partnering with the world’s most impactful organizations to navigate people and culture solutions
CHICAGO, May 17, 2023
SullivanCotter, the nation’s leading independent consulting firm in the assessment and development of total rewards programs, workforce solutions, and data products for the health care industry and nonprofit sector, has launched its C3 Nonprofit Consulting Group, forming a distinct business whose mission is to partner with the world’s most impactful nonprofit organizations to navigate people and culture solutions.
According to the National Council of Nonprofits, America’s 1.3 million nonprofits play a fundamental role in creating more equitable and thriving communities, fostering civic engagement and leadership, driving economic growth and strengthening the fabric of society. Largely due to the significant wage gap that exists between for-profit and nonprofit employers, nonprofits have historically struggled to attract and retain high-performing leaders and staff. This can negatively impact retention, limit which individuals can afford to work at nonprofits and even reduce the health and diversity of employees. C3 Nonprofit Consulting Group was formed to foster change in the nonprofit sector.
C3 Nonprofit Consulting Group partners with the world’s most impactful orgs to navigate people and culture solutions.
Nonprofits require specialized expertise
SullivanCotter has worked with tax-exempt organizations within and outside health care for more than 30 years and is widely recognized as the leader in workforce performance consulting and data solutions. Although the demand for specialized services and support for 501(c)(3), 501(c)(4) and 501(c)(6) institutions has rapidly increased, strategies for compensation and other workforce rewards have not advanced alongside this demand.
“With a heightened interest in addressing pay equity, building equitable workplace strategies and advancing important diversity and inclusion initiatives, many of our nonprofit clients are early adopters keen on paving the way. As a result, SullivanCotter’s Not-for-Profit Practice was thriving, and we believe that building a separate entity devoted exclusively to partnership and guidance in this sector will help more organizations propel their mission forward,” said Ted Chien, President and CEO, SullivanCotter.
Grounded in 100+ years of collective expertise in compensation and total rewards, regulatory compliance, talent management and equitable workplace strategies across all industries, C3 combines boutique attentiveness and an unparalleled nonprofit focus built on the proven, longstanding resources of SullivanCotter.
“We’ve served nonprofit clients outside of the health care industry for decades and we’re thrilled to be moving forward as a new and dedicated entity, continuing to provide the world’s most impactful organizations with best-in-class strategies, resources and insights. Our vision is to lead with purpose, embrace our clients’ missions as our own and help them implement meaningful change designed to optimize the workforce and accelerate impact,” said Nanci Hibschman, Managing Principal and Division Leader, C3 Nonprofit Consulting Group.
C3 will serve private and community foundations, charities and service organizations, policy, advocacy and research institutes, colleges and universities, arts and cultural organizations and more.
For more information on C3 Nonprofit Consulting Group visit us at www.C3NonprofitConsulting.com or contact us at 888.739.7039.
About C3 Nonprofit Consulting Group
C3 Nonprofit Consulting Group is an advisory services firm focused exclusively on helping nonprofit organizations unleash the full potential of their people. We partner with nonprofits to design competitive compensation and rewards programs, build equitable workplace strategies and implement talent programs designed to propel their missions forward. C3 is here to help the nonprofit workforce thrive.
Contact: Becky Lorentz
SullivanCotter
beckylorentz@sullivancotter.com
314.414.3719
Jenni Bowring
Padilla
jenni.bowring@padillaco.com
651.226.3858

Proactive Workforce Planning: Grounded in Data
Meeting Three Essential Business Imperatives in an Ongoing Health Care Workforce Crisis
Enhancing Revenue, Reputation and Resilience
Amid an ongoing health care workforce crisis, hospital and health system leaders are confronting employee burnout, wage pressure, staff departures and other challenges while striving to deliver high-quality, affordable and accessible care.
In a recent article for Fierce Healthcare, SullivanCotter’s President and CEO, Ted Chien, describes the benefits of analyzing workforce size and shape and how robust benchmarking can inform long-term planning and provide the backbone for critical structural decisions.
He also highlights important foundational questions leaders should be asking themselves to help them better manage three critical business imperatives: Revenue, Reputation, and Resilience.

Physician-Hospital Affiliation Strategies
Physician-Hospital affiliation strategies designed to improve organizational performance
Market pressures continue to test the financial sustainability of health care organizations nationwide. To succeed in a rapidly evolving marketplace, health systems, medical groups and physicians must work together to develop a more intentional and comprehensive affiliation strategy to help drive performance and improve outcomes.
Affiliation strategies continue to evolve and new trends are emerging as organizations look to address increasingly complex challenges such as the ongoing impact of the COVID-19 pandemic, staffing shortages, changes in reimbursement, and mounting financial pressures.
These factors have accelerated the pace of change in affiliation models and resulted in several emerging trends:
Shift from Private Practice to Employment
The shift towards employment and away from private practice has accelerated following the onset of the pandemic. Data shows that over 70% of US physicians are employed by hospitals, health systems or corporate entities.1
Growth of Non-Traditional Health Care Participants
New players have entered the market and are creating more competition to recruit and retain physician talent. The presence of other physician employers in private equity, retail medicine, joint ventures, and insurance companies is threatening the ability of traditional health systems to grow and retain market share.
Expansion and Refinement of Co-Management Arrangements
In addition to refining current arrangements to focus on more meaningful performance metrics such as expanding access, encouraging greater care coordination, reducing variation of care and aligning metrics with payer reimbursement, health systems are expanding the use of these arrangements to additional service lines. There is also growth in service line governance which enables physician leadership to have a “seat at the table” and authority in service line decision-making.
Advancement of Professional Services Agreements
Professional services agreements (PSAs) continue to be highly utilized in circumstances where physicians want to retain their autonomy under an ‘employment lite’ scenario. They are also prevalent in states where regulations prohibit direct employment of physicians.
Focused Efforts on Strategic Affiliation
While health systems have historically evaluated physician affiliation alternatives on a case-by-case basis, many are now highly engaged in system-wide provider workforce planning. There is a movement toward dedicated teams or individuals to focus on strategic provider affiliation.
Affiliation to Support New Care Models
As a way to improve access for the communities they serve, many health systems are affiliating with physicians as a means to support new care models such as telehealth, hospitalist-at-home programs and other niche clinical service offerings.
1 Source: Physician Advocacy Institute. (2022). COVID-19 Impact on Acquisitions of Physician Practices and Physician Employment 2019-2021. Accessed at http://www.
physiciansadvocacyinstitute.org/Portals/0/assets/docs/PAI-Research/PAI%20Avalere%20Physician%20Employment%20Trends%20Study%202019-21%20Final.pdf
SullivanCotter partners with clients to develop affiliation frameworks that drive physician alignment, medical group performance, and financial results.
Contact us to learn more.

PRESS RELEASE | SullivanCotter Expands Advanced Practice Provider Services Team
APP Workforce Practice: SullivanCotter appoints Market Leader and welcomes strategic new consulting hires
Chicago, IL | March 14, 2023
SullivanCotter, the nation’s leading independent consulting firm in the assessment and development of total rewards programs, workforce solutions, and data products for health care and not-for-profits, announces the expansion of its advanced practice provider (APP) services team to help clients navigate an increasingly dynamic talent market for nurse practitioners, physician assistants, CRNAs and more.
Zachary Hartsell, a Principal in SullivanCotter’s APP Workforce Practice, has been appointed to the new role of APP Market Leader, reflecting his unparalleled industry expertise and longstanding partnership with clients to address emerging workforce issues in APP compensation, utilization, workforce planning and more. In addition to his work as a consultant, Zachary has more than 20 years of experience as a practicing physician assistant (PA-C), clinical leader and educator.
“The demand for APPs remains high, especially in the middle of an ongoing healthcare workforce crisis. The challenges our clients are facing have grown increasingly niche as it relates to this critical provider group and, in response, we’ve assembled a team of highly specialized experts and industry leaders with a wealth of diverse clinical, operational and financial capabilities,” said Ted Chien, President and CEO, SullivanCotter.
Other new additions to the practice include:
- Lacey Buckler, Principal – With 20+ years as a certified nurse practitioner, Lacey is a well-rounded consulting leader that leverages specialized knowledge and first-hand experience in clinical operations and workforce management. As the former Chief Advanced Practice Officer and Chief Nurse/Service Line Leader for a large academic medical center and teaching institution, she was responsible for providing strategic leadership and oversight to more than 600 APPs and more than 700 registered nurses.
- Hadley Powless, Consulting Manager – Hadley has over 16 years of experience as a clinical PA-C with direct insight into the challenges APPs and their employers encounter on a daily basis. She is a trusted advisor committed to helping organizations optimize their growing APP workforce. Prior to joining SullivanCotter, Hadley served as the Director of Advanced Practice at a large integrated health system in the Midwest.
“In order to address a growing list of APP workforce and operational concerns — including recruitment and retention challenges, costly clinician turnover due to burnout, regulatory changes, and evolving compensation structures — health care organizations require best-in-class resources, insights, and advisory solutions. We are committed to adapting to new industry demands alongside our clients and look forward to sharing our expertise as the practice grows,” said Amy Noecker, Principal, SullivanCotter.
Additionally, the practice continues to build out its growing suite of APP research and proprietary survey data. The 2023 APP Compensation and Productivity Survey is open for participation until March 24 and includes critical market benchmarks on base salary, total cash compensation, productivity, emerging pay practices, and more. Participating organizations receive a sizable discount on the final report.
To learn more about SullivanCotter, please visit us at sullivancotter.com or contact us for more information.
About SullivanCotter
SullivanCotter partners with healthcare and other not-for-profit organizations to understand what drives performance and improve outcomes through the development and implementation of integrated workforce strategies. Using our time-tested methodologies and industry-leading research and information, we provide data-driven insights, expertise, and data products to help organizations align business strategy and performance objectives – enabling our clients to deliver on their mission, vision and values.
Note to media: Additional data and interviews are available on request.

PRESS RELEASE | Cost of Labor Increases Amid Ongoing Health Care Workforce Crisis
Base payroll expense, when adjusted for growth in headcount, has increased by 7.1%
Chicago, IL | February 21, 2023
SullivanCotter, the nation’s leading independent consulting firm in the assessment and development of total rewards programs, workforce solutions, and data products for health care and not-for-profits, has released findings from its 2022 Workforce Metrics Benchmark Survey.
Healthcare organizations are in an ongoing workforce crisis, and they continue to struggle with high turnover, employee burnout, wage pressure and other recruitment and retention challenges – all of which have driven up the cost of labor, increased the competition for talent, and forced organizations to consider the relationships between workforce design, talent, compensation, and performance management.
Year-over-year comparisons indicate that annual base payroll expense, which constitutes the vast majority of an organization’s overall yearly expenditures, has gone up almost 10% from 2021 to 2022. Further analysis shows that 7.1% of this is not attributable to full-time equivalent (FTE) headcount increases which have grown only modestly between 1.9% and 2.6% for the overall healthcare workforce. For the average participating organization with an annual base payroll expense of $1.6 billion, this has added almost $115 million dollars to the bottom line.
Diving deeper into these findings – including data reported on multiple job families and demographic groupings throughout different career level stages – provides insight into how organizations may need to adjust their planning and distribution efforts to help offset rising costs and create a more affordable and sustainable workforce architecture.
Assessing Workforce Cost and Structure
Although this past year has seen almost double-digit growth (9.3%) in base salary expense for Individual Contributors, driven in part by minimum and living wage increases, many hospitals and health systems are experiencing potentially unsustainable growth across multiple career stages. Salaries for Managers and Directors have grown by 13.7% and 14.8%, respectively, which has added to overall cost concerns. Additionally, headcount growth for the overall leadership structure – particularly in newly identified roles such as population health, value-based care and health equity – is far outpacing that of Individual Contributors by increasing at rates between 3.5 times and 5.5 times higher.
“While the significant growth and diversity of expertise in Manager and Director ranks may produce positive results in some clinical settings, it also requires greater investment. Organizations are going to have to rebalance the size and shape of their workforce to help create a more sustainable model. For instance, we see many organizations focusing more on leadership roles in order to optimize oversight ratios, expand the span of control, and isolate areas of role and title inflation that have been occurring since 2020,” said Tim Pang, Principal, SullivanCotter. Nearly 70% of survey participants have formally reviewed, or soon expect to review, the size, structure or management spans of control of their leadership group.
Understanding workforce growth and distribution across different job families is also important and can play a key role in effective workforce planning. From 2021-2022, Nursing and Human Resources saw the most notable drops in headcount at the largest organizations (those with more than 30,000 FTEs) with decreases of 8.8% and 8.3%, respectively. Legal and Compliance, conversely, has seen large increases in their populations at smaller and mid-size organizations with 20%-25% growth.
Workforce Demographics – Gender, Race and Age
As important diversity, equity and inclusion (DE&I) initiatives remain a top priority for health care organizations nationwide, many are looking for greater insight into the diversity of their employee populations as represented across race, gender and other demographic characteristics.
Across the 10 job families included in the survey, gender representation is highly skewed with females representing 75.3% of the workforce in 2022. This is highest in Financial Services, Nursing, and Care Management – with all three job families at over 80% representation. While the three job families with the highest male populations are Facilities, Information Technology and Emergency Medical Services, these are more evenly split and range from 47.3% – 56.2% males.
When analyzing by career stage, female representation at the Manager level is strong at 72.4%, but steadily declines to just under 50% for Executive roles.
“Demographic shifts will create an opportunity to impact workforce diversity and equity. By the end of 2023, a significant number of leaders at all levels will become retirement eligible. With the added focus on broader workforce diversity in race and gender, organizations are being more deliberate in tracking and sourcing wider representation in their candidate pools as they look to support strategic DE&I initiatives,” said James Roth, Managing Principal, SullivanCotter.
Although minority representation by race from 2021 to 2022 remains stable across all career stages – including Individual Contributors (up 0.3%), Managers (up 0.7%), and Directors (no change) – year-over-year growth is highest at the Executive level with a 1.6% increase.
Planning Considerations for 2023 and Beyond
Driven by a number of competing forces, the health care talent market continues to be increasingly dynamic. Organizations looking to remain competitive should consider a number of critical workforce structure improvements to help offset rising labor costs and better define future roles and career pathways.
These considerations include:
- Address rising payroll expense by investing in technology, improving key processes, and rebalancing the size and shape of the workforce to create a more sustainable and affordable model moving forward.
- Focus on the centralization of Shared Services to help manage rising costs. Large multi-site systems that have not fully harmonized can centralize core support functions as a way to achieve standardization, reduce total delivery costs, leverage remote staffing models and offer a broader range of career pathways.
- Support greater employee engagement. Compensation interventions alone are not always adequate – culture, career growth, development, recognition, and health and well-being are also critical components of an evolving workforce strategy.
- Reconsider the utilization of remote work structures where possible to create greater work-life balance and more flexible staffing models. This will also help to expand the labor pool and improve cost management.
- Remain committed to critical DE&I initiatives. While racial representation at the executive level has improved, stagnation at the Director-level and an across-the-board reversal on gender representation can be improved with regular benchmarking, the establishment of more formalized targets, and a greater focus on talent acquisition and talent management planning.
“It is important to note that while there is value to be gained by reassessing workforce design to leverage cost savings and build a more effective leadership structure, managing the size and shape of the workforce alone will not transform the organization. Understanding how workforce design, talent management, and compensation strategy work together to influence system-wide performance is critical in today’s environment,” said Ted Chien, President and Chief Executive Officer, SullivanCotter.
SullivanCotter’s 2022 Workforce Metrics Benchmark Survey includes critical benchmarking data across 10 job families, 6 career-level categories, and 3 demographic groupings to provide insight into the following metrics:
- SIZE: Number of FTE headcount
- SHAPE: Career stage distribution of FTE headcount
- COST: Annualized base payroll expense of FTE headcount
- DEMOGRAPHICS: Gender, racial and generational representation
- OVERSIGHT: Management direct span of control
For more information on SullivanCotter’s surveys, please visit our website at www.sullivancotter.com, or contact us via email or by phone at 888.739.7039.
About SullivanCotter
SullivanCotter partners with healthcare and other not-for-profit organizations to understand what drives performance and improve outcomes through the development and implementation of integrated workforce strategies. Using our time-tested methodologies and industry-leading research and information, we provide data-driven insights, expertise, and data products to help organizations align business strategy and performance objectives – enabling our clients to deliver on their mission, vision and values.
Note to media: Additional data and interviews are available on request.

Utilizing Physician Compensation and Productivity Benchmarks
Struggling to understand the effect of recent Physician Fee Schedule changes on the 2022 provider compensation and productivity survey benchmarks?
This year’s survey benchmarks for physician compensation and productivity have been materially impacted by recent modifications to the Physician Fee Schedule. The changes, which were made effective on January 1, 2021, by the Centers for Medicare and Medicaid Services (CMS), significantly altered the work Relative Value Unit (wRVU) weights applied to common Evaluation and Management (E&M) billing codes. Specifically, E&M wRVU weights were increased to benefit Primary Care and other specialties that most often provide these services. As a result, year-over-year comparisons of survey benchmarks require special review and must be carefully considered when incorporating insights into workforce planning and compensation decision-making.
To help organizations properly address the ongoing impact of these changes, SullivanCotter’s 2022 Physician Compensation and Productivity Survey requested that respondents supply data based on wRVU values from both the 2020 and 2021 Physician Fee Schedules. Utilizing this information, SullivanCotter conducted an analysis of the subset of survey participants that reported data under both the 2020 and 2021 PFS wRVU values – a “same-store” approach. Several useful findings emerged that provide organizations with data-driven insights for future changes to compensation programs.
Both the aggregate survey results and the same-store analysis are discussed in this article along with considerations and implications for health care organizations as they move forward with planning for 2023 and beyond.
Changes in Survey Data from 2020-2022
Results from SullivanCotter’s 2022 Physician Compensation and Productivity Survey Report indicate that median total cash compensation (TCC) across all specialties increased by approximately 2% over results reported in 2021 and 2020, respectively, as shown in the Overall grouping for Median TCC in Table A.1 In some recent years, we have seen slightly larger year-over-year increases due to inflation. As COVID-19 impacted some specialties in different ways, we believe the overall increases were muted.
Table A: Median TCC and Same-Store wRVU Impact by Specialty Grouping
1Note that median TCC in 2021 was fairly flat overall due to the impact of the COVID-19 pandemic.
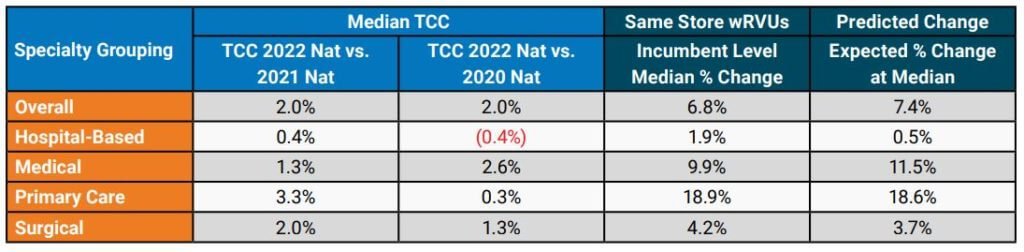
Although the year-over-year increase in TCC was modest overall, some specialty groupings showed more significant increases. Primary Care (including Internal Medicine and Family Medicine) median TCC increased by 3.3% from the 2021 to 2022 surveys, which was likely driven in part by the changes to the Physician Fee Schedule. The change for Hospital-Based specialties, such as Hospitalists, yielded an increase of only 0.4% over the same time period. This limited change may be related to the common market practice of compensating Hospitalists on an hourly or shift basis instead of a predominantly wRVU-based formula.
For the subset of organizations included in the same-store analysis, SullivanCotter conducted an evaluation of wRVU changes. The Same-Store wRVUs column in Table A shows the median change in wRVUs using data at the incumbent level. Although all specialty categories yielded increases, some were more significant than others. As expected, Primary Care (+18.9%) and Medical (+9.9%) specialties had the most significant increases. At the same time, smaller changes occurred in Surgical (+4.2%) and Hospital-Based (+1.9%) specialties, which tend to use proportionately fewer E&M codes.
These results aligned fairly closely with the anticipated changes based on wRVU coding profiles for each specialty as reported in the Predicted Change column in Table A. The predicted changes are based on an analysis by SullivanCotter that included CPT-level detail that used CMS tables to estimate the impact of the PFS changes before the most recent survey data became available.
While the same-store wRVU analysis illustrates the impact of the 2021 PFS changes, other market forces – such as the lingering effects of the pandemic and expanded use of telemedicine services – also impacted reported wRVU information.
Organizations are still relatively split in regard to their approach to measuring wRVU productivity moving forward. SullivanCotter recently surveyed 40 large, integrated health care organizations and learned that approximately 40% were still maintaining the 2020 PFS to calculate physician compensation and another 50% were moving to or had already started utilizing either the 2021 or 2022 PFS.
Specialty-Specific Same-Store Analysis
To illustrate the impact of the changes to wRVU values at the individual specialty level, a sampling of specialty-specific information is provided in Table B. This data highlights the reported increases in median TCC as well as the corresponding wRVU changes. Notable changes in TCC for Family Medicine and Internal Medicine can be seen in SullivanCotter’s 2022 survey data. Gastroenterology and Orthopedic Surgery – General showed more modest increases in TCC in the most recent year.
Table B: Analysis of Selected Specialties
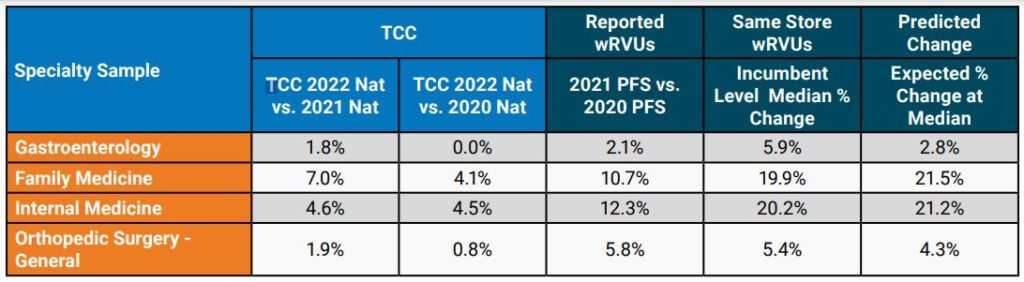
When limiting the analysis to the same-store incumbents, the median wRVU percent change increased noticeably for the specialties highlighted in Table B. The impact of the PFS changes can vary substantially from one specialty to another and, as organizations evaluate their physician compensation programs, understanding how to properly evaluate the market data will help inform more effective decision-making.
Considerations and Implications for Health Care Organizations
The impacts on this year’s survey benchmarks present a number of issues for consideration:
- It is imperative that organizations understand the full extent of wRVU value changes and decide how to move forward. Physicians and administrators must know which version of the PFS their group is using for internal wRVU productivity and compensation calculations and how that data compares to currently-published survey data.
- Benchmarking to market survey data without appropriate adjustments may yield inaccurate
results. For example, if an organization adopts the 2021 PFS wRVU values but continues to use compensation per wRVU conversion factors that were in effect under the 2020 PFS, the group risks substantially overpaying certain specialties. These payments could potentially invoke fair market value (FMV) and commercial reasonableness concerns. Recall that the overall increases in TCC have been modest at approximately 2% overall in recent years. - Not all third-party payors have adopted the 2021 PFS adjustments. As a result, an organization may be in a situation whereby maintaining historical conversion factors but using updated wRVU values would lead to significant financial strain as there may not be additional reimbursement to cover increased wRVUs. Many health care organizations have neutralized the cost impact of the wRVU changes with compensation formula/conversion factor adjustments (effectively lowering the compensation per wRVU on a specialty-specific basis). Notably, CMS attempted to neutralize the impact of the wRVU changes on cost through a decrease in its reimbursement conversion factor for professional services — which was subject to additional action by Congress.
Implications to Future State Compensation Planning
When deciding how to move forward to mitigate the impact of the PFS changes on compensation structures, there are several responses to consider. Table C summarizes some approaches that can be employed. Please note that a combination of these approaches may be necessary to accommodate various production-based and shift-based compensation models.
Table C: Options to Consider
| Across-the Board TCC Increases (e.g., 2.0%) | Determine funds available for annual compensation increases and adjust compensation formulas to achieve this result. Can be applied across-the-board or adjusted to achieve overall budgeted level. |
| Conversion Factor Adjustments with Guard Rails | Adjust conversion factors (compensation per wRVU) by specialty and incorporate guard rails to guide TCC changes so that no specialty would have an unsustainable increase/decrease year-over-year. |
| Compound Annual Growth Rate (CAGR) Approach | Determine the percentage change in compensation per wRVU over a number of years prior to the PFS changes (e.g., 3-year period) by specialty. Determine the average annual growth rate and apply it to 2021 actual PFS-adjusted conversion factors on a go-forward basis. |
| Full-Scale Compensation Plan Redesign | Instead of making adjustments to adapt to certain PFS changes, reconsider the compensation philosophy for the group and build flexibility into the compensation plan for current and future reimbursement/regulatory changes. |
In some cases, planning modest across-the-board increases in TCC for salaried or shift-based specialties while using more tailored conversion factor adjustments for production-based specialties may work well. Consider these changes on a specialty-specific basis as the PFS changes affected specialties differently as earlier illustrated in Table B.
The incorporation of guard rails may help to ensure that adjustments at the conversion-factor level do not result in TCC that is not desirable from an FMV perspective or is not financially sustainable. For example, an organization may decide that no specialty will see an increase greater than 5% in its conversion factor over a single year or that the change in the conversion factor would not result in TCC increasing by more than 3% for the same amount of services delivered (e.g., aggregate frequencies by CPT code do not change significantly). Be clear which version of the PFS wRVU values you are using so that conversion factors are appropriate – and recognize future market survey data will be based on the current version of the PFS (i.e., 2021 CMS PFS or later).
A more tailored approach to consider is a Compound Annual Growth Rate (CAGR) analysis. The analysis begins by taking historical compensation per wRVU data at a certain level – such as the median – for a number of years prior to the 2021 PFS changes. Using this data, the average annual growth rate is determined by specialty. This rate is then applied to the 2021 PFS-adjusted rates on a go-forward basis. Be sure to evaluate the results in terms of cost to the organization and other considerations such as FMV and commercial reasonableness.
For some health care organizations, it may also be an appropriate time to reconsider provider compensation overall. The recent PFS changes are substantial and additional modifications are
planned for the future. A revised compensation philosophy can assist in setting a new approach for compensation plan administration that evolves alongside changes in the market. A total compensation plan redesign also provides an opportunity for groups to better align physician and advanced practice provider (APP) incentives where the opportunity exists. This approach can also be used to reset compensation formulas where temporary plans were implemented to address pandemic-related needs. Some organizations may require or prefer a comprehensive compensation plan redesign over piece-meal adjustments by specialty.
One option for consideration is salary-based compensation with clearly defined performance expectations. These expectations may include production targets as well as clinical/value-based measures. If such an option is adopted, a carefully considered scorecard approach to compensation administration is recommended.
Through all of this work, it is important to provide ongoing education and communication to leaders, physicians and APPs. As decisions are made to adapt to the PFS changes and/or incorporate 2022 market data, providers should understand the impetus for change, how it impacts the specialty compensation plan and performance goals, and the benefits and limitations of these actions.
SullivanCotter offers advisory support and solutions to help you navigate the impact of Physician Fee Schedule changes.

INFOGRAPHIC | Split/Shared Billing - Change Management
Addressing the Physician Fee Schedule – Final Rule on Split/Shared Billing
Struggling to understand the recent changes on split/shared billing and how it will affect physician and advanced practice provider workflow?
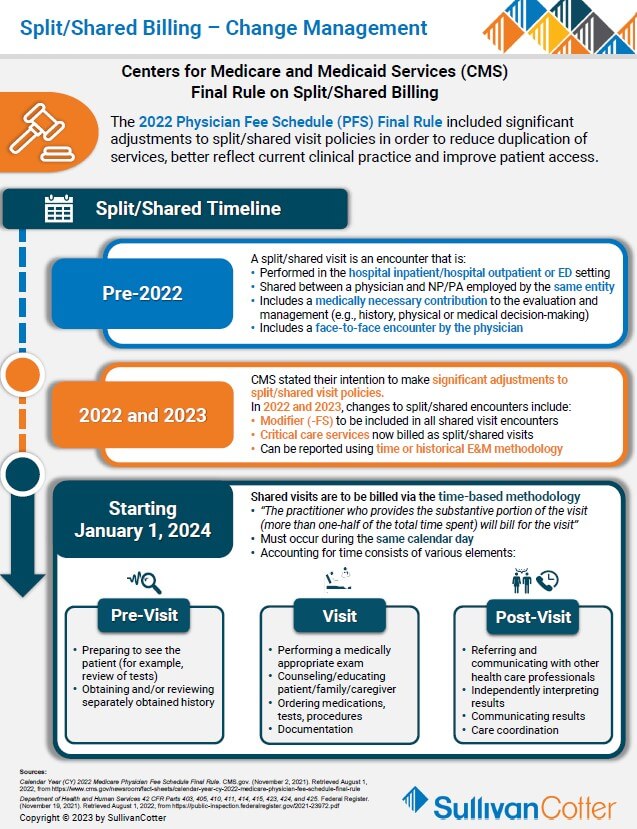
The 2022 Physician Fee Schedule (PFS) Final Rule included significant adjustments to split/shared visit policies in order to:
- Better reflect clinical practice
- Recognize APPs as members of the care team
- Reduce duplication of services (create access)
- Clarify payment conditions
Organizations must understand the timeline of past and upcoming changes in order to properly address and plan for the pending modifications:
Pre-2022
- A split/shared visit is an encounter performed in the hospital inpatient/hospital outpatient setting that is shared between a physician and an APP from the same group practice. Must include a medically necessary contribution to the evaluation and management (e.g., history, physical or medical decision-making) by the physician and a face-to-face encounter by the physician (excludes critical care codes).
2022 and 2023
- Modifier (-FS) to be included in all shared visit encounters
- Critical care services now billed as split/shared visits
- Can be reported using time-based or historical E&M methodology
Starting January 1, 2024
- Shared visits are to be billed via the time-based methodology
- “The practitioner who provides the substantive portion of the visit (more than one-half of the total time spent) will bill for the visit”
- Accounting for time consists of various elements

INFOGRAPHIC | 2022 Workforce Metrics Benchmark Survey
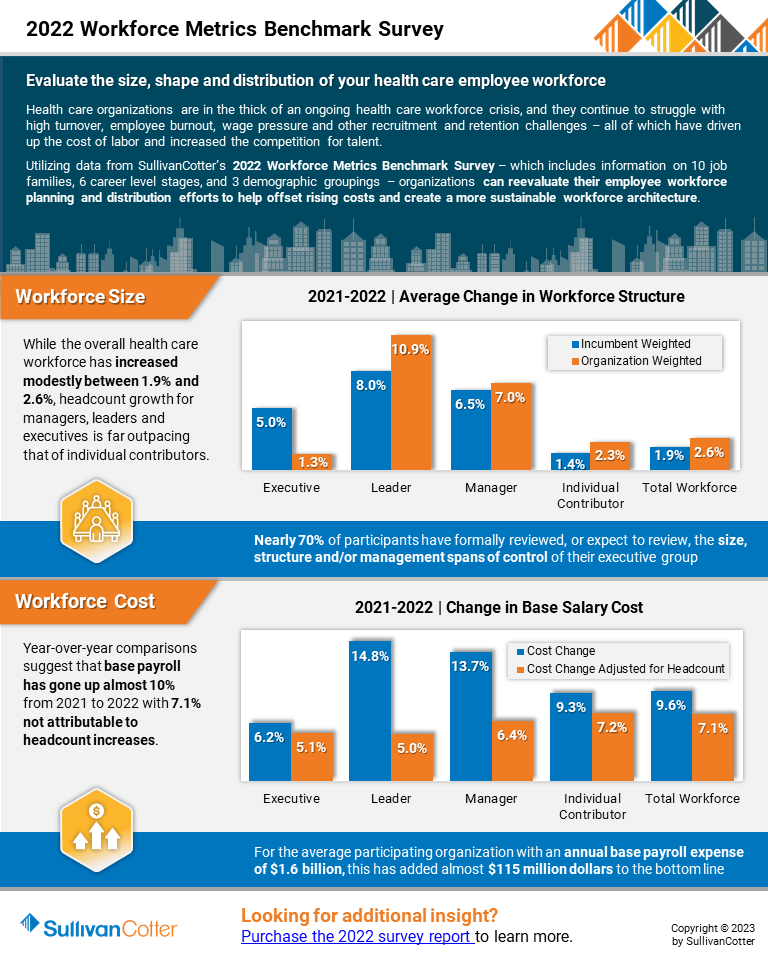
Evaluate the size, shape and distribution of your health care employee workforce
Hospitals and health systems are in the midst of an ongoing workforce crisis
Health care organizations continue to struggle with high turnover, employee burnout, wage pressure and other recruitment and retention challenges – all of which have driven up the cost of labor and increased the competition for talent.
Utilizing data from SullivanCotter’s 2022 Workforce Metrics Benchmark Survey – which includes information on 10 job families, 6 career level stages, and 3 demographic groupings – organizations can reevaluate their employee workforce planning and distribution efforts to help offset rising costs and create a more sustainable workforce architecture.
View a highlight of this year’s results, including insight into:
Workforce Size
- While the overall health care workforce has increased modestly between 1.9% and 2.6%, headcount growth for managers, leaders and executives is far outpacing that of individual contributors.
- Nearly 70% of participants have formally reviewed, or expect to review, the size, structure and/or management spans of control of their executive groups
Workforce Cost
- Year-over-year comparisons suggest that base payroll has gone up almost 10% from 2021 to 2022 with 7.1% not attributable to headcount increases.
- For the average participating organization with an annual base payroll expense of $1.6 billion, this has added almost $115 million dollars to the bottom.
Looking for more? The 2022 survey report is available for purchase.

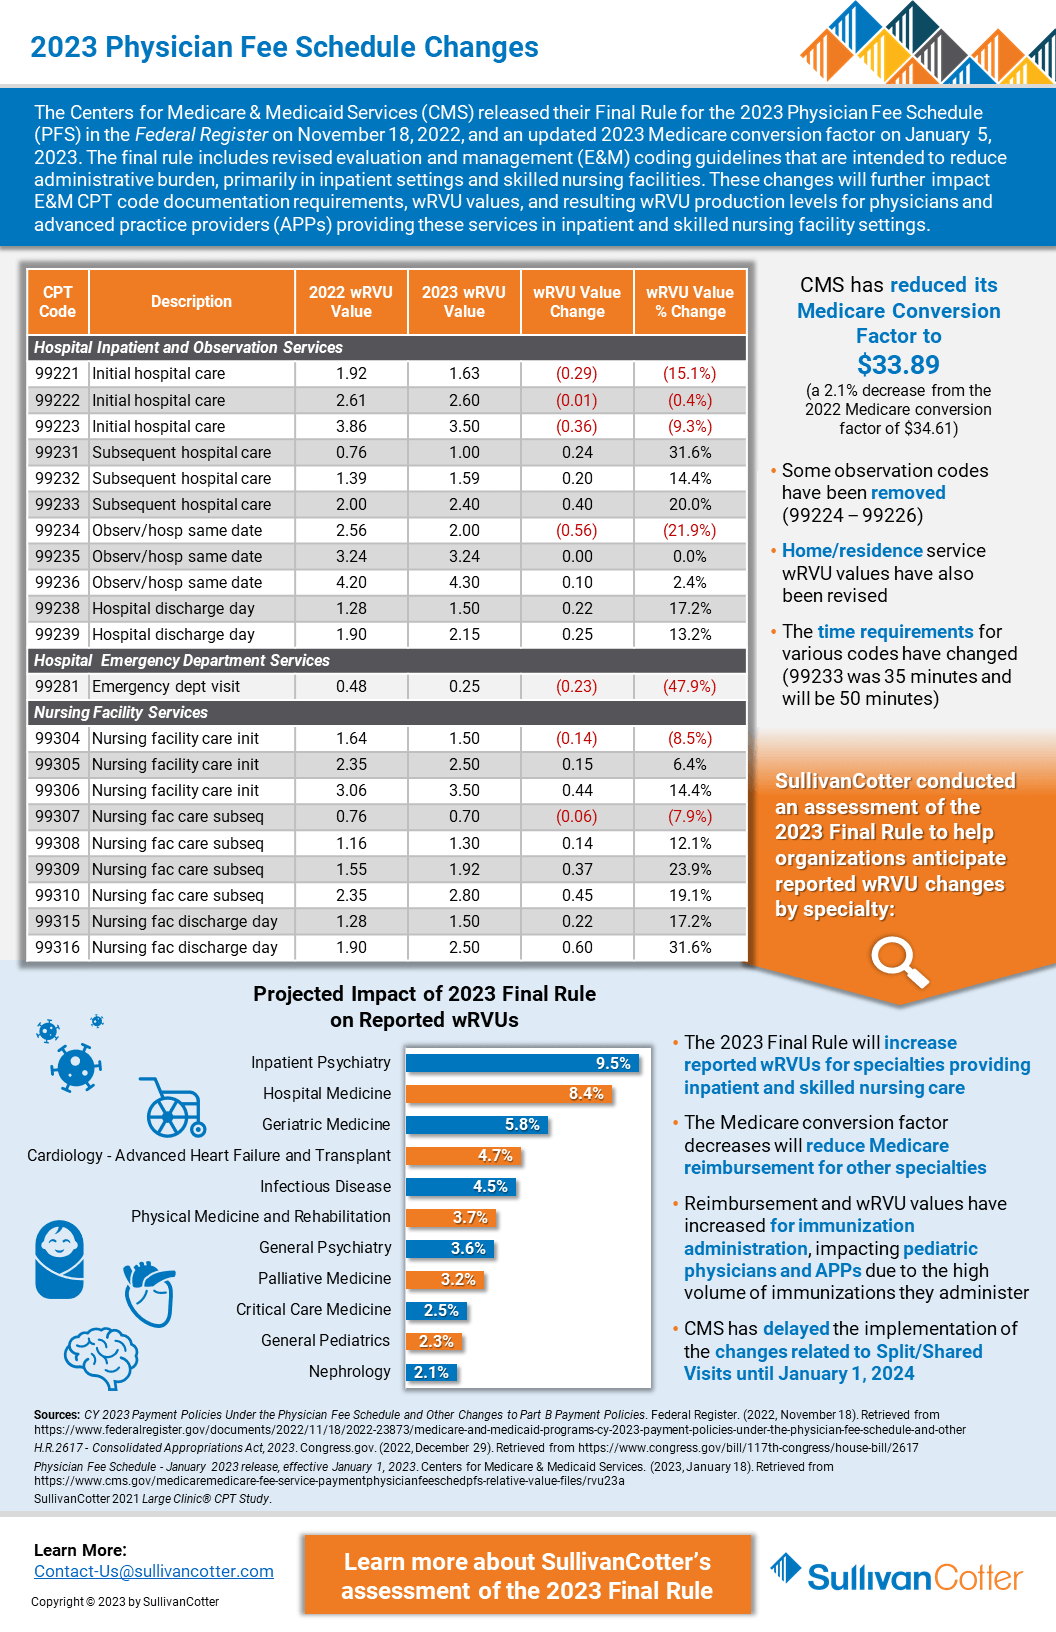
INFOGRAPHIC | 2023 Physician Fee Schedule Changes
The Centers for Medicare and Medicaid Services recently reduced its Conversion Factor by 2.1% for 2023.
Does your organization understand how this may affect wRVU productivity in different specialties and settings – including hospital inpatient and observation, emergency services and skilled nursing facilities?
The Centers for Medicare & Medicaid Services (CMS) released their Final Rule for the 2023 Physician Fee Schedule (PFS) in the Federal Register on November 18, 2022, and an updated 2023 Medicare conversion factor on January 5, 2023.
The final rule includes revised evaluation and management (E&M) coding guidelines that are intended to reduce administrative burden, primarily in inpatient settings and skilled nursing facilities.
These changes will further impact E&M CPT code documentation requirements, wRVU values, and resulting wRVU production levels for physicians and advanced practice providers providing these services in inpatient and skilled nursing facility settings.
Looking for additional details on the changes?
SullivanCotter recently published an article with the American Association of Provider Compensation Professionals.

Physician Fee Schedule: 2023 Changes
Considerations for Production-Based Compensation Plans
Originally published by the American Association of Provider Compensation Professionals
READ FULL ARTICLE
BACKGROUND
The Centers for Medicare and Medicaid Services (CMS) implemented sweeping changes to the Physician Fee Schedule (PFS) in 2021. This included modifications to the office-based Evaluation and Management (E&M) Current Procedural Terminology (CPT) code documentation requirements and Work Relative Value Units (wRVUs) – which had the effect of impacting reimbursement and wRVU production values for nearly every physician specialty. Experience in navigating the impact of these changes to compensation plans, particularly production-based plans, is particularly relevant as CMS embarks upon another set of PFS revisions in 2023.
UNDERSTANDING THE NEXT WAVE
CMS published the Final Rule for the 2023 PFS in the Federal Register on November 18, 2022. This includes the next set of revisions to E&M coding guidelines that are intended to reduce administrative burden, primarily in inpatient settings and skilled nursing facilities. These changes, like those implemented in 2021, will further impact:
- E&M CPT code documentation requirements
- wRVU values
- Reimbursement
- Resulting wRVU production levels for physicians and advanced practice providers (APPs) providing these services in inpatient and skilled nursing facility settings
There are also changes beyond E&M coding and reimbursement which will impact some specialties more than others – such as the increase in reimbursement and wRVU values for immunization administration. This particular change will impact pediatric physicians and APPs due to the high volume of immunizations administered to their patients.
As physician compensation professionals and health systems evaluate modifications to the 2023 Physician Fee Schedule, they must be aware of the impact on Medicare reimbursement and reported wRVUs while also addressing the scope of the changes on provider compensation plans for specialties most likely to be affected.

The Need for Competitive APP Compensation Programs
Advanced practice provider compensation is growing rapidly as organizations face ongoing staff shortages and other health care workforce challenges.
Featured in a recent article from RevCycle Intelligence, data from SullivanCotter’s 2022 APP Compensation and Productivity Survey highlights the need for more dynamic compensation practices for nurse practitioners (NPs), physician assistants (PAs) and certified registered nurse anesthetists (CRNAs).
Attracting and retaining advanced practice providers in today’s unprecedented market for talent – where the demand for care continues to outpace the supply of providers – is now more critical than ever amidst the current health care workforce crisis.
To remain competitive, hospitals and health systems are having to keep up with rapid year-over-year growth in median annual total cash compensation for NPs and PAs. The competition for CRNAs is even greater – with an increase of more than 10% in median TCC since 2019.
How are organizations responding?
- Adjusting base pay for key clinical positions
- Expanding APP salary budgets
- Increasing fixed, merit and market pay
- Exploring flexible staffing arrangements
- Addressing turnover with greater retention bonuses

Rethinking Executive Compensation and Performance Metrics
Achieving True Health Care Transformation
Health care leaders of today must strike a delicate balance that requires managing financial and growth metrics, increasing the speed of transformation, and building the health systems of tomorrow.
So how do we redefine compensation models to reward all these behaviors?
Recently published in MedCity News, SullivanCotter’s President and CEO, Ted Chien, discusses how organizations can adjust their approach to executive compensation to help deliver transformative change:
“Executive compensation might not spring to mind as a key driver of health care transformation, nor does it seem naturally connected to critical issues such as health equity, patient safety, or quality of care – just a few of the areas where significant changes can be made to transform health care. But, in fact, executives leading not-for-profit health systems today are tasked with delivering measurable results that improve the health status of their patients and their communities. And to ensure that these new performance metrics are met, we must change how we think about —and deliver—compensation.”

Hiring Gains Alone Won't Solve the Health Care Workforce Crisis
Health care workforce crisis: the industry cannot rely on hiring alone to address current workforce shortages
Despite recent hiring gains, many health care organizations are still struggling to meet staffing needs.
Health care is in the midst of an ongoing workforce crisis as the demand for care is outpacing the supply of available labor.
Recently featured in NASDAQ, SullivanCotter’s President and CEO, Ted Chien, highlights how hospitals and health systems can meet the challenge of building a better and more sustainable pipeline of talent through:
- Smarter technology: Make the path to care delivery easier for providers by helping to reduce burnout, alleviate after-hours work and streamline clinical experience operations for students
- Resilient teams: Support staff through equitable compensation, robust benefits packages, and a focus on physician and mental health
- Excellence in leadership: Recruit and retain executives capable of delivering change in such extraordinary times

Advanced Practice Providers: Highest Paid Specialties and Regions
Nurse Practitioners and Physician Assistants: Highest Paid Specialties and Regions
Utilizing data from SullivanCotter’s 2022 Advanced Practice Provider Compensation and Productivity Survey, Becker’s Hospital Review has listed the top 20 highest-paid specialties for both nurse practitioners and physician assistants. It has also listed median total cash compensation by region.
This year’s report reflects total cash compensation data from January 1, 2021 – December 31, 2021, and includes information from nearly 700 organizations on more than 100,000 individual APPs.
The survey also provides detailed insight into CRNA compensation and pay practices. As the demand for the anesthesiology workforce continues to increase but provider supply remains flat or even starts to decline, hospitals and health systems are looking to reevaluate their CRNA compensation programs in order to remain competitive and address challenges related to recruitment and retention.

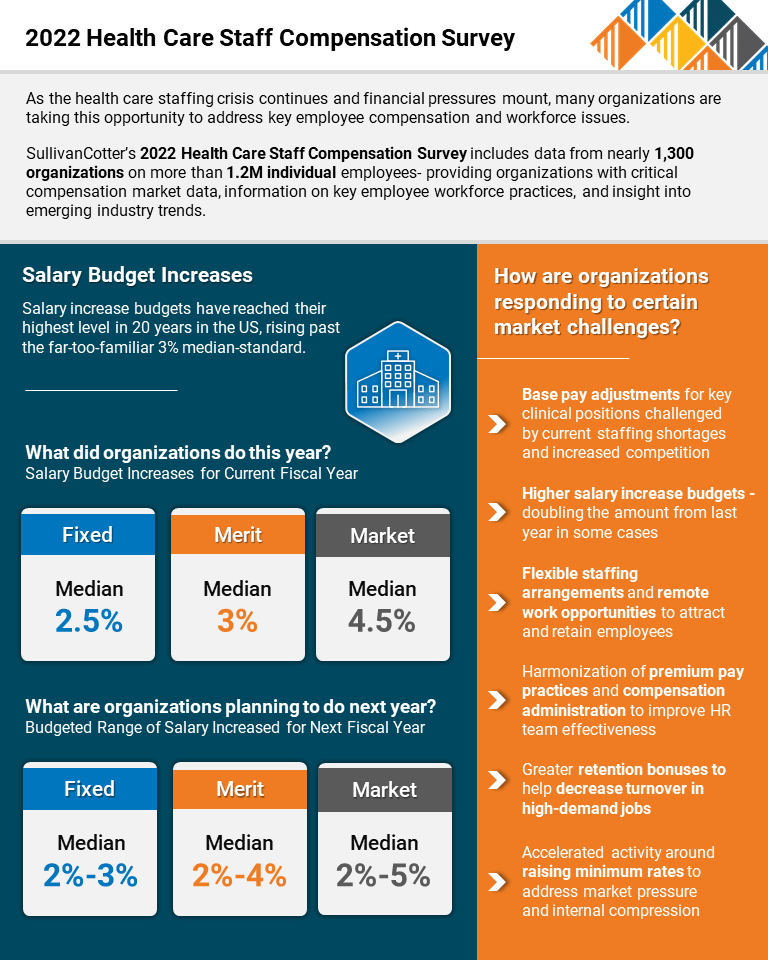
INFOGRAPHIC | 2022 Health Care Staff Compensation Survey
Struggling to address the current health care staffing crisis?
As the health care staffing crisis continues and financial pressures mount, many organizations are taking this opportunity to address key employee compensation and workforce issues:
- The focus on payroll costs remain as health care organizations seek to complete for talent within and outside of the industry – especially for lower-paid, frontline jobs.
- Salary budget increases in 2023 are at a 20-year high as a direct result of the competitive labor market and record-high inflation.
- Although health care organizations have moved to more flexible or hybrid work arrangements, they are not moving to multiple geo-specific pay structures and sticking with a standard headquarters-focused base pay and premium pay approach.
- Minimum rate concerns are increasing for all industries. This adds greater pressure on health care organizations – even amongst those that have recently increased their minimum hiring rates.
SullivanCotter’s 2022 Health Care Staff Compensation Survey includes data from nearly 1,300 organizations on more than 1.2M individual employees- providing organizations with critical compensation market data, information on key employee workforce practices, and insight into emerging industry trends.
The 2023 survey is now open for submission! Register to participate in this year’s survey to gain access to critical compensation market data, information on key employee workforce practices, and insight into emerging industry trends.

PRESS RELEASE | APP Survey Results Highlight Dynamic Market for Talent
Median total cash compensation for physician assistants and nurse practitioners increased by 4.5%
Chicago, IL | December 7, 2022
SullivanCotter, the nation’s leading independent consulting firm in the assessment and development of total rewards programs, workforce solutions, and data products for health care and not-for-profits, has released the findings from its 2022 Advanced Practice Provider Compensation and Productivity Survey.
With median total cash compensation (TCC) up by 4.5% over last year for nurse practitioners (NPs) and physician assistants (PAs) across all major specialty categories – primary care, medical, surgical and hospital-based – this year’s results reflect a dynamic market requiring organizations to develop more competitive approaches to advanced practice provider (APP) compensation. As the health care workforce crisis continues and projected physician shortages remain a concern in this post-COVID environment, APP utilization is increasing as hospitals and health systems look to minimize disruptions to patient access, service and quality of care.
Total Cash Compensation
APP compensation continues to increase year-over-year. While all major specialty areas have seen median TCC — which includes base pay plus performance incentives — grow by over 7.3% or greater since 2019, primary care (up 10.1%) and hospital-based specialties (up 9.1%) have seen the single largest increases over this same period. After several years of minimal growth, TCC for hospital-based specialties increased by 7% from last year alone – likely due to a combination of factors such as changes in work effort, staffing shortages and delayed market increases from 2020 as a result of the pandemic. Although nearly half of organizations (48%) reported utilizing incentives for at least some of their NPs and PAs, it is important to note that this type of compensation as a percentage of base pay ranges from only 4.2% – 6.1% across all specialty categories.
Certified registered nurse anesthetists (CRNAs) have experienced even more rapid TCC growth with the median hourly rate increasing from $86.54 in 2019 to $95.57 (up 10.4%) in 2022 alone. This is driven by a continued shortage of anesthesiology providers as well as a spike in demand as post-pandemic surgical volumes increase and the need for anesthesiology support outside of the traditional operating room rises. Many organizations are experiencing CRNA recruitment and retention challenges, and this is expected to continue during the next three to five years.
“The demand for CRNAs continues to outpace supply, requiring health care organizations to reevaluate their CRNA recruitment and retention strategies in order to ensure effective and sustainable staffing and coverage. A critical cornerstone of these strategies is the establishment of competitive compensation packages and desirable practice environments aligned with evolving CRNA preferences and market trends. We believe the demand and supply mismatch will continue for the next three to five years and organizations should plan accordingly,” said Zachary Hartsell, Principal, SullivanCotter.
Work RVU Productivity
To help organizations assess the ongoing impact of the Centers for Medicare & Medicaid Services’ Physician Fee Schedule (PFS) changes, SullivanCotter includes two sets of benchmarks in the 2022 survey based on work RVU values from both the 2020 and 2021 PFS. The results show the most significant variation within primary care and some medical specialties, while productivity in hospital-based and surgical specialties remains more consistent between the 2020 and 2021 schedules.
Combined median work RVUs for NPs and PAs in 2022 are the highest in primary care at 3,620 (utilizing 2021 PFS) and 3,220 (utilizing 2020 PFS) and the lowest in surgical specialties at 1,812 and 1,725 respectively. “The market data on APP productivity continues to evolve and become more robust. When analyzing this information, however, it’s important for organizations to keep practice variation in mind – this can vary widely based on specialty and organization-specific patterns. While APPs in primary care often practice more independently and may have their own patient panels, surgical APPs spend the majority of their time conducting pre- and post-operation visits or serving as a first assist in the operating room – extremely important roles, but ones that don’t generate as many work RVUs,” said Amy Noecker, Principal and APP Workforce Practice Leader, SullivanCotter.
Planning for 2023 and Beyond
APPs continue to play a critical role in achieving greater patient access, lowering the cost of care and addressing the growing physician shortage. The market for APPs has grown increasingly dynamic and this is expected to continue in the coming years.
As it relates to APP compensation and workforce strategy, organizations should consider the following:
- Plan for pivotal regulatory changes impacting APPs including split/shared billing and additional Physician Fee Schedule modifications to the inpatient E&M codes by enhancing programs that support documentation and coding compliance, formally assessing compensation plan implications, and defining (or redefining) care team responsibilities.
- Support recruitment and retention with the establishment of competitive compensation packages and desirable practice environments focused on improving patient access and top-of-license practice for APPs. Ensure rates are competitive with local and national markets and evaluate care delivery models so that APPs have the appropriate scope of practice.
- Evaluate the effectiveness of alternative care delivery models such as virtual medicine to help address issues with patient access due to staffing and space constraints. Important considerations involving scheduling, staffing, patient demand, variation in state law and overhead costs should all be taken into account.
- Understand how changes in care delivery are affecting hospital-based providers. Due to the pandemic, burnout is on the rise and many APPs in coverage specialties are requesting either an increase in compensation or changes to annual work effort expectations. Many organizations are still short-staffed in these areas and continue to manage limited resources with additional premiums.
- Address current and future anesthesiology care team challenges by regularly assessing physician-to-CRNA staffing ratios, reviewing CRNA and physician deployment and paying special attention to work effort expectations and scheduling preferences.
SullivanCotter’s 2022 Advanced Practice Provider Compensation and Productivity Survey provides critical benchmarking data on compensation levels and pay practices. As one of the most comprehensive resources of its kind for hospitals and health systems nationwide, the survey includes information from nearly 700 organizations representing more than 100,000 individual APPs.
About SullivanCotter
SullivanCotter partners with health care and other not-for-profit organizations to understand what drives performance and improve outcomes through the development and implementation of integrated workforce strategies. Using our time-tested methodologies and industry-leading research and information, we provide data-driven insights, expertise, and data products to help organizations align business strategy and performance objectives – enabling our clients to deliver on their mission, vision and values.
For more information on SullivanCotter’s surveys, please visit our website at www.sullivancotter.com, or contact us via email or by phone at 888.739.7039.
Note to media: Additional data and interviews are available on request.

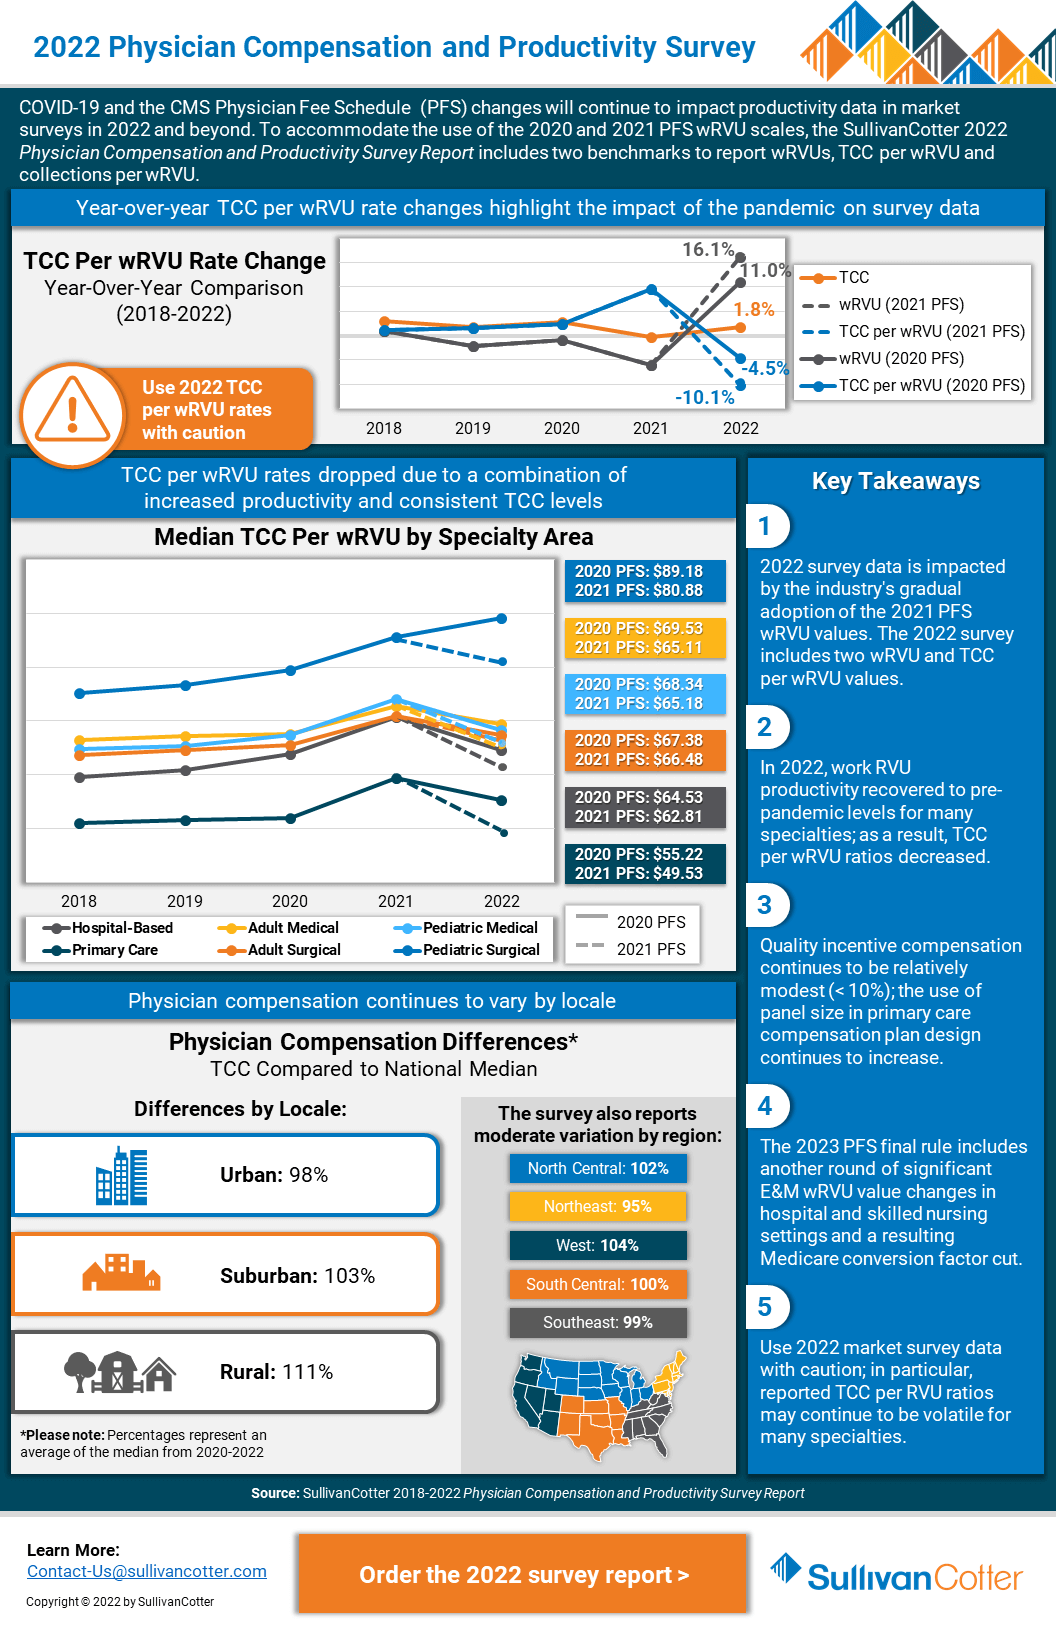
INFOGRAPHIC | 2022 Physician Compensation and Productivity Survey
Physician compensation and productivity survey benchmarks
Looking for greater insight into the impact of Physician Fee Schedule changes on wRVUs?
This year’s survey benchmarks for physician and advanced practice provider (APP) compensation and productivity have been materially impacted by recent modifications to the Physician Fee Schedule (PFS). In order to help organizations properly address the ongoing impact of these changes, SullivanCotter’s 2022 Physician Compensation and Productivity Survey includes two sets of benchmarks based on wRVU values from both the 2020 and 2021 schedules.
As one of the most comprehensive datasets of its kind, this survey includes data from nearly 800 organizations on more than 285,500 individual physicians and APPs across 237 specialties – providing health care organizations with critical compensation market data, information evolving workforce practices, and insight into emerging industry trends.
Key Takeaways
- 2022 survey data is impacted by the industry’s gradual adoption of the 2021 PFS wRVU values. The 2022 survey includes two wRVU and TCC per wRVU values.
- In 2022, work RVU productivity recovered to pre-pandemic levels for many specialties; as a result, TCC per wRVU ratios decreased.
- Quality incentive compensation continues to be relatively modest (< 10%); the use of panel size in primary care compensation plan design continues to increase.
- The 2023 Physician Fee Schedule final rule includes another round of significant E&M wRVU value changes in hospital and skilled nursing settings and a resulting Medicare conversion factor cut.
- Use 2022 market survey data with caution; in particular, reported TCC per RVU ratios may continue to be volatile for many specialties.
Interesting in learning more?
The 2022 report is now available for purchase!

PODCAST | Governing Health - Executive Compensation
Executive Compensation Committee Trends, Developments and Challenges
In this two-part edition of the Governing Health Podcast Series from McDermott Will & Emery, SullivanCotter's Tim Cotter, Managing Director, joins Michael Peregrine and Ralph DeJong to discuss emerging trends and practices in healthcare executive compensation.
Episode 1 >
Listen to Part I to learn more about important key topics for the board's compensation committee, market data from SullivanCotter's 2022 Health Care Management and Executive Compensation Survey, the projected impact of inflation on next year's salary increases and more.
Episode 2 >
Part II of the conversation includes insight into a number of trends and challenges facing the Executive Compensation Committee. This episode addresses considerations for special compensation arrangements, goal-setting for the upcoming year, and responding to media questions regarding executive compensation.
These episodes also include insight into:
- Increasing communication between the compensation committee and the C-Suite
- Addressing pressures felt by executive committee members
- Expectations for future CEO salary increases and organization departures
- The segmented approach to leadership plans
- Performance measures for ESG themes
- Organizational structural considerations and whether or not these should be a committee concern
- Revisiting the committee charter to ensure continued relevance

CRNA Compensation: Supporting Recruitment and Retention
Establishing competitive CRNA compensation packages
Originally published by the American Association of Provider Compensation Professionals
READ FULL ARTICLE
As the demand for the anesthesiology workforce continues to increase but provider supply remains flat or even starts to decline, healthcare organizations will need to reevaluate their CRNA recruitment and retention strategies in order to ensure effective staffing and coverage.
A critical cornerstone of these strategies is the establishment of competitive CRNA compensation packages and desirable practice environments aligned with evolving CRNA preferences and market trends. Insight into emerging compensation and pay practices, access to reliable market data, and close consideration of employment status and work effort expectations will help organizations to attract, retain and engage this increasingly hard-to-recruit workforce more effectively.
In this article, SullivanCotter provides insight into:
- Current CRNA recruitment and retention challenges organizations are experiencing
- Effectively using market data to help determine CRNA compensation - including insight into base salary, incentives, employment status, work effort and premium pay
- Additional considerations such as practice models, location-specific practice patterns and more

PRESS RELEASE | SullivanCotter Holdings, Inc. Expands Subsidiary Organizations with Strategic Leadership Hires
We're pleased to welcome such an accomplished group of leaders
Chicago, IL | November 9, 2022
SullivanCotter Holdings, Inc., the nation’s leading human capital information management holding company for health care and not-for-profits/tax-exempt organizations, announces several important new hires within its Shared Services leadership team.
“As our clients continue to address a growing list of operational, financial and workforce challenges, we’re working diligently to ensure we remain closely in tune with their needs every step of the way. We’re pleased to welcome such an accomplished group of leaders to the organization and look forward to leveraging their unique perspectives, new ways of strategic thinking, and diverse industry backgrounds as we plan for additional consulting services and innovative product enhancements next year and beyond,” said Ted Chien, President and CEO, SullivanCotter and Clinician Nexus.
New additions to the firms’ leadership teams include:
- Gina Alexander | Chief Financial and Administrative Officer – With nearly 20 years of healthcare finance and administrative experience, Gina has a deep-seated knowledge and well-rounded understanding of the industry’s major players – including providers, payers, employers and the government. She leads the transformation of the organization’s Shared Services functions in supporting new advisory and technology services to drive greater value for clients.
- Mike Erickson | Chief Technology Officer – As a dynamic technology executive with a proven track record for leading high-performing teams as they solve complex business and operational issues, Mike leverages expertise in software architecture, development and implementation to deliver new products and resources to our associates and clients as they look to grow and scale in a rapidly changing marketplace.
- Tim Goertel | Chief Marketing Officer – With a critical focus on enhancing client acquisition, retention and advocacy, Tim works cross-functionally with our consulting practices and product teams to ensure clients continue to receive best-in-class advisory services, technology solutions and workforce compensation and performance data.
- Sue Roeser | Chief Human Resources Officer – Committed to fostering a supportive and positive workplace where employee wellbeing, development and learning is a top priority, Sue is an accomplished HR executive who leads a number of strategic initiatives designed to enhance talent management, organizational culture and employee experience.
- Rachel Wilson | General Counsel – With more than 20 years of experience as a practicing lawyer, Rachel has advised some of the biggest names in health care on complex technology and commercial transactions. In her role, Rachel provides leadership with support and strategic counsel on a range of legal matters such as compliance, contracting, data use and sharing arrangements, intellectual property and more.
To learn more about SullivanCotter or Clinician Nexus, please visit us online or contact us via phone or email for more information:
- SullivanCotter, contact-us@sullivancotter.com, 888.739.7039
- Clinician Nexus, info@cliniciannexus.com, 888.254.3503
About SullivanCotter
SullivanCotter partners with healthcare and other not-for-profit organizations to understand what drives performance and improve outcomes through the development and implementation of integrated workforce strategies. Using our time-tested methodologies and industry-leading research and information, we provide data-driven insights, expertise and data products to help organizations align business strategy and performance objectives – enabling our clients to deliver on their mission, vision and values.
About Clinician Nexus
Clinician Nexus enables health care organizations to build thriving clinician teams with industry-leading technology products, workforce and compensation analytics, and automated workflow solutions. Backed by extensive technical expertise and industry-leading data, we deliver innovative approaches to help clients to plan, educate, and engage their clinical workforce at every stage of the lifecycle. We are committed to providing our clients with outstanding guidance and support as they focus on shaping the future of health care.