
Infographic: Executive Incentive Plan Design in Pediatric Organizations
As health care continues to evolve, pediatric hospitals and health systems face a unique set of challenges in the way they recruit, engage and retain key executive talent.
Adapting to industry transformation and aligning executive incentive plan design and reward strategies with both the organization's annual and long-term goals is critical, and requires a close review of health care industry norms and best practices.
With over 1,800 participating health care organizations and data on nearly 27,000 individual managers and executives, SullivanCotter’s Manager and Executive Compensation in Hospitals and Health Systems Survey is the largest and most comprehensive of its kind.
Combined with the Manager and Executive Compensation in Children’s Hospitals Survey, SullivanCotter offers unique insight into executive compensation and pay practices in pediatric organizations nationwide.
Learn more about SullivanCotter's Manager and Executive Compensation in Hospitals and Health Systems Survey.

SullivanCotter Welcomes Terry Pflager as Chief Operating Officer
 May 16, 2017 - Minneapolis - SullivanCotter, the nation's leading independent consulting firm in the assessment and development of total rewards programs and workforce solutions for the health care industry and not-for-profit sector, announces the addition of Terry Pflager, Chief Operating Officer, to the firm's growing leadership team.
"We continue to look for better ways to help our clients address an increasingly diverse set of strategic and operational challenges, and Terry's addition to the firm will be a tremendous asset to the organizations we advise. As we continue to grow, he will play a vital role in expanding our service lines and consulting resources, developing our associates and scaling our operations to deliver long-term, sustainable value to clients," said Ted Chien, President and CEO, SullivanCotter.
With over 30 years of health care consulting and human resources management experience, Terry has served as a key advisor to a number of large employers – including many Fortune 500 companies and health care organizations. He has a unique background in leading large and operationally complex organizations through transformational change, and specializes in driving market growth, enhancing client satisfaction, managing associate development activities and improving operational efficiency.
Terry joins SullivanCotter from Willis Towers Watson, where he served as the Market Leader for Kansas and Missouri and was responsible for managing nearly 200 associates and overseeing operations in both markets. He was also a longstanding member of the firm's leadership team and played a key role in the Willis Towers Watson integration following the 2016 merger.
About SullivanCotter
SullivanCotter is the leading independent consulting firm in the assessment and development of performance-based total rewards programs and workforce solutions for the health care industry and not-for-profit sector. For 25 years, the firm has provided unbiased advice to executives and boards to help attract, retain and motivate executives, physicians, advanced practice clinicians and employees at all levels. Through the Center for Information, Analytics and Insights, SullivanCotter has developed the most widely recognized compensation surveys in the United States. Combining data-driven intelligence with national insights, we act with integrity to help organizations fulfill their missions, business objectives and regulatory requirements.
SullivanCotter Expands Advanced Practice Provider Advisory Services
April 24, 2017
MINNEAPOLIS--(BUSINESS WIRE)--SullivanCotter, the leading independent consulting firm in the assessment and development of performance-based total rewards programs and workforce solutions for the health care industry and not-for-profit sector, is pleased to announce the expansion of the firm’s advanced practice provider (APP) consulting services. APPs remain one of the fastest growing segments of the health care workforce and, as the demand continues to escalate, SullivanCotter’s APP Workforce Practice helps organizations develop strategies to integrate, optimize and engage this increasingly important provider group.
“The role of APPs in transforming care delivery is critical as health care evolves and the focus on team-based care intensifies. Hospitals and health systems nationwide seek to drive better performance as the industry transitions from volume- to value-based care, and this expansion of our APP workforce consulting services enhances our ability to help clients meet the strategic goals of improving access, quality, service and affordability,” said Ted Chien, President and CEO, SullivanCotter.
Combining a data-driven approach with 25 years of industry insight, SullivanCotter works closely with clients to assess clinical operations and develop enhanced models of care, leadership structures, engagement strategies and the supporting compensation programs to ensure that physicians and APPs work efficiently and effectively. The firm also helps clients improve the structure of their APP workforce programs and support top-of-license practice as they look for ways to maximize APP utilization and optimize and engage their entire provider team.
In January, SullivanCotter acquired the Illinois Health and Hospital Association’s (IHA) Advisory Services business line. Trish Anen, former Vice President of Advisory Services and founder of the Center for Advancing Provider Practices (CAP2TM), now co-leads the APP Workforce Practice alongside Kay Jensen. Both are Principals at the firm and have more than 20 years of experience in helping health care organizations design and implement workforce strategies that align with business imperatives.
Amy Noecker, Principal, and Zachary Hartsell, Principal, have also recently joined the firm and bring specialized expertise in clinical operations and improving APP utilization to enhance both patient and provider satisfaction.

General Industry Influence on Executive Compensation in Not-for-Profit Health Care
In today's ever-changing health care environment, the influence of general industry pay practices in not-for-profit (NFP) health care continues to grow as the market for executive talent expands beyond traditional NFP peers.
In the March issue of The Governance Institute's E-Briefings, SullivanCotter's Jose Pagoaga, Managing Principal, and John Collins, Principal, discuss the implications for executive compensation and its oversight as hospitals and health systems increasingly compete with for-profit (FP) organizations for executive talent.
This includes a comparison of NFP and FP pay practices as well as careful consideration regarding when to incorporate FP organizations into the peer group.

Podcast: Health Care Executive Compensation Trends
Establishing CEO compensation is a complex and highly regulated exercise that can send a strong message about an organization’s culture and goals.
Michael Peregrine, Partner, of law firm McDermott Will & Emery hosts a wide-ranging discussion of this boardroom concern as it continues to evolve. This podcast features two of the leading voices on executive compensation trends and practices in health care: Ralph DeJong, Partner, McDermott Will & Emery and Tim Cotter, Chairman and Managing Director, SullivanCotter.
Transcript
Governing Health Podcast Series: Episode Two - Executive Compensation Trends: A Board Update
Date: February 21, 2017
Executive Sponsor: Stephen Bernstein, Partner, McDermott Will & Emery
Host: Michael Peregrine, Partner, McDermott Will & Emery
Presenters: Ralph DeJong, Partner, McDermott Will & Emery and Tim Cotter, Chairman and Managing Director, Sullivan, Cotter and Associates
Stephen: Hi, I'm Stephen Bernstein, global chair of McDermott's Health Industry Practice Group. I'm pleased to present our monthly podcast Governing Health, geared towards director education. The goal of this series is to supplement the education that directors receive in the boardroom by providing them with concise updates on leading developments and engaging conversations with industry guests that relate to the exercise of their fiduciary duties. On behalf of the Health Industry Practice Group at McDermott, it’s a pleasure to have you join us.
Michael: Hello again and welcome, I'm your host Michael Peregrine. We’re pleased you're with us. Today's conversation focuses on one of the most fundamental of all Board responsibilities: establishing the compensation of executives. Executive compensation programs are complex. They're highly regulated, require heightened engagement, and demand specialized expertise. They send important messages about corporate culture, expectations, and goals. They’re voraciously covered by the media. So today we're going to explore this key governance duty with two industry experts.
First is my good friend Tim Cotter, Managing Director of Sullivan, Cotter and Associates. Tim is, in my experience, the most recognized name in health care executive compensation consulting. We also have my longtime partner and friend Ralph DeJong, who is exquisitely expert in the law of executive compensation in the health care industry.
Before we turn to Tim and Ralph, let's revisit for a second our conversation last month about Board attentiveness to health care policy, for as we've seen, a lot can happen in 31 days and health care directors must be alert to the implications of broader political and economic volatility. Can issues like border security, immigration restraints, trade conflict, fiduciary rules, regulatory reform, and market fluctuation affect the health system? Would a Dodd-Frank rollback have spillover effects? Could Administration pressures on key industries expand to include health care? Will the new Supreme Court justice influence upcoming health care related cases? These are all potential enterprise risks. But remember, it's not political, it's strictly business.
I'm joined now by Tim Cotter of Sullivan, Cotter and Associates and Ralph DeJong of McDermott Will & Emery, who will share with us their perspectives on executive compensation trends and practices. So, Ralph DeJong, Tim Cotter, welcome to Governing Health.
Ralph: Good to be with you Michael.
Tim: Thank you Michael, I'm delighted to join you and Ralph.
Michael: Tim let's start with you. I think the number one question our listeners are interested in is: What's the rate of compensation? What are you seeing as trends and data in terms of compensation increases right now?
Tim: Well thank you Michael, I'm delighted to join you and Ralph. As I give you that information, my comments on market practice are primarily those focused on not-for-profit health systems, and typically those with revenues greater than $1.0 billion. In 2016, the actual increase in total direct compensation (so that would be the combination of base salaries, annual incentives, and long-term incentives) was roughly 4% at the median, 5.5% at the average, and 7% at the 75th percentile for integrated delivery system executives. Clearly when you look at the reported rates of increases for non-executive individuals, around 3%, maybe 2.5% in some markets, these increases are above those that are seen in other parts of the health care workforce. But we do expect that they're going to be above normal increases for 2017, as well. When you look at the system-owned hospital, so the operating business units, total direct compensation there moved at a much more modest pace for those executives; approximately 3% at the 50th, and 4% at the 75th.
Michael: And why is that?
Tim: Well, I think there are there are several things at the system level. The first is, as we read the industry reports, the merger and acquisition activity that's going on, which leads to larger health systems and more complex health systems. Secondly, health systems are growing the size and scope of their executive roles; the executive roles are changing. Finally, in this period of dynamic change, there's demand for key talent and significant retention concerns; all of which are causing not-for-profit health systems to be more generous in compensation levels for their key folks
Michael: Tim when you look at total direct compensation and total cash compensation, when you include the incentive compensation element, and how that's growing at a rate that's faster than base salary, and faster than the general employee workforce; is that an indication that it's really performance-based pay that's increasing pretty rapidly? I think when we're advising Compensation Committees of tax-exempt health care organizations we’re observing that performance-related pay has gotten stronger, tougher, and with a greater opportunity, and in recent years the performance has been fairly strong. Do you think that would account for the greater increase at total direct compensation and total cash compensation, especially at the 75th percentile?
Tim: I think that's a partial explanation. First off, the performance levels of health systems, as they report at what level they're paying incentive awards are certainly above target, so we do have a performance explanation there. Secondly, as we will talk about later in this discussion, we're seeing the greater use of long-term incentive plans. So an additional element of cash compensation is being introduced, and so I think from a performance point-of-view, those are two explanations. But on the other side, as we look at health systems that are merging, and they
double in size, Compensation Committees are repositioning the pay lines to take into account the larger organizations that executives are managing because executive compensation is highly correlated with the size of the organization. Secondly, the intense competition to attract and retain key executive talent. And then finally, the dynamics and pressures of maintaining stability in executive populations, I think, are performance-related, but they aren't quite the incentive-related type explanation that the first part of your question would address.
Michael: Those are really great factors because it's been such a fluid time for the health care industry in the last couple years, given the consolidation that's occurred, the revenue pressures, the uncertainty with the Affordable Care Act (first, how it was being implemented, and now whether it will survive at all) that we're seeing reflected in executive compensation, and the need for defining and retaining and motivating the most important talent within the organization. So that's pretty reflective of that broader trend.
Michael: Tim, I guess one question a lot of our listeners are used to seeing is working with single peer groups. Is that continuing? Are you advising clients to expand their review to multiple peer groups, broader constituencies, what do you see?
Tim: Well, I think that the change in the marketplace is forcing health systems, as they become more diverse and complex, and as their talent markets extend beyond those of just the other health systems, we see health systems monitoring additional talent markets. So for example, what might those talent markets be? Well, the first are for-profit general industry talent markets, and those would be for executive roles that exists outside of health care – so the chief human resources officer, the chief information officer, supply chain, chief legal officer. We also see, as hospitals focus on innovation, taking a look at business development roles. We see a focus on for-profit insurance companies, as health systems get into the business of running health plans. While other not-for-profit health system have health plans, typically the marketplace for those kinds of skills are the for-profit insurance companies.
Stephen: Let's pivot for a moment to our regular short segment, “What's Trending Now” when we try and flag a new governance issue we see on the horizon and today that's most certainly the potential for tightened conflicts policies, given the daily headlines. This unceasing media coverage is increasing the conflict sensitivity of corporate governance stakeholders at every level, and that includes directors, shareholders, transaction partners, regulators, and the courts – not to mention the media, corporate watchdog groups, and social activists. Only the most disengaged of observers could have missed it. So, going forward, Boards may need to be looking, not just across the street, but down the block, around the next corner, and beyond the horizon, when it comes to identifying, evaluating, and managing approved conflicts of interest. And now back to Tim and Ralph.
Michael: Ralph, do you have an issue when you're called upon to support these different peer groups with regulators? Is that a tough sell?
Ralph: Well, we have to remember that the IRS has given express permission to use for-profit data in analyzing the reasonableness of an exempt organization’s executive compensation. That is an appropriate source of data. But I think what's important for Compensation Committees to remember is that to get the rebuttable presumption of reasonableness under federal tax law, the highest protection that's available to support the reasonableness of compensation, one of the steps that's important to satisfy is to document the rationale for the independent approval of compensation that occurs when compensation is outside the range of market data. If for-profit data, or innovative additional sources of data to which Tim just referred, if those are being used to support compensation – perhaps for novel positions, new kinds of positions that are occurring, or positions that are more akin to the for-profit world – it's incumbent on the Compensation Committee to document the reasons why it believed, as the independent approval body, that compensation was reasonable.
Michael: When do you see problems occurring in this area? What's a red flag to you?
Ralph: The biggest problem I see is not the exercise of the Committee's independent business judgment – that is usually performed very well. It's when the rationale, the very valid rationale, that Committees frequently use to support reasonableness doesn't end up in the written record of its deliberations and decisions.
Tim: Michael, I would add the following observation, which is that we also have to be very careful about what the structure of for-profit compensation is versus not-for-profit. So if you look at a not-for-profit health system executive, the majority of compensation is fixed compensation, base salary and deferred compensation. When you look at the for-profit executive, and the higher compensation levels that exist, those are all driven by long-term performance vehicles and those are all performance-based. So while the compensation looks to be higher, there's a big risk component there that I think needs to be taken into account when we compare to and use such information.
Michael: That actually goes to my next question to both you guys – the question of the volatility of the market right now and the traditional use of incentive compensation to drive particular cultural and mission goals. What are you seeing as the direction, Tim, in terms of incentive compensation going forward with the whole business model of systems kind of up in the air right now?
Tim: Well clearly, if you look at the market data, the direction is greater movement toward incentives. If we look at annual plans, nearly 90% of not-for-profit health systems have an annual incentive plan. If we look at long-term, they're beginning to grow. And, when we look at the largest not-for-profit health systems (in a category of $3.0 billion and over) we're running 50%-60% of those now have long-term incentive plans. So clearly the market is moving toward the use of incentives. But I will observe that several of the leading and high-performing health systems in the United States have a policy of using base salaries only. So there's clearly much for a Committee to discuss in that context.
Michael: Let me turn to Ralph, because Ralph I guess one of the questions is, as you are drafting an employment agreement that has incentive goals, what's the shelf life of that right now? If we see a dramatic change in the health insurance market within the next year, what should the Committee be thinking about in terms of the validity of the current types of incentives for their senior executives?
Ralph: That has a lot of implications to it, so I really appreciate that question. One implication is that even annual incentive plans can get out of step with the organization, out of step with the opportunities and crises that will exist during the coming year. As a result, when you get to the end of the year, often an organization will say: Our incentive plan isn't truly reflective of the kind of year that we had, and the kind of things that we asked our executive leadership to tackle. They had a good year, but it's not really reflected in these metrics that we've been tracking, and at the end that we've used to calculate incentive pay. So, oftentimes Committees have to use their judgment at the end of the year to ask: Is this really reflective of the year that we had? Were these goals sufficiently rigorous? Were they understandable and achievable? Should we do something different, or additional, to recognize, reward and keep the true star talent that we have leading this organization? And as a result, we often see Committees considering modifications or enhancements or ad-hoc performance bonuses when the year is done.
Michael: Tim, do you see the need for Committees to kind of place on the calendar three months, six months, nine months – you pick a date in the future – the possibility that they'll have to restructure these incentives to respond to whatever the ultimate fix to the Affordable Care Act is passed?
Tim: I think it's a good practice to, halfway through the performance period, sit down and look, even in a relatively stable market, to look if there any environmental factors or internal factors that are impacting the performance measures and standards that have been set, and I think it becomes increasingly important in this very dynamic period we have now to do that. In my experience, good Compensation Committees periodically monitor and assess the utility of the performance measures and standards that they have established.
Michael: Before we leave this subject of incentive compensation, which I think is just fascinating, let me ask Ralph, in the broader corporate world, over the last six months, there have been significant, what we call, compliance controversies with respect to the implications of incentive compensation that were driving what are alleged to be improper goals or that there was a failure to link the executive compensation incentives to those of the organizational culture. Are people revisiting the role and function of some of these incentive compensation challenges with the Compensation Committee now? Are there lessons learned from some of these challenges in the financial services industry?
Ralph: That's a great question because it gets to one of the issues that we wrestle with in advising Compensation Committees, and that is staking out the appropriate role and scope of the Committee's oversight role. We want to make sure that the Committee is engaged in governance and oversight, but not in management. So, the Committee's role is not to come up with the incentives and to do that micro-incentive management that we look to executive management to conduct. But it’s to determine the rigor of those goals, to make sure that when the goals are calculated and incentive awards are provided, that those are aligned with the mission of the organization, that they are consistent with the organization's executive philosophy, that they meet and are aligned with the organization's strategic plan, and that they're consistent with the organization's values. When the Committee confines itself to issues of reasonableness of pay, alignment with strategy, consistency with the compensation philosophy, that frames the appropriate role of the Committee, I believe.
Michael: But let me just confirm this because our Compensation Committee members are reading the papers. Should they be asking the question, stepping back from the numbers, stepping back from the actual goals, and saying: Does this work? Is it the Committee's responsibility to ask management, or to ask the question: Do these incentives align with overall corporate and cultural goals, or is that really the responsibility of management?
Ralph: I believe that's a dialogue between governance and management. It's certainly appropriate, just as governance and management, together, work on the strategic plan for the organization and how that gets carried out, so that it boils down to things like – annual and long-term incentive compensation arrangements – and it's appropriate for the Committee and management to have a dialogue about how we're using things like our compensation structure to achieve the important elements of the organization's strategic plan, to enhance the organization's culture, to satisfy the organization's mission, and to be consistent with the organization's values.
Michael: Tim, let’s pivot for a little bit and look at the bigger picture and draw on your experience. What are you seeing Committees do to enhance their ability to exercise oversight over compensation decisions?
Tim: Well one of the things, Michael, that we're seeing is Compensation Committees beginning to develop scorecards that go over multiple years. Looking at outcomes, both programmatic outcomes as well as executive outcomes. So, for example, we see people monitoring what's the age distribution of our executives? What are measures of executive diversity and gender equity? I can tell you those two are major topics on the minds of most of the Compensation Committees. You want to have data year-after-year that look at the ratios of whites and non-whites, look at male and female, but also look at the compensation differences in those vis-a-vis target market position. I think in this regard, focus on cost and the concern that do we have too many executives by monitoring, over time, the number of executives we have: How is that growing or shrinking? What our executive payroll is, as a percentage of our expenses or our net operating revenue? How's that changing over time? What do our market positions look like over time? And by looking at these things, in addition to our annual process of making sure that the compensation is competitive and reasonable, we take a little broader look and make sure that other important outcomes that are supported by the executive compensation program are being achieved. So that, to me Michael, is one of the bigger activities I see Compensation Committees beginning to take a look at.
Michael: Tim, I think this is consistent with a trend that we've seen in working with Compensation Committees, and that's the growing sophistication of these Committees, and the growing awareness that it's more than merely looking at annual compensation market data. Committees frequently are asking: What do we need to do to make sure we're not out-of-bounds? Show us more ways to compare ourselves to our peers; and, as you've described, there are numerous possible ways of doing that. So one of my questions, Tim, is: Are some of those scorecard approaches that you've just listed more useful, or more available, than others? Some of those might just be that we wish such a metric were available. Are some of these really, in your experience, more useful than others?
Tim: Well I think it's going to be dependent on Committee need and perspective. I think the area where Committees are most interested is where the data are most weak are: What are we spending on our executive population versus what our competitors are spending? Also, how many executives are they using versus what we're using? That information is difficult to get. Some of the other information, though, in terms of outcomes – and so again, I’m a heavily focused today on diversity and gender equity – those data are easily assembled and are really critical pieces of information in the minds of most Committees today. The number of people who voluntarily resigned is something we can easily track, and then link back to our compensation. Ratios of our executive expenditures to measures of operating revenue. But again I would say the one answer that I think most organizations would like to know is: How do our executive expenditures compare to others? That's often a challenge putting that together.
Michael: Fellas, before we wrap things up, let's put ourselves in the boardroom. The Committee meeting is coming to a close, people are putting their papers away, and they're moving away from their chairs and they turn to you and the Chairman asks: Ralph, Tim, you’ve got 30 seconds – what is the number one issue each of you want these Committee member to think about before the next meeting?
Ralph: I would encourage the Committee to focus on the issue of asking management: Do you have all the tools that you need to appropriately reward, recruit, retain, your key executive talent; the most important executive leaders of this organization? And then I would encourage the Committee to do everything it can to document clearly, thoroughly, contemporaneously, the decisions that it makes and the rationale for those decisions in that regard.
Tim: I am supportive of Ralph’s suggestions. For me, it's moving over one step. I think it's the Committee stepping back and making sure it's comfortable with the compensation levels that it's offering, in the environment of scrutiny and criticism that we're facing today on executive compensation levels. As I look at the data, compensation levels are continuing to move at a faster than normal pace. We are facing attraction and retention issues that are embedded in trying to address and thrive in this dynamic market. And I think our Committees have to be comfortable that we're going to have to continue to evolve our programs, continue to use unique devices – retention incentives, carried interest plans for those in our innovations businesses, as two examples – and that these, again, are likely to lead to continuing fast-moving compensation. We need to be comfortable that we can make such decisions and then to defend them, both from a regulatory point of view, but more importantly to the public, and to defend our reputation.
Michael: Ralph, Tim, that was terrific. Thanks so much for joining us on Governing Health.
Ralph: Thank you good to be with you.
Tim: I appreciate the opportunity Michael.
Michael: Thanks again. As Tim and Ralph have just told us: executive compensation is absolutely an evolving and complex Board concern. In so many ways that offers a tremendous opportunity for the attentive director to make a meaningful difference on behalf of the health system. Whether through the Compensation Committee itself, or through the oversight and commentary of the full Board.
By the way, a written summary of Tim and Ralphs thoughts will be available through your General Counsel, as we sent a copy ahead of this link.
Thanks so much for joining us for today's episode of Governing Health. Be sure to subscribe to the full complimentary podcast series. You can find us on iTunes, Pocket Casts, SoundCloud, and YouTube. There you'll be able to stay up-to-date with all of our future episodes and re-listen to the old. Until next time I'm your host Michael Peregrine.

Emerging Roles in Value-Based Health Care
In the September/October issue of ACHE's Healthcare Executive magazine, SullivanCotter's Jim Rohan, Managing Director and Chris Brandt, Director of The Center for Information, Analytics and Insights, discuss the changes taking place in health care today and how those changes are impacting the executive talent market. As the focus on population health management, patient experience, provider alignment and more continues to grow, new positions and restructured compensation packages are emerging - requiring health care executives to assess their careers and determine where they can add value to the new health care marketplace.

Infographic | Provider Performance Incentive Compensation
As the health care industry adapts to new payment and care delivery models, value-based compensation is becoming increasingly more complex. With data reported from nearly 50 participating organizations, the following highlights from SullivanCotter's 2015 Provider Performance Incentive Survey offer unique insight into emerging performance trends, quality measures and incentive design practices.
Learn more about our Provider Performance Incentive Survey.


Infographic: Physician On-Call Pay
Trends in On-Call Coverage and Pay Practices
With nearly 170 participating organizations providing information on more than 1,300 individual call panels, the Physician On-Call Pay Survey provides hospitals and health systems with the data they need to address complex call pay issues related to contract negotiations, fair market value, strategic call pay design and more.
Lear more about SullivanCotter's Physician On-Call Pay Survey.


Executive Compensation: Pay for Performance Takes on New Meaning
Featuring data from SullivanCotter's 2016 Manager and Executive Compensation in Hospitals and Health Systems Survey and industry insights from Meg Garrison, Managing Director, and Tom Pavlik, Managing Principal, Modern Healthcare has published its annual executive compensation analysis. In this year's article, entitled "Executive Compensation: Pay for performance takes on new meaning", author Joseph Conn examines how health care executive compensation continues to increase as the principles of value-based health care take hold.

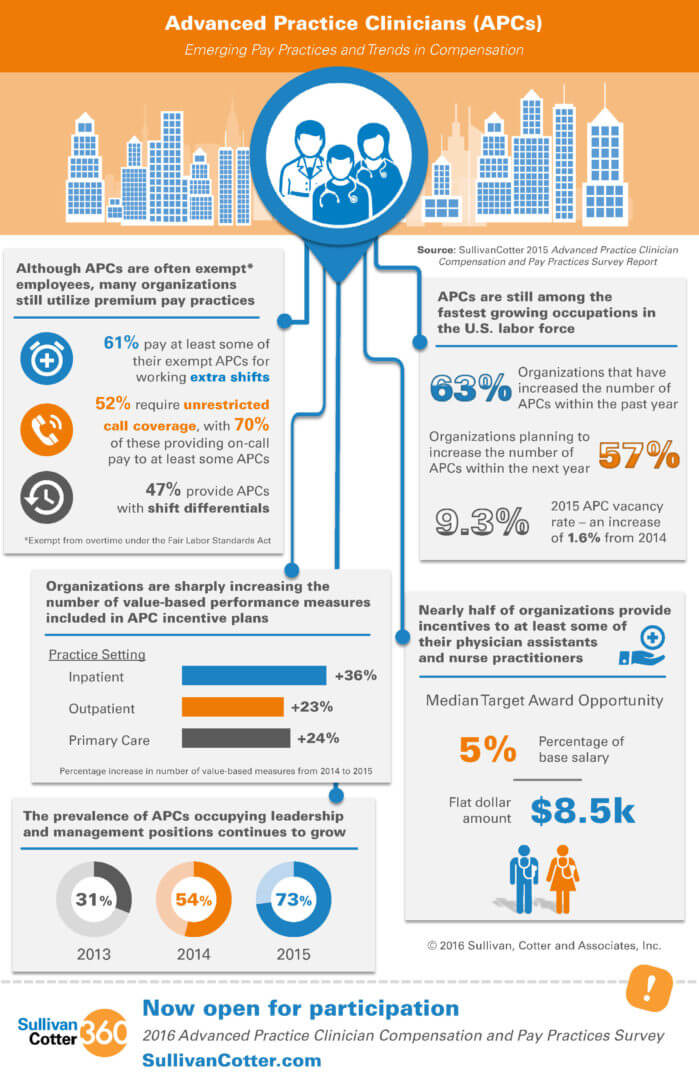
Infographic: Advanced Practice Provider Compensation
Emerging Pay Practices and Trends in Compensation
The demand for advanced practice providers (APP) continues to grow as health care organizations focus more on population health, access, quality and cost-effective care. In order to benchmark and assess pay practices for this increasingly important provider group, organizations require critical compensation and incentive data on physician assistants, nurse practitioners and other APPs.
The infographic below highlights data from our 2015 Advanced Practice Provider Compensation and Pay Practices Survey and provides insight into emerging pay practices and trends in compensation.
Learn more about our Advanced Practice Provider Provider and Pay Practices Survey.

The Emerging Role of the Advanced Practice Provider Leader/Manager
Since the inception of our Advanced Practice Provider and Pay Practices Survey in 2012, SullivanCotter (SullivanCotter) has seen a 10 percent average increase in the number of advanced practice providers (APP) added to the workforce every year.
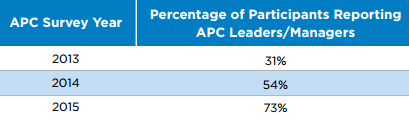
As this workforce has grown, health care organizations have recognized a need to provide leadership for this unique provider group to ensure effective alignment with other members of the care delivery team. While APPs may still report up through a variety of roles, as noted in the table below, an increasing number of organizations have created new leadership/management positions specific to APCs:

Nearly three-quarters of the 158 organizations in our 2015 survey reported that some of their APPs serve in leader/manager roles, with “lead” being the primary designation (49 percent).
However, over 70 percent of organizations reported having an APP in a leader/manager role with the title of vice president, director, manager, or supervisor.
Based on our survey, the prevalence of using APP leaders/managers has increased dramatically in the last few years, as shown below:
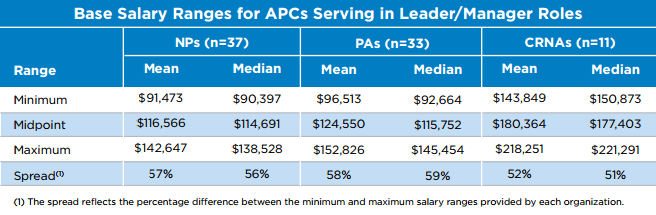
Determining appropriate cash compensation for these roles is essential but challenging, given the rapid emergence of the roles and the inherent lag in the reporting and availability of robust market data. Over 90 percent of organizations with APPs in one of the leader/manager roles discussed previously provide additional compensation to these APPs over what is provided to non management APPs. This additional compensation is primarily provided in the form of a higher rate of pay or placement in a higher salary grade/range. The table below provides both mean and median salary range data for nurse practitioners (NPs), physician assistants (PAs) and certified registered nurse anesthetists (CRNAs) in management roles:
SullivanCotter expects that the organizational trend to create and more fully define APP leader/manager roles will continue for at least the next two to five years, and given the number of APPs within large health systems, more than one level of APP leader/manager will likely need to be defined and developed, up to and including executive levels. Many organizations also now include APleaders/managers in provider compensation committees, quality committees, and other functional and operational decision-making areas to facilitate greater alignment between organizational goals and strategies and the health care delivery team. Additionally, these roles will increasingly require full-time allocation to leadership/management work efforts with little or no clinical work time.
Given the evolving responsibilities and increasing existence of APCs in leadership/management roles, simply promoting strong clinicians into these roles without a thoughtful approach to alignment within the care team and a structured management development plan may result in less than optimal results. There is a critical need to properly develop the skills of these new APP leaders/managers by providing them with training in areas such as people management, strategy development, and business analytics. Doing so will enable them to thrive in their roles, successfully lead their teams, and help the organizations that they work for meet their goals and objectives.
SullivanCotter’s 2016 APP survey will seek additional data on management level jobs, and while those data will be helpful, it will be important for organizations to consider their compensation philosophies and strategies for this key leadership group. Important questions to ask include:
- To whom in the organization does it make the most sense to have these APP leaders/managers report?
- How should we structure our organization to ensure strong communication and teamwork across the entire clinical leadership team (including physicians, APPs, and nursing leaders)?
- How should we consider internal equity as we set pay levels (i.e., how should pay for these positions compare to nursing managers or directors)?
- In addition to competitive base pay, should there be an incentive plan for APP leaders/managers? And, if so, what are appropriate goals and metrics?
Learn more about SullivanCotter's Advanced Practice Provider Workforce Consulting
SullivanCotter Hires James Roth as Employee Compensation Practice Leader
June 14, 2016
 MINNEAPOLIS- (BUSINESS WIRE) - SullivanCotter, one of the nation’s leading independent compensation, benefits and human resources management consulting firms, announces the hire of James Roth as Managing Principal and Employee Compensation Practice Leader.
With over 25 years of experience in human resources management and consulting, James is a recognized leader in the field, specializing in the design, implementation and communication of total rewards strategies in industries undergoing disruptive transformation. His expertise includes establishing compensation, benefits and career development programs for employees across every level of the organization, creating integrated career frameworks and workforce planning models, and designing incentive programs and performance measures aligned with business strategy and organizational culture.
“As the health care industry continues its rapid transformation, hospitals and health systems nationwide are going through unprecedented upheaval. James is a proven and globally-respected leader in developing solutions to attract, engage and reward employees. His extensive experience working with large and operationally complex organizations undergoing major change coupled with our deep insight into the health care industry is a tremendous combination. It marks huge step forward in helping our clients address the increasingly diverse challenges they are facing,” said Ted Chien, President and CEO, SullivanCotter.
As the firm’s Employee Compensation Practice Leader, James will play a vital role in advising clients on essential elements of compensation philosophy and strategy development. He will also lead the expansion of the firm’s employee compensation consulting services, spearhead the development of total rewards strategies and solutions, and work internally with a team of research experts to enhance SullivanCotter’s industry-leading survey suite and benchmarking data.
Prior to joining the firm, James was a Senior Partner and the Global Rewards Practice Leader for Mercer, responsible for the development of client solutions with a globally diverse team. His experience also includes operational responsibilities as the Vice President of Human Resources at Service Experts, Inc. in Nashville, TN.
James received his undergraduate degree in Human Resource Management from Birmingham-Southern College and completed graduate coursework in Industrial/Organizational Psychology from the University of Alabama.

'How Trustees Can Improve Alignment by Overseeing Physician Compensation', Trustee Magazine
Relationships between health systems and physicians have undergone significant change in recent years as health care continues its rapid transformation into a value-based system focused more on quality, patient satisfaction and cost effectiveness. As organizations adapt to these new payment and care delivery models, physician compensation alignment strategies have expanded to include a broad continuum of independent and combined approaches from clinically integrated networks and joint ventures to professional service agreements and full employment.
As clinical alignment strategies proliferate, Trustees need to understand the rules and arrangements of physician compensation so health systems can better integrate and the risks of compliance be reduced.
This article, published in AHA’s Trustee magazine, offers guidance to trustees who are overseeing physician compensation arrangements so they can confront governance challenges, improve alignment and mitigate financial and reputational risk to their organizations.

'Value-Based Physician Compensation: A Link To Performance Improvement', hfm Magazine
Transitioning to Value-Based Compensation
As organizations look for ways to adapt to new payment and care delivery models, aligning physician compensation in a way that supports these efforts remains a challenge.
In a recent issue of Healthcare Financial Management Association's hfm magazine, Mayo Clinic Health System (MCHS) shares the initial results of its journey to effectively engage and align providers while meeting the organization's strategic goals to achieve integrated, value-based patient care.
With the implementation of innovative new provider performance management technology, developed in cooperation with SullivanCotter, MCHS now uses a centralized, automated system for managing and reporting provider data. Through transparent online performance and compensation analytics, the organization has been able to demonstrate how even small incentives for quality outcomes can reinforce changes aimed at better care delivery.
SullivanCotter Hires Kevin Wilson as Physician Services Practice Leader
February 4, 2016
 MINNEAPOLIS--(BUSINESS WIRE)--SullivanCotter, one of the nation’s leading independent compensation, benefits and human resources management consulting firms, announces the hire of Kevin Wilson as Physician Services Practice Leader and Managing Principal.
A recognized leader in the health care consulting industry for more than 20 years, Kevin has a strong track record of providing strategic direction and management solutions to a diverse variety of health care clients. “Kevin is committed to advancing the relationship between organizations and their physicians, and has an extensive background helping health care organizations nationwide enhance performance, improve outcomes and achieve strategic alignment. Our clients continue to look for ways to stay competitive as the health care industry adapts to new payment and care delivery models, and Kevin’s expertise will serve them well as they navigate this transition from volume to value,” said Ted Chien, President and CEO, SullivanCotter.
In his role as the firm’s new Physician Services Practice Leader, Kevin will play an integral part in advising an increasingly diverse client base on a host of strategic and operational challenges. With a strong focus in both the design and implementation of physician compensation programs, he will also assist clients in service valuation, facilitating fair market value compliance evaluations, developing strategies to promote hospital and physician integration, and incorporating value-based payments into their distribution models.
Prior to joining the firm, Kevin was a Managing Director with Navigant Consulting. As a key leader in Navigant’s Physician Enterprise Solutions practice, he led a number of important national and regional client engagements with provider networks ranging from 100 to 2000 full time employees.
Kevin holds a Master of Business Administration from the J. Mack Robinson College of Business at Georgia State University in Atlanta, GA. He is also a Certified Valuation Analyst from the National Association of Certified Valuators and Analysts.

SullivanCotter Opens Participation for 2016 Health Care Compensation Surveys
January 20, 2016
MINNEAPOLIS--(BUSINESS WIRE)--SullivanCotter (SullivanCotter), a human resources and total compensation consulting firm specializing in the health care industry, has opened its 2016 health care compensation survey suite for participation.
The following surveys are now open for participation, and continue to provide critical benchmarking information to hospitals, health systems and medical groups nationwide:For over 23 years, SullivanCotter has provided the most comprehensive total compensation data, analysis and reporting to a wide variety of health care organizations, equipping them with the intelligence and insights needed to help attract, manage and retain top talent while satisfying regulatory requirements in today’s evolving market.
- Manager and Executive Compensation in Hospitals and Health Systems Survey
- Physician Compensation and Productivity Survey
- Medical Group Compensation and Productivity Survey
- Benefits Practices in Hospitals and Health Systems Survey
- Health Care Staff Compensation Survey
- Endowment and Foundation Investment Staff Compensation Survey
Additionally, three new surveys have been introduced for 2016 due to emerging needs for unique market data:
- For-Profit Health Care Executive Compensation Survey focuses exclusively on the data needs of for-profit health care organizations, and provides essential information on various types of equity-based compensation.
- Physician Executive Compensation Survey shares detailed total compensation data on physicians in C-Suite, service line and other key executive positions.
- Medical Group Executive Compensation Survey provides vital total compensation data on key executive positions collected from both independent medical groups and those owned by health systems.
“By providing for-profit health care organizations with equity-based compensation data and focusing on pay practices for physician and medical group leadership positions, these new surveys will provide our participants with access to the data and insights they require to confidently manage the compensation-decision making process,” says Chris Brandt, Director of Surveys, SullivanCotter.
Participants receive substantial discounts on the full survey reports, early access to electronic survey results, the opportunity to attend exclusive webinars and a dedicated team on hand to assist with questions.
To participate in or learn more about any of our surveys, please visit our website at www.sullivancotter.com/surveys360 or contact us by phone at 888.739.7039.

Aligning Pay With Performance in Endowment Incentive Plans
Incentive compensation plans in endowment investment offices are designed to fulfill a number of important objectives—the most significant of which is to ensure the alignment of pay with investment staff performance. As investment returns are published and closely evaluated by stakeholders, the media and other constituents, it is essential for boards and management to establish an appropriate correlation between pay and performance and to ensure that the design of the incentive program is both successful and defensible. Endowments should regularly assess the programs in place to determine whether incentive pay and investment performance properly align with the organization’s objectives, appropriately reflect the changing marketplace, and successfully deliver both competitive and reasonable compensation to investment staff.
Understanding Market Practices
While the prevalence of incentive compensation arrangements in endowment investment offices has steadied over the past decade, it remains high. In the Endowment and Foundation Investment Staff Compensation Survey, SullivanCotter conducts an annual assessment of key investment staff positions among leading colleges and universities, private foundations and other not-for-profit organizations. The 2015 report found that 98% of organizations with assets under management of greater than $1 billion offer incentive compensation to investment staff. For the Chief Investment Officer (CIO), incentive pay represents an average of 43% of total cash compensation.
98% of organizations with assets under management of greater than $1 billion offer incentive compensation to investment staff

1 The term “endowment investment office” for the purpose of this article is defined as the investment team or group managing the endowment of a university, foundation or other not-for-profit organization.
Other key findings from the survey indicate that incentive compensation is largely based on investment performance relative to the organization’s policy portfolio benchmark, with 88% of organizations having reported this. On average, this represents 71% of the overall incentive award for the CIO. Measurement is typically done on a relative basis because it gauges the performance of actively managed funds that are expected to see a return greater than that of the market. Endowment investment staff seek to outperform the market, whether that means higher returns in a bull market or fewer losses in a bear market.
Absolute return measures, such as measuring the total portfolio return without regard to any external benchmarks, are only used in 21% of incentive plans and represent a minority weighting in determining the total incentive award. Absolute return alone does little to explain other key factors that influence how well an endowment performs: where the funds are currently invested, the board-mandated risk profile, and the investment policy and objectives of the endowment as a whole. Peer group measures, where an organization’s returns are compared to a group of specific peer organizations, have fallen out of favor over the last decade and continue to decrease in prevalence. On average, 37% of organizations currently have a peer group measure in place, and this is often weighted no more than 25% of the overall award. Although this approach provides a secondary metric to evaluate investment performance, it too evaluates absolute performance without consideration of the endowment’s specific investment policy portfolio benchmark and objectives.
A comparison of published investment returns to a CIO’s total cash compensation is not a good indication of whether or not an organization is rewarding for performance. For example, one organization may report lower published investment returns because its policy objective is to maintain stable growth in the portfolio, yet its funds are significant in value and managed by a seasoned and high performing CIO. In the case of negative investment returns, CIOs may earn performancebased incentive awards even when the overall endowment fund does not yield positive returns as a result of market conditions. In this circumstance, the CIO may be rewarded for decisions to help preserve capital, protecting the endowment from greater loss. Additionally, 48% of investment offices required some percentage of the incentive award to be deferred. The amount truly earned in a given performance period cannot be discerned from publicly available documents, as payout amounts reported may reflect partial earnings from the current year as well as awards that had previously been deferred.
Assessing plan effectiveness
By regularly assessing your endowment’s incentive compensation plan, your organization can ensure that investment staff pay is properly aligned with performance. The following best practices are key assessment factors to consider in the incentive compensation decision-making process:

- Consistency with the compensation philosophy. Review the plan design in light of the organization’s compensation philosophy of how competitive to be and with whom. For example, if the organization intends to compensate staff at the median of the market with target levels of performance, a review of the plan design and current compensation levels will indicate whether the existing program is aligned with the stated philosophy.
- Appropriate peer group definition. The peer organizations against which compensation levels and pay practices are compared is critical. Recent scrutiny by the IRS and other regulators has been focused on peer group composition, and aspirational peer groups (those that represent a desired future state, such as endowments with significantly larger assets under management) are difficult to defend. It is important to ensure that peers reflect the organization’s current size, portfolio strategy and complexity, and not what the organization expects or hopes to look like in 10 years.
- Alignment with investment objectives. The metrics used and the period of time over which performance is measured should reflect the organization’s investment objectives. For this reason, less than 10% of organizations measure performance over a one-year period. Most plans (82%) measure performance over a three-year period to balance a longer term time horizon with the reality of line-of sight, investment staff tenure and the ease with which new hires can be incorporated into the plan.
- Mitigation of risk. How awards are interpolated (or not), capped and set relative to one another are important considerations for the mitigation of risk. For example, placing too much pay at risk can place a significant amount of pressure on the participants to deliver expected outcomes. This pressure may consciously or unconsciously affect decision-making.
- Effective investment performance measures. An effective incentive plan will have measures that staff can directly affect, such as performance relative to the policy benchmark. Incorporation of metrics over which investment staff may not have control or influence, such as absolute return or peer group measures, may lead to unintended behavioral consequences and affect the competitiveness of the plan.
- Evaluation of performance in multiple contexts. Incorporating the measurement and reward of individual contributions or the ability to qualitatively evaluate performance on both the overall organizational and individual level is an effective way to ensure that performance is evaluated and rewarded in multiple contexts. These contributions may include the successful leadership of staff in a particularly challenging economic environment, completion of an asset allocation study, or major rebalancing effort. This can provide a reference to not only what gets done but also to how.
- The use of credible benchmarking data. Quantitative plans based predominantly on investment metrics with a capped incentive opportunity have a greater chance of passing the test for reasonableness. Utilizing credible survey data is key in knowing where to set these caps. Custom peer groups can be helpful, but should represent a robust and appropriately broad sampling of the relevant talent market. In addition, multiple survey sources should be utilized whenever possible.
Process is Important
Aligning pay with performance for endowment investment staff and ensuring that the correlation is defensible requires a process of due diligence through board and management oversight and good governance of the compensation decision-making process. A regular assessment of incentive programs as well as a strong partnership between the Investment and/or compensation committee, management, and a qualified independent consultant is critical to the overall success and reasonableness of incentive compensation design.
One-Third of Early Adopters Have More Than 10% of Provider Compensation Tied to Quality
November 16, 2015
MINNEAPOLIS--(BUSINESS WIRE)--As the health care industry continues to shift its focus from volume to value, physician and advanced practice clinician compensation arrangements are following suit. Aligning provider pay with performance remains an ongoing challenge, and requires unique insight into quality performance measures and value-based incentive plan design. The Provider Performance Incentive Survey from Sullivan, Cotter, and Associates, Inc. (SullivanCotter) is the first of its kind as it focuses exclusively on non-productivity measures, and is a comprehensive source of data on emerging performance trends and incentive design practices.
In the 2014 survey, information was collected from a hand-selected group of over 30 large multi-specialty medical groups and health systems who are ahead of the curve in incorporating quality measures into their provider incentive plans. These organizations reported on more than 20 specialties and provided details on over 350 different performance measures. The results showed that 33% of these organizations have more than 10% of compensation associated with value- and quality-based performance measures.
“Value-based compensation and payment arrangements continue to evolve as the focus on rewarding value over volume is increasing. In the next five years, we expect approximately 80% of organizations to have more than 10% of physician compensation tied to quality measures, a large percentage of which will be ‘at risk’. Understanding these upward trends in value-based incentive measures are key to aligning provider pay and performance,” said Brad Vaudrey, Managing Principal, SullivanCotter.
68% of the organizations surveyed reported that they have quality incentives tied to compensation as a core component for all specialties, whereas 32% indicated that quality measures are currently only associated with select specialties. Additionally, 58% have incorporated quality metrics into their advanced practice clinician incentive plans as well.
Primary care specialties continue to see an increasing percentage of their total cash compensation attributed to quality and value measures, which averaged 6% in 2014. These compensation arrangements are split evenly between ‘at-risk’ pay, bonus pay, or a combination of the two. Organizations reported that primary care specialties such as in Internal Medicine and Family Medicine, at 94% and 90% respectively, are among those with the greatest prevalence of quality measures integrated into their compensation plans. The most commonly reported measures within these specialties relate to patient experience and patient access. Other top measures reported consist of preventative/chronic health issues including diabetes, heart disease, and mental health, tobacco cessation counseling, and readmission rates (unexpected return for previously performed services).
The 2015 Provider Performance Incentive Survey is now open for wider participation, and includes detailed performance data collection organized by specialty. Performance measures are collected based on the individual physician, as well as the department or clinical team, and are reported by weight, percentage of pay at risk, market utilization, frequency of use and more.
The deadline to participate is December 18, 2015. Survey participants will receive complimentary electronic copies of the survey report and data tables, released in February 2016.
For more information on SullivanCotter’s surveys, please visit our website at www.sullivancotter.com/surveys360 or contact us by phone at 888.739.7039.
SullivanCotter Releases Results from the 2015 Manager and Executive Compensation in Hospitals and Health Systems Survey
October 5, 2015
MINNEAPOLIS--(BUSINESS WIRE)--SullivanCotter, a human resources and total compensation consulting firm, recently released results from the 2015 Manager and Executive Compensation in Hospitals and Health Systems Survey. Now in its 23rdyear, the survey provides critical benchmarking data on compensation trends and pay practices, and is the largest and most comprehensive of its kind for hospitals and health systems nationwide. Information was collected from over 1,700 organizations comprising more than 400 health systems and 1,300 hospitals, and includes data for nearly 27,300 executives and managers.
While changes in base salary are generally consistent with last year’s overall change, total cash compensation (TCC) has increased at a higher level. Median TCC saw an overall increase of 6.9% for top executive positions. This is higher in health systems at 7.4%, which is up from 1.8% in the 2014 findings. While the prevalence of annual incentives has remained the same, the number of organizations paying incentive awards and paying at target levels increased this year. “Health systems continue to embrace performance-based pay. This year, 28% more reported hitting their annual incentive targets, and these payouts contribute to the overall increase in total cash compensation,” explains Tom Pavlik, Managing Principal, SullivanCotter.An analysis of the data indicates that median base salaries rose 3.1% overall for executives at hospitals and health systems. Health system jobs saw a slightly higher median increase at 3.6%, while hospital jobs more moderately increased by 2.6%. “Although overall growth remains consistent with last year, we are seeing some variation based on the size and type of organization. Large systems with over $1 billion in revenue and large hospitals with $300 million or more in revenue saw median base salaries increase at a faster rate than their smaller counterparts,” said David Dethmers, Manager of Information, General Industry Surveys, SullivanCotter. These increases were both above average at 3.6% and 3.0% respectively.
In addition, the complexity of executive roles at the system level is increasing. “As health care organizations continue to consolidate and integrate in an increasingly competitive health care environment, an executive’s scope of responsibility and span of control is expanding. These changes are impacting the way in which executives are compensated,” said Kathy Hastings, Managing Director, Executive Compensation Practice Leader, SullivanCotter.
For more information on SullivanCotter’s surveys, please visit our website at www.sullivancotter.com/surveys360 or contact us by phone at 888.739.7039.
SullivanCotter Releases Data from the 2015 Physician Compensation and Productivity Survey
September 9, 2015
MINNEAPOLIS--(BUSINESS WIRE)--SullivanCotter (SullivanCotter), a human resources and total compensation consulting firm specializing in the health care industry, announced the results of its annual Physician Compensation and Productivity Survey.
This year’s findings indicate a continued increase in the prevalence of quality-based incentives, which typically include metrics regarding clinical processes, patient experience and access. Nearly half (45%) of the organizations surveyed reported the use of quality measures in their physician compensation models. This represents a 13% increase in prevalence over the past two years. On average, staff physicians received $18,500 in quality incentives, which comprises 6% of their total cash compensation.The survey report addresses key physician compensation practices and trends from 560 organizations on nearly 115,000 individual physicians and advanced practice clinicians. This makes it the largest physician compensation dataset in the market.
“As reimbursement changes, organizational goals and priorities continue to shift. More physician pay related to quality metrics is at risk. We’re currently seeing a steady increase in pay-for-performance compensation models as the focus on value-based incentives continues,” says Kim Mobley, Managing Principal at SullivanCotter.
Additionally, the trend towards health system and large medical group employment of physicians continues. Nearly three-quarters of survey participants reported an increase in their employed physician workforce in the previous 12 months, and 68% plan on increasing their physician workforce in the upcoming year. The average actual and projected percentage increase to their physician staffing is 14% and 11%, respectively.
“In the wake of declining reimbursements and a constantly changing health care industry, physicians are seeking greater job security and stability. We continue to see an increase in the number of physicians employed directly by hospitals and health systems,” says Tim Strok, Team Leader, Physician Compensation Surveys at SullivanCotter.
Although the overall median increase in total cash compensation (TCC) for all specialties is modest at 1.8%, primary care specialties are seeing increases that outpace their specialist colleagues. When comparing staff physicians reported in both the 2014 and 2015 surveys, primary care physicians experienced a median TCC increase of 3.4%, while medical and surgical specialists had median TCC increases of 2.5% and 2.3%.
For more information on SullivanCotter’s surveys, please visit our website at www.sullivancotter.com/surveys360 or contact us by phone at 888.739.7039.