
PRESS RELEASE | Results from SullivanCotter's Annual Health Care Executive Compensation Survey
Offering insight into pandemic-related pay actions and considerations for 2020 and beyond as health care organizations plan for what lies ahead
November 5, 2020 – Chicago – SullivanCotter, the nation’s leading independent consulting firm in the assessment and development of total rewards programs, workforce solutions, and technology and data products for the health care industry and not-for-profit sector, recently released results from its 2020 Manager and Executive Compensation in Hospitals and Health Systems Survey — which is now in its 28th year. This year’s results include information from more than 2,300 organizations. More importantly, the survey contains the last set of benchmark data compiled prior to the onset of COVID-19 and provides important pre-pandemic reference points for assessing executive compensation programs.
“While pay actions are being impacted by the pandemic, the foundational structure of executive compensation programs has generally remained unchanged. The 2020 survey data can be used to assess the competitiveness of base salaries, the level of incentive opportunities and other program design considerations. In light of the impact of the pandemic on business operations, now is an appropriate time to evaluate the broader implications of COVID-19 on your talent strategy, compensation philosophy and program design to ensure they reflect your organization’s new priorities,” said Tom Pavlik, Managing Principal, SullivanCotter.
Executive Base Salaries in 2020
In recent years, executive salaries were trending upward due to the focus on recruitment and retention of key leadership talent and an increasingly complex health care market. When comparing data reported by organizations that participated in SullivanCotter’s survey in both 2019 and 2020, median base salaries going into 2020 increased at a rate of 3.4% to 5.6% for the most senior executives of independent health systems (Vice Presidents, Senior Vice Presidents, CFOs, COOs and CEOs) as opposed to 0.8% to 4.1% for those executive positions at system-owned hospitals.
However, due to the financial impact of COVID-19, many organizations have implemented temporary executive base salary reductions. According to SullivanCotter’s COVID-19 Executive and Employee Compensation Practices Survey series, which was conducted between April 2020 and August 2020 to provide insight into the current practices of more than 100 large health systems, only 14% of organizations were considering or had implemented executive base salary reductions as of April. By May, this number had risen to 31%. Through August, implemented salary reductions reached 45%. However, of this 45%, nearly half had already reinstated the pre-pandemic salaries with the remainder expected to do so by the end of the year.
Executive Base Salary Increase Budgets
An analysis of the survey data indicates that, prior to COVID-19, median salary increase budgets for health care executives were expected to remain consistent with recent years at 2.7% for independent health system executives and 3.0% for system-owned hospital executives. The pandemic has impacted the financial condition of many organizations and is moderating salary increase plans for FY2021.
According to SullivanCotter’s proprietary COVID-19 research, about 40% of organizations had determined their FY2021 executive salary increase budgets by mid-August. The preliminary median executive salary increase budget is 2.5%, with 15% planning to freeze executive salaries. The other 60% of organizations had not yet determined their salary increase budget, and 20%-25% are delaying the timing of these increases. These figures may change over time as financial performance will impact the ability to fully fund planned budgets, and it is anticipated that more organizations may consider executive salary freezes for FY2021.
Executive Annual Incentive Plans
Executive annual incentive plans (AIPs) are still the norm as organizations are increasingly focused on system-wide alignment and pay-for-performance. Prior to COVID-19, 89% of independent health systems and 67% of system-owned hospitals utilized AIPs with award opportunities varying by health system size based on net revenue.
According to SullivanCotter’s research, however, COVID-19 has had a significant impact on executive incentive plans for FY2020. As of mid-August, more than half of the participating organizations had implemented or were still considering changes to FY2020 plans. While one-third did not yet know how they will handle their FY2020 annual incentive payouts, approximately 20% are eliminating or considering eliminating payouts, nearly 30% expect to pay below target, and only about 20% expect to pay at target or above.
Considerations for 2020 and Beyond
As hospitals and health systems plan for what lies ahead and look to support financial sustainability and mitigate risk, organizations should consider both market practices and their individual financial circumstances when determining their executive compensation and workforce-related actions moving forward.
“SullivanCotter’s 2020 survey reflects the most recent normative year prior to COVID-19. Due to the current pandemic and the extremely dynamic environment, the survey data should be used thoughtfully, with appropriate context, and with sound business judgement as you are planning and considering your pay decisions for FY2020 and beyond,” said Bruce Greenblatt, Managing Principal, SullivanCotter.
There are a number of important executive compensation considerations for organizations to consider as they move forward:
- Be mindful of how to appropriately use 2020 survey data. Understand the timing of the data and consider what you are trying to assess before using them. The data can be helpful in benchmarking the competitiveness of compensation program elements and award opportunities.
- Rely on sound business judgement and discretion when evaluating base salary actions and incentives for FY2020.
- Plan to revisit incentive performance goals for FY2021 to ensure they are tailored to the current environment.
- Assess the broader impact of COVID-19 on executive talent strategy and review the compensation philosophy and program design.
- With continued uncertainty in FY2021 and beyond, remain mindful of the environment and be flexible.
For more information on SullivanCotter’s surveys, please visit our website at www.sullivancotter.com, email us or contact us by phone at 888.739.7039.
About SullivanCotter
SullivanCotter partners with health care and other not-for-profit organizations to understand what drives performance and improve outcomes through the development and implementation of integrated workforce strategies. Using our time-tested methodologies and industry-leading research and information, we provide data-driven insights, expertise, data and technology products to help organizations align business strategy and performance objectives – enabling our clients to deliver on their mission, vision and values.
READ ON NEWSDIRECT

INFOGRAPHIC | 2020 Manager and Executive Compensation in Hospitals and Health Systems
Considerations for using the 2020 survey data in light of COVID-19
As the last set of benchmark data available prior to the onset of COVID-19, SullivanCotter shares results from its 2020 Manager and Executive Compensation in Hospitals and Health Systems Survey. This analysis also includes insight into pandemic-related pay actions, important considerations for 2020 and beyond as organizations plan for what lies ahead, and using this year's benchmark data to help navigate future executive compensation decisions in light of COVID-19 and other market dynamics.
Now in its 28th year, this survey is the largest and most comprehensive of its kind for hospitals and health systems nationwide. Information was collected from over 2,200 organizations comprising 460 health systems and 1,800 hospitals and includes data for more than 42,000 individual managers and executives.
The 2021 survey is now open for participation!
DOWNLOAD INFOGRAPHIC


PRESS RELEASE | SullivanCotter Releases Enhanced Patient Panel Management Capabilities for PPMT™
Utilize SullivanCotter's industry-first physician compensation software to automate the assignment of patients to clinician panels through sophisticated organization-defined rules
October 28, 2020 – Chicago – SullivanCotter, the nation’s leading independent consulting firm in the assessment and development of total rewards programs, workforce solutions, and technology and data products for the health care industry and not-for-profit sector, launches expanded patient panel management functionality in the latest update of its comprehensive Provider Performance Management Technology™ (PPMT). PPMT™ is an industry-first, cloud-based physician compensation software that enables provider engagement through transparent performance-based compensation administration, reporting and analytical capabilities.
As the focus on optimizing team-based care to achieve better patient outcomes intensifies, health care organizations require more effective strategies and resources for facilitating patient panel management. PPMT™ enables organizations to automate the assignment of patients to clinician panels through sophisticated client-defined rules. It then calculates a risk-adjusted panel size and applies compensation calculations for a group or individual based on an organization’s requirements – providing the flexibility to change patient attribution and/or panel compensation assignments as clinical teams evolve. PPMT™ allows for greater transparency into panel composition and serves as a single, centralized source of truth for clinician compensation.
“Properly attributing patients to the correct clinician’s panel can require hours of administrative time each month. Combined with detailed analytics and powerful auditing and adjustment tools, the new panel management functionality streamlines this process to ensure more accurate attribution and support effective panel management programs,” said Shelly Slowiak, Director, Product Support, Provider Performance Management Technology™, SullivanCotter.
Designed to address a spectrum of physician, leadership and other key stakeholder needs, PPMT™ combines years of health care compensation insight and expertise with an intuitive, automated technology platform to help drive clinician performance and support the transition from volume- to value-based care. It incorporates SullivanCotter’s industry-leading benchmarking data into three integrated modules, including Provider Performance Management, Provider Productivity Insights and Compensation Management Analytics.
“We’re working hard to understand our clients’ changing needs and priorities and, as a result, will continue to refine our product roadmap and deliver the functionality they require to help navigate such a dynamic marketplace. This innovative new functionality will serve to strengthen our existing physician compensation software and panel management capabilities, and is a welcome addition to PPMT™ as we strive to develop one of the industry’s most comprehensive, end-to-end technology products for managing clinical compensation and performance,” said David Schwietz, Chief Information Officer, SullivanCotter.
For more information on Provider Performance Management Technology™, visit www.sullivancotter.com/PPMT or contact us at 888.739.7039.
About SullivanCotter
SullivanCotter partners with health care and other not-for-profit organizations to understand what drives performance and improve outcomes through the development and implementation of integrated workforce strategies. Using our time-tested methodologies and industry-leading research and information, we provide data-driven insights, expertise, data and technology to help organizations align business strategy and performance objectives – enabling our clients to deliver on their mission, vision and values.
READ ON NEWSDIRECT

INFOGRAPHIC | Considerations for Addressing the 2021 E&M Work RVU Changes
Considerations for Addressing CMS' final changes to the 2021 E&M Work RVU Values
RELATED CONTENT:
ARTICLE | 2021 Evaluation and Management CPT Codes: Understanding the Impact on Physician Compensation
ARTICLE | Navigating Change: Implications of the 2021 Physician Fee Schedule
SullivanCotter's CPT Advisory Services and Technology Solutions
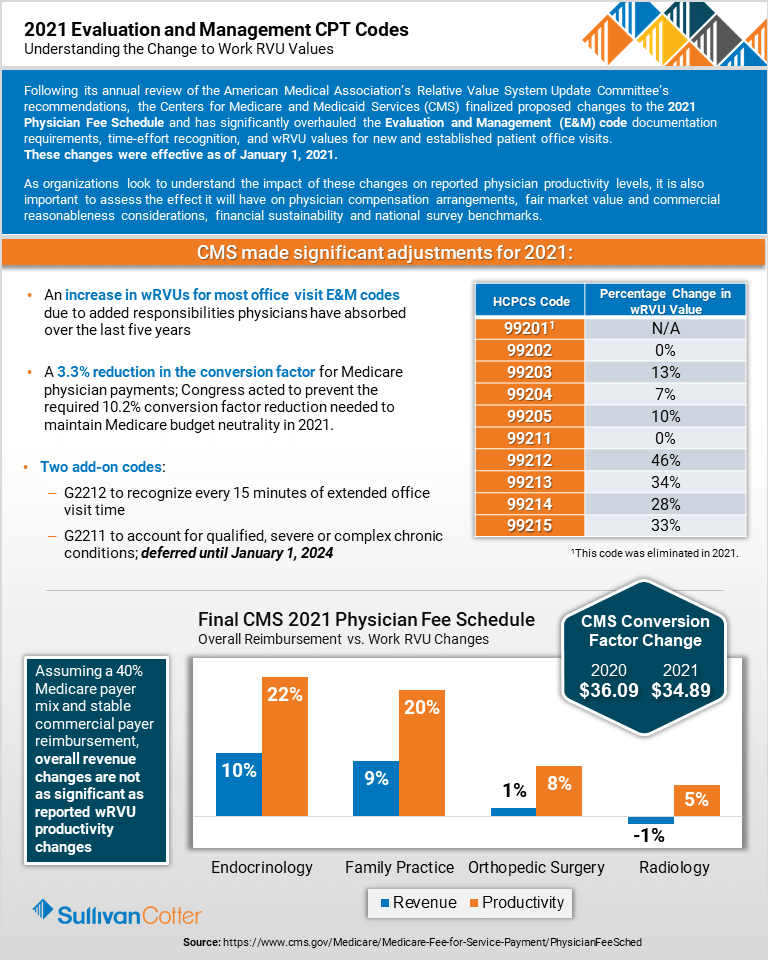
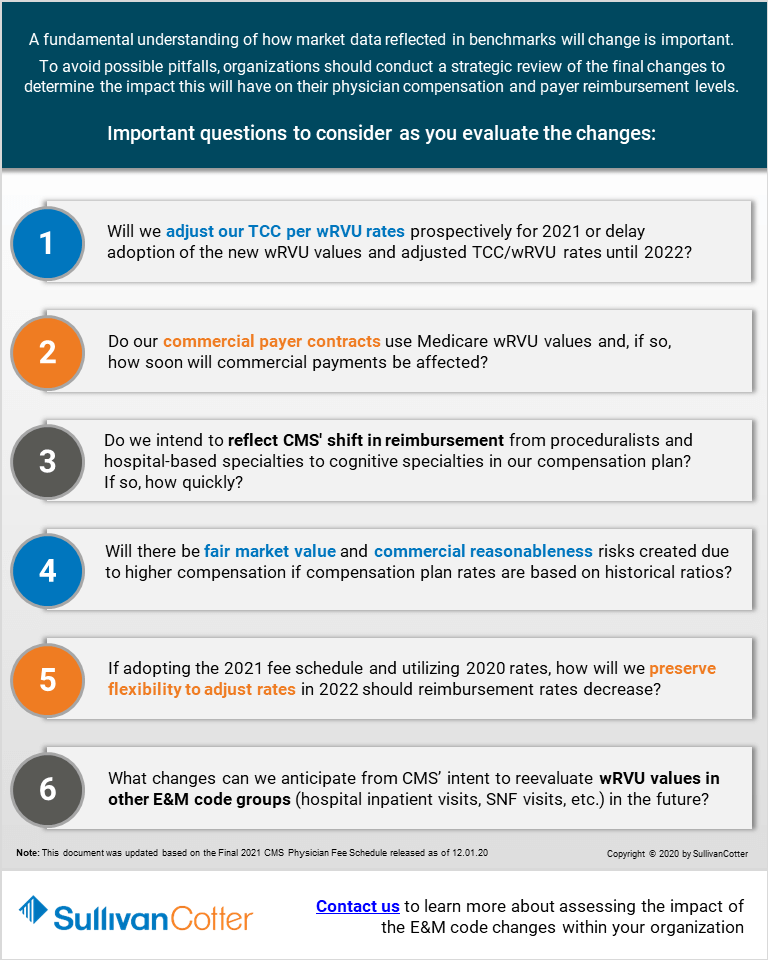
Following its annual review of the American Medical Association’s Relative Value System Update Committee’s recommendations, the Centers for Medicare and Medicaid Services (CMS) finalized proposed changes to the 2021 Physician Fee Schedule and has significantly overhauled the Evaluation and Management (E&M) code documentation requirements, time-effort recognition, and wRVU values for new and established patient office visits. These changes were effective as of January 1, 2021.
As organizations look to understand the impact of these changes on reported physician productivity levels, it is also important to assess the effect it will have on physician compensation arrangements, fair market value and commercial reasonableness considerations, financial sustainability and national survey benchmarks.
Contact us or visit our CPT Solutions page learn more about assessing the impact of the E&M code changes within your organization.
DOWNLOAD INFOGRAPHIC

PRESS RELEASE |
Hospital Sisters Health System Implements PPMT™
Hospital Sisters Health System Selects Innovative Technology Product to Automate and Enhance Physician Compensation and Performance Management Capabilities
October 13, 2020 – Chicago – SullivanCotter, the nation’s leading independent consulting firm in the assessment and development of rewards programs and workforce solutions for the health care industry and not-for-profit sector, has partnered with HSHS Medical Group and Prairie Cardiovascular, two Hospital Sisters Health System ministries, to implement its comprehensive Provider Performance Management Technology™ (PPMT).
Hospital Sisters Health System is a large, multi-institutional health system committed to delivering high-quality, patient-centered care to communities throughout Illinois and Wisconsin. By leveraging PPMT™, an industry-first, cloud-based product that enables physician and APP engagement through transparent performance-based compensation administration and analytical capabilities, the organization is looking to automate and align the management of clinician pay and performance across its medical group.
Driven by the need to provide a growing network of physicians with more accurate compensation and productivity data, HSHS Medical Group and Prairie Cardiovascular started the journey with an in-house application designed to enhance a process that was once very manual. Developing the right mix of internal resources and support to expand the application’s capabilities in line with the system’s evolving needs, however, proved difficult.
“We required a more comprehensive system with the ability to flex and scale with us as we add or change value-based incentives, modify compensation plans and analyze the impact of Evaluation and Management CPT code changes. PPMT™ will now enable us to automatically deliver extensive supporting documentation with drill-down capabilities to the patient-level for our clinicians to access any time they want. Providing this visibility and transparency is critical as we navigate an increasingly complex and rapidly changing health care environment,” said Linda Dace, System Vice President of Finance, Hospital Sisters Health System.
PPMT™ incorporates SullivanCotter’s industry-leading benchmarking data into three integrated modules, including Provider Performance Management, Provider Productivity Insights and Compensation Management Analytics. Hospital Sisters Health System selected all three modules to help support their goals - allowing for a more cohesive approach to compensation and performance management.
For more information on Provider Performance Management Technology™, visit www.sullivancotter.com/PPMT or contact us at 888.739.7039.
About SullivanCotter
SullivanCotter partners with health care and other not-for-profit organizations to understand what drives performance and improve outcomes through the development and implementation of integrated workforce strategies. Using our time-tested methodologies and industry-leading research and information, we provide data-driven insights and expertise to help organizations align business strategy and performance objectives – enabling our clients to deliver on their mission, vision and values.
READ ON NEWSDIRECT

Optimizing Care Delivery in Response to COVID-19
Supporting system-wide alignment in an evolving health care environment
DOWNLOAD ARTICLE
Health systems nationwide continue to face a number of unprecedented challenges due to the evolving COVID-19 pandemic. Supporting financial sustainability remains a top priority. As the industry looks ahead and makes plans for financial recovery and operational transformation, optimizing care delivery to improve efficiency, drive workforce performance and increase revenue is a critical step in this process.
Care delivery optimization between systems and their affiliated hospitals, integrated practices, and physician and advanced practice provider (APP) workforces can promote financial sustainability by identifying gaps in care delivery, improving operational efficiency, reducing clinical variation, and expanding capacity for important growth initiatives. To help accomplish this, there are five key areas that health care organizations should focus on as they look to position themselves to deliver the greatest possible value.
SullivanCotter recommends a thoughtful and strategic review of the following areas:
Physician/APP-Hospital Alignment
Aligning operations, goals and results across the organization is key to building a workforce that is unified and supports organizational strategy. To enhance care delivery optimization, organizations should:
- Assess current physician affiliation relationships, including pending and/or potential mergers and acquisitions and consider:
- Updating due diligence assessments in the context of COVID-19 to include financial analysis and review of agreements
- Reviewing key characteristics of existing compensation arrangements and performance requirements to conduct best practice comparisons by affiliation model/relationship and assure incentives are aligned between the models
- Evaluate current and projected physician and APP staffing requirements and care team development to address community need, integrated practice and service line needs
- Review current and potential Service Line Co-Management or HEIP (Hospital Efficiency Improvement Plan) arrangements to ensure the metrics are still aligned with system goals
- Assess physician involvement in the decision-making process, including medical group and service line governance structure
- Consider clinical workforce culture and perceptions related to strategic objectives while also identifying opportunities for improvement
Medical Group Operational and Financial Performance
Evaluating a medical group’s overall performance against a variety of operational and financial metrics will help identify actionable areas for improvement.
- Assess key medical group and/or specialty-level operational and financial performance indicators
- Review and update productivity thresholds and benchmarks, revenue, expenses and overall financial performance, staffing ratios, measured outcomes, patient capacity and clinic throughput
- Evaluate performance indicators shared with physicians and APPs and ensure systems are in place to provide transparent and timely information on performance relative to benchmarks, service line and system strategic goals
- Consider primary care model redesign and develop financial feasibility pro forma based on volume expectations and clinical regulations
- Focus on care delivery models designed to achieve optimal financial performance with a patient-centric focus (e.g., improves satisfaction, APPs practice at top-of-license, yields appropriate return on investment)
- Perform workflow assessment at the service line and practice levels to evaluate patient access and throughput, including the utilization of telehealth and remote services
Specialty and Service Line Care Delivery
Once the medical group’s overall performance has been assessed and specific underperforming specialties have been identified, it is important to do a deep dive into specialty and service line performance. Assessing clinical workforce performance is imperative as organizations look to increase the focus on value-based outcomes associated with quality and cost.
- Evaluate unwarranted care variation and cost-efficiency opportunities
- Develop strategies to reduce length of stay variance, readmission and value-based care penalties
- Perform service line and facility-based workforce planning and staffing efficiency assessments
- Identify appropriate benchmarks related to cost of care against internal and external cohorts
- Review physician referral processes to help project actual and expected volumes
Readiness for Value-Based Care
Successfully navigating the transition from volume to value relies largely on enhancing patient access. Care model designs that do not support this goal will likely result in stagnant market share or loss of patients.
- Conduct a physician needs assessment, demographic map and strategic plan to match service needs within market segments based on expected changes
- Perform analysis of telehealth capacity, financial return on investment and regulatory requirements
- Assess clinic space, including waiting room access and throughput in light of COVID restrictions
APP Utilization
APPs are one of the fastest growing segments of the health care workforce. Integrating APPs as key members of the care delivery team and utilizing them to their full potential can help an organization to achieve a number of important goals – including improved patient access, increased revenue, and enhanced quality and service while also reducing the cost of care.
- Perform a current-state analysis by comparing APP utilization and productivity to market benchmarks based on specialty and role:
- Quantify the financial opportunity available with a fully optimized APP workforce
- Conduct a readiness assessment to determine barriers and cultural considerations related to full APP optimization
- Identify specific specialties or service lines with the most opportunity (financial or non-financial) and readiness for change
- Review and update APP organizational practices:
- Assess governance structures, recruitment and retention policies, and training and development programs
- Align organizational bylaws, policies, practices and operations to federal and state laws, payer policies and procedures, and leading market practices
Conclusion
The process of evaluating these five focus areas will help to highlight and quantify opportunities for improving patient access, enhancing organizational efficiency, increasing revenue and reducing costs as health systems plan for what lies ahead. For each area of focus, SullivanCotter recommends developing an in-depth assessment, utilizing operational and financial expertise and incorporating comparative benchmark data analysis to define potential solutions unique to the requirements of each system to help optimize clinical performance and achieve key organizational goals.
Leveraging data-driven insights and over 25 years of experience, SullivanCotter partners with organizations to develop comprehensive care delivery optimization strategies tailored to the unique needs of each client.

Implementing a Job Architecture
Getting the Most from Your Human Capital Management System
DOWNLOAD ARTICLE
A Time of Transformation
Due to the evolving COVID-19 pandemic, hospitals and health systems nationwide continue to navigate a number of financial and workforce challenges. As organizations make plans for financial recovery and operational transformation, there is no doubt that the health care industry is in the midst of significant change. At present, there are many views on the form this transformation may take. Recent news articles and interviews with health system executives suggest a myriad of approaches are likely to be taken during such an unprecedented time:
- Reducing and/or reallocating certain resources to optimize the workforce
- Streamlining management structures
- Accelerating mergers and acquisitions
- Restructuring/centralizing administrative and patient care services to facilitate innovation and deployment
- Standardizing processes to more clearly define roles and responsibilities
- Diversifying health systems through continued entry into adjacent enterprises such as health plans and technology solutions
- Reimagining and accelerating the delivery of care in ambulatory settings and virtually
- Broadening skill sets to facilitate flexible deployment and re-deployment of certain workforces in times of change and/or crisis
Although this journey will look different depending on the unique needs and circumstances of individual organizations, change is well underway. Though the health care industry has been evolving for a number of years, COVID-19 has made the need for transformation more urgent and, in some cases, greatly affected the trajectory of the transformation.
Technology and Transformation
To facilitate transformation, many health care organizations are beginning to migrate from on-premise Enterprise Resource Planning (ERP) and Human Capital Management (HCM) systems to cloud-based platforms from organizations such as Workday, SAP, and Oracle/PeopleSoft.1
While the transition has been slow, the need for greater workforce optimization and enhanced processes along with the growing obsolescence of on-premise systems triggered this migration. Organizations making the investment in a cloud-based system report that they are looking to:2
- Enhance critical workforce insights through real-time reporting and analytics to facilitate workforce optimization
- Improve administrative processes and implement best practices to allow functions such as finance, supply chain management and human resources to be more strategic
- Align operations around a single system – eliminating a number of disparate applications
- Streamline transactions as it relates to mergers, acquisitions and organizational restructuring
- Integrate a variety of information sources to enhance data integrity
- Secure best-in-class manager and employee self-service capabilities
- Support compliance and mitigate risk
- Reduce variability of practices across the organization
At a time when hospitals and health systems are looking to restructure, diversify and transform, it may seem counterintuitive to suggest that ERP and HCM systems will be a key part of an organization’s transformation strategy. However, David Chou, a prominent health care technology executive and consultant, indicates that “healthcare provider institutions must begin aggressive ERP initiatives” going into 2021 if they want to remain competitive.3 He notes that many on-premise systems are being sunset as the need to enhance the efficiency of administrative processes is long overdue. Health care organizations have only two choices – carry on with costly and inefficient processes or finally make the investment in ERP and HCM technology to optimize and align operations.
For those who play a critical role in managing the health care workforce, the most important component of an ERP system is its HCM module. An HCM system is essentially a database and group of applications that helps to facilitate the management of an organization’s workforce. This often includes compensation, recruitment, learning and development, performance management and payroll functionality. It can either stand alone or be implemented as part of a broader ERP system.
Implementing a Human Capital Management System
Unfortunately, surveys indicate that nearly half of ERP projects fail to achieve the desired outcomes or run over budget and past deadline.4 While there are a number of reasons for these implementation challenges – the most prominent one is that many organizations are simply not ready or properly prepared.
A successful implementation requires much more than just the technology. Critical to the process is a need for well-defined goals, strong commitment from management and other key stakeholders, depth and breadth of expertise on the project team, open communication and the dedication to instill change.
Also very important, but often overlooked, is the need to have clearly defined processes and structures prior to implementation. Foremost, there is little value in implementing structures and processes that are not fully aligned with an organization’s strategy. Additionally, with the tight timeframes often set by organizations and their deployment partners, there is usually little choice but to do what is known as a “lift and shift”. This refers to organizations utilizing their current processes and simply reimplementing those practices into the new technology platform.
This poses a unique challenge for health systems as few organizations begin the deployment with best practices in place. In fact, many utilize a number of disparate processes, structures and tools to manage human capital. So not only have they failed to implement best practices, they currently have few system-wide practices in place.
A comprehensive review of SullivanCotter’s Workforce Insights360™ database, which contains related information from nearly 40 contributing hospitals and health systems, shows that:
- Approximately 25% of organizations have more than 1,900 job titles and have just 5 employees per job title – this number is even less if you exclude nursing and service line jobs.
- From CEO to first line supervisor, the median number of organizational levels is 8. The median number of management job levels is 15 – which includes almost 2 management job levels per organizational level.
- Moreover, 25% of organizations have 20 or more job levels from CEO to supervisor. This level of granularity explains why many organizations have difficulty differentiating management titles and far exceeds the one-to-one relationship between job titles and organizational levels common in other industries.
- In regards to reporting relationships and the restructuring around functional lines, only about 60% of human resources and finance employees report up through the CHRO or CFO hierarchy. For a quarter of the organizations, this number was less than 50%. This suggests that health care organizations remain largely decentralized when it comes to support functions.
While an HCM system can be implemented without aligning important processes and structures, failure to do so prior to or in conjunction with HCM system deployment often leads to sub-optimal outcomes. Not only is the organization failing to secure the type of transformational change that was likely an important reason for the initial investment in a cloud-based HCM system, but the functionality they are getting as a result is often sub-optimal.
Although highly recommended as an important best practice, it may not be feasible for some organizations implementing an HCM system to have all their processes and structures harmonized and defined at the outset. The implementation of an HCM system is a journey that provides the ability to strengthen and refine current processes and structures or develop new ones.
However, there is one area that all organizations should prioritize – their job architectures.
The Importance of a Job Architecture
Job architecture refers to an organization’s framework for defining and cataloging jobs – the output of which is its library of jobs.
For many HCM systems, the job architecture and database are the hub around which critical functionality is built.
Studies show that 75% of organizations that have implemented a new cloud-based HCM system have also developed a new job architecture before, during or after deployment.5 This not only reinforces how critical a well-defined job architecture is to this process, but also highlights the fact that most organizations do not already have the appropriate structures in place to maximize value from the deployment of a new HCM system.
How an organization defines the job architecture influences how many jobs it has and how the roles are defined. It will affect what type of reporting and analytics are available and how workforce data is accessed by executives, managers and employees. It will also impact how human resources programs are designed or can be deployed. The structure of this database and its content are critical to optimizing the functionality of an HCM system.
The table below reflects the type of information frequently housed in this database and its linkage to important human resources processes:
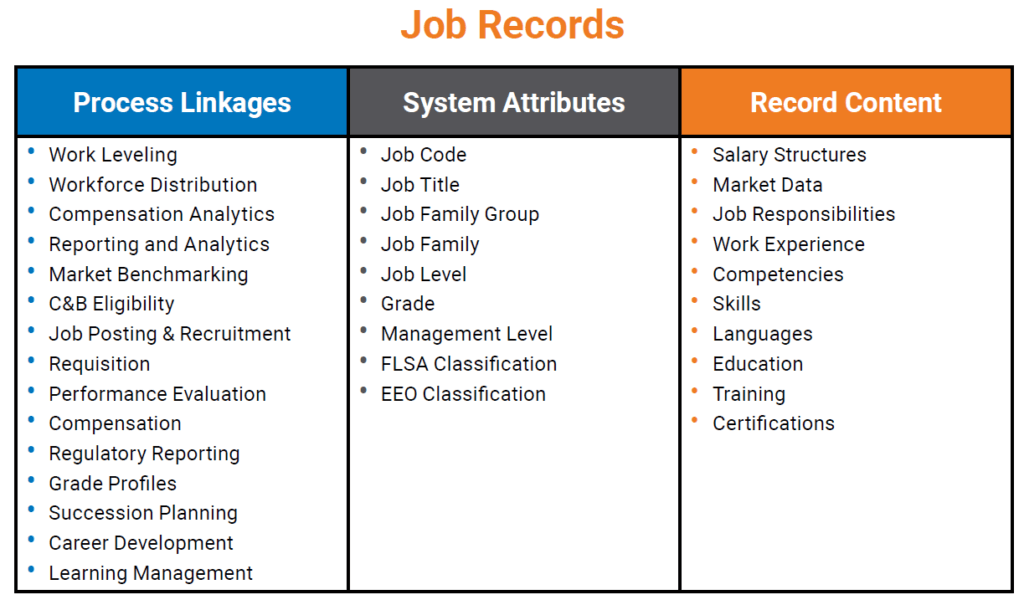
To optimize the deployment and eventual utilization of the job catalog within a cloud-based HCM system, organizations must consider the following:
1. Cloud-based HCM systems are configurable – not customizable
Hospitals and health systems coming from an on-premise environment are accustomed to doing just about anything they want. When developing new attributes, for instance, they often write elaborate scripts to create custom workarounds. Cloud-based platforms are not intended to work this way, however. They are built upon best practices that the technology provider applies to all users and work best when one understands their parameters and builds their job architecture and job content around those parameters.
2. Manager and employee self-service requires consistency and ease-of-use
Several HCM systems highlight manager and employee self-service as a cornerstone in their value proposition. This creates a challenge for organizations that lack transparency in their job architecture and compensation programs.
If these self-service capabilities are enabled:
- A simple and intuitive organizing principle must be developed so managers and employees can search, query and request reports
- Inconsistencies should be resolved to eliminate any potential confusion and enhance the usability of the information
- Content must be widely available and regularly maintained to allow managers and employees to make appropriate decisions within a self-service environment
Organizations implementing a cloud-based HCM system with manager and employee self-service capabilities would be wise to resolve all of these challenges before going live to help ensure the organization can “hit the ground running.”
Timing
If a redesign of an organization’s job architecture is required, it is best to do so before undertaking the HCM system deployment. However, if that is not feasible, developing a new job architecture concurrent with the implementation work is possible and can be done without negatively impacting the implementation schedule.
Organizations that decide to do this should consider the following:
- Build your project plan around the milestone dates provided by your deployment partner. These are generally nonnegotiable as the deployment costs are based on meeting these deadlines and any work needs to be completed within this timeframe.
- Consider adopting an established job framework. This will help to ensure alignment with the market, reduce the time required to develop the job architecture, and decrease the burden on the human resources team.
- Prioritize the work and focus only on what is necessary to accomplish before going live.
For organizations that have already implemented a new HCM system and are seeing the consequences of not having harmonized or rationalized job structures, it can be difficult to know when to do the work. There may be fatigue from having recently gone through a large HCM system implementation or unease regarding additional change. Both are reasonable concerns. If significant change is not possible, organizations may consider modifying the attributes used to organize jobs in the HCM system rather than completely restructuring the job framework and compensation systems. While more significant action may be necessary in the long-term, small or modest changes in the structure of the job catalog can enhance value and functionality.
Conclusion
While some organizations may decide to implement a new cloud-based HCM system simply because they are phasing out their current platforms, most who embark on this journey are looking to secure greater insights in order to optimize their workforces, improve critical support functions and enhance organizational efficiency. Ensuring that best practices, effective internal structures, and technology-enabled processes are in place is the surest path to success.
1As Healthcare Turns to ERP, It Also Turns to the Cloud, Brian Eastwood, HealthTech, November 9, 2018.
2Getting the Most from Workday: It’s Not Just About Configuration. Darrell Cira and Susan Lokker, WorldatWork Training Course, October 2017.
3Don’t Sleep. Healthcare CIOs Must Step Into 2021 Now. David Chou, Forbes, May 21, 2020.
4ERP Software: Facts and Stats, Elizabeth Quirk, ERP Solutions Review, April 18, 2019.
5Hidden Challenges of Implementing a New HRIS on the Total Rewards Function. Darrell Cira, Rob Heir, Patrick Bostrom, Steven Seykora, Presentation at WorldatWork National Conference, May, 2015.

PRESS RELEASE | SullivanCotter Launches New Physician Needs Assessment
SullivanCotter Launches New Physician Needs Assessment Application to Support Critical Staffing and Service Line Requirements
September 15, 2020 – Chicago – SullivanCotter, the nation’s leading independent consulting firm in the assessment and development of rewards programs and workforce solutions for the health care industry and not-for-profit sector, announces the launch of its new Physician Needs Assessment (PNA). SullivanCotter’s PNA is an interactive, cloud-based application that delivers actionable, data-driven insight into physician supply and demand to help organizations identify, monitor and respond to changing service line needs and physician workforce staffing requirements.
By leveraging real-time market intelligence, custom analyses and tailored forecasting scenarios, this innovative new PNA application enables organizations to dynamically address emerging market trends, changing population demographics and evolving physician practice patterns.
Using proprietary benchmark data from over 1,500 organizations and 400,000 physicians, SullivanCotter’s advanced methodology analyzes more than 1 billion unique claims annually to accurately calculate the physician surplus or deficit within a specific area by determining supply, forecasting wRVU utilization and adjusting to various market-specific demographics – including geography, economic factors, age/gender, payment types and managed care – to calculate subsequent demand projections.
“In today’s increasingly uncertain marketplace, health care organizations remain acutely focused on recovery and what lies ahead in a post-COVID-19 operating environment. As hospitals and health systems look for better ways to support financial sustainability, assess clinical optimization opportunities, drive performance, and manage physician resources and service line needs, organizations must determine the right amount and type of physician specialties to operate effectively in the markets they serve ,” said Ted Chien, President and Chief Executive Officer, SullivanCotter.
Additional features and functionality include:
- A rigorously researched, call-verified and editable physician and APP supply roster based on multiple data sources that includes tracking of employment and affiliations
- Interactive mapping tool with the ability to select specific zip codes for strategic consideration and to account for any shifts in demographic mix
- Predictive modeling to assess the impact of virtual care, urgent care, retail health and more
- Advanced Practice Provider calculator to measure the impact of this workforce across specialties and their corresponding effect on physician supply and demand
- Comprehensive, customizable reports with 5-year rolling projections and automatic annual updates to demand defined by demographic and geographic data
- Archived reports providing strategic service area information and annual Stark compliance insights for measuring community need and assessing fair market value and commercial reasonableness considerations
Designed with the unique needs of leadership, physician and administrative stakeholders in mind, SullivanCotter’s PNA combines data-driven technology, industry-leading benchmark data and years of physician workforce consulting experience to provide organizations with the information and insights they need to inform key service line, practice and payer strategies in an evolving health care environment.
To learn more, request a demo, or view a full list of features and functionality, visit sullivancotter.com/PNA or call 888.739.7039.
About SullivanCotter
SullivanCotter partners with health care and other not-for-profit organizations to understand what drives performance and improve outcomes through the development and implementation of integrated workforce strategies. Using our time-tested methodologies and industry-leading research and information, we provide data-driven insights and expertise to help organizations align business strategy and performance objectives – enabling our clients to deliver on their mission, vision and values.
READ ON NEWSDIRECT

INFOGRAPHIC | APP Leadership Practices and Structures
Leadership Structures to Support Advanced Practice Provider Retention and Engagement
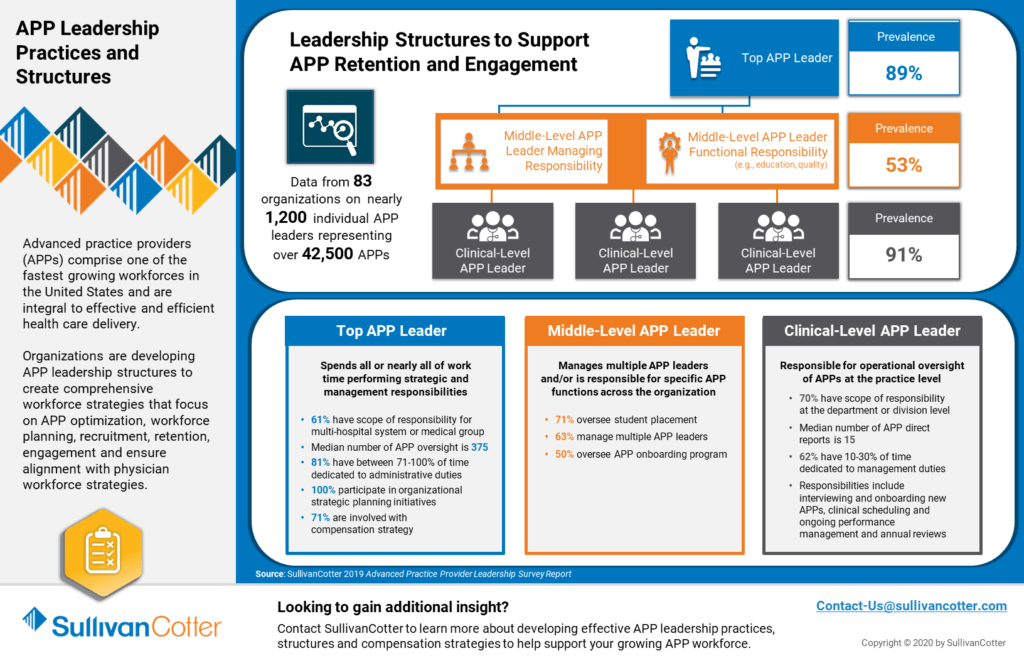
Advanced practice providers (APPs) comprise one of the fastest growing workforces in the United States and are integral to effective and efficient health care delivery.
Organizations are developing APP leadership structures to create comprehensive workforce strategies that focus on APP optimization, workforce planning, recruitment, retention, engagement and ensure alignment with physician workforce strategies.
Learn more from SullivanCotter's 2019 APP Workforce Practices and Structures Survey.
DOWNLOAD INFOGRAPHIC

ON-DEMAND WEBINAR | COVID-19: Impact on Physician and APP Workforce Strategies
Positioning Your Organizations for Success in the New Normal
View an on-demand record of this exclusive webinar hosted by the Health Forum/American Hospital Association - featuring data, insights and industry experts from SullivanCotter.
VIEW THE RECORDING
The impact of the pandemic has accelerated the need for strategic alignment between health systems and their employed and affiliated physicians and advanced practice providers (APPs).
As the industry begins to look ahead and plan for financial recovery and operational transformation, executive leadership should take this time to reassess their organization’s alignment strategies and affiliation models in order to identify key workforce and care delivery optimization opportunities.
Working in partnership with physicians and APPs, organizational leaders are evaluating ways to best position themselves to manage anticipated increases in volume, navigate the transition to value-based reimbursement, and support long-term financial sustainability.
During this webinar, industry experts from SullivanCotter will discuss:
- Physician and APP alignment strategies during and beyond the COVID-19 pandemic
- Key components for enhancing strategic alignment between physicians, APPs and health systems
- Leading practices in physician needs assessments and key considerations for primary care team optimization
- Emerging trends in physician and APP compensation
- The utilization of physician feedback and emerging performance management tools to aid in the development of core performance expectation and incentive plan metrics

PRESS RELEASE | SullivanCotter Launches Clinician Pay Functionality for PPMTTM
SullivanCotter Develops Powerful New Clinical Compensation Management Capabilities for its Growing PPMTTM Platform
September 1, 2020 – Chicago – SullivanCotter, the nation’s leading independent consulting firm in the assessment and development of total rewards programs and workforce solutions for the health care industry and not-for-profit sector, announces the addition of highly anticipated new Clinician Pay functionality to its growing Provider Performance Management TechnologyTM (PPMT) platform. PPMTTM is an industry-first, cloud-based solution that enables provider engagement through transparent performance-based compensation administration and analytical capabilities.
Clinician Pay enables administrative stakeholders to easily manage annual compensation draws and payroll adjustments through a centralized, secure and auditable source within PPMTTM. The new functionality can be added as part of the platform’s comprehensive Compensation Management Analytics module for an additional licensing fee. This module’s broader capabilities allow organizations to integrate physician compensation earned from all sources, review dollars paid and balances due, facilitate settlement reporting, project year-end results, model improvement scenarios and generate accruals for Finance.
“With this automated new functionality, health care organizations can significantly reduce manual intervention and potential for human error when managing important pay adjustments for a large clinical workforce. Not only does this help to free up administrators to work on more critical projects, but it also helps to ensure data quality and instill greater trust in the reporting process by seamlessly communicating important information straight to payroll for payment,” said Shelly Slowiak, Director, Product Support, Provider Performance Management Technology™
PPMT’s Compensation Management Analytics module plus the new Clinician Pay feature also provides the option to utilize payroll data for settlement processing - allowing for a comprehensive end-to-end solution for processing clinician payments and compensation adjustments.
“To help organizations navigate an increasingly complex and uncertain health care environment, we are continuously refining our product roadmap and enhancing PPMTTM based on the evolving needs of our clients. Clinician Pay is an exciting new addition to the platform and demonstrates our commitment to developing one of the industry’s most innovative clinical compensation and performance management solutions,” said David Schwietz, Chief Information Officer, SullivanCotter.
Designed to address a spectrum of physician, leadership and other key stakeholder needs, PPMTTM combines years of health care compensation insight and expertise with an intuitive and automated technology platform to help drive provider performance and support the transition from volume- to value-based care.
For more information on Clinician Pay or our entire suite of Provider Performance Management TechnologyTM, visit www.sullivancotter.com/PPMT or contact us at 888.739.7039.
About SullivanCotter
SullivanCotter partners with health care and other not-for-profit organizations to understand what drives performance and improve outcomes through the development and implementation of integrated workforce strategies. Using our time-tested methodologies and industry-leading research and information, we provide data-driven insights and expertise to help organizations align business strategy and performance objectives – enabling our clients to deliver on their mission, vision and values.
READ ON NEWSDIRECT

Case Study | Optimal Use of APPs Can Help to Enhance Post-COVID-19 Financial Recovery
Featured in the July edition of hfm Magazine
As hospitals and health systems plan for post-COVID-19 recovery and operational transformation, the focus on optimizing care delivery, lowering expenses and increasing revenue to ensure financial sustainability will be critical.
Enhancing the use of existing clinical resources can help to support these goals. As part of this effort, leaders should make it a priority to reassess the role of advanced practice providers (APPs) given their extensive training, broad skill sets and ability to adapt to different practice settings.
In their work with SullivanCotter, learn how Excela Health's efforts to optimize their APP workforce yielded millions in financial opportunity - proving valuable during their COVID-19 response and recovery plan.
READ FULL ARTICLE

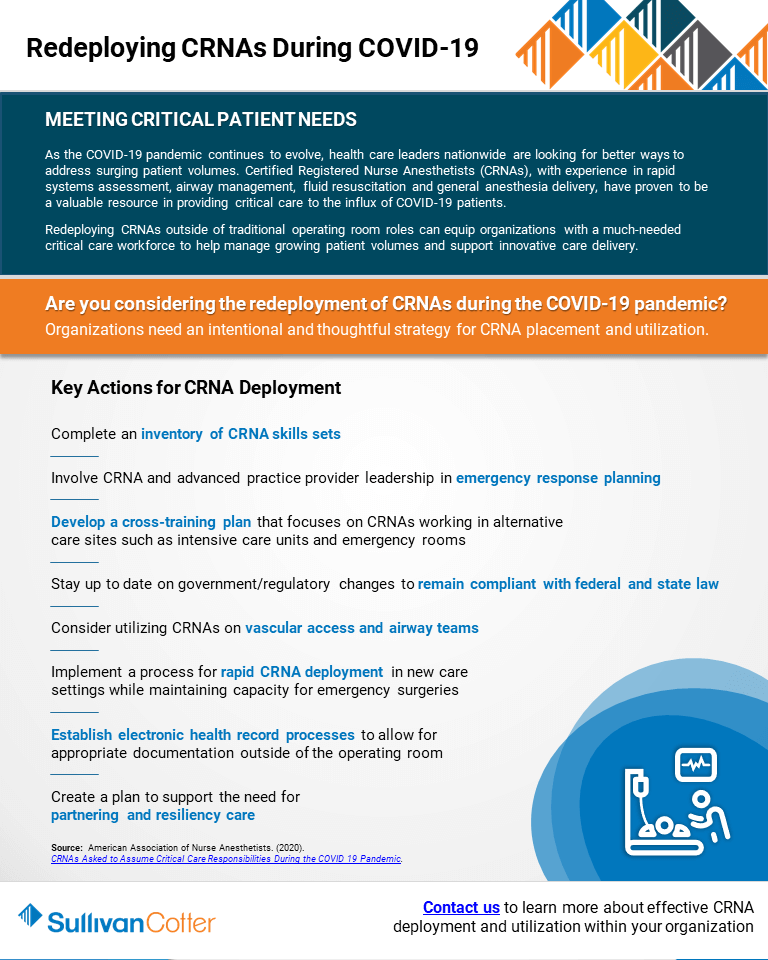
INFOGRAPHIC | Redeploying CRNAs During COVID-19
Helping to meet critical patient needs
Are you considering the redeployment of CRNAs during the COVID-19 pandemic?
Organizations need an intentional and thoughtful strategy for CRNA placement and utilization.
As the COVID-19 pandemic continues to evolve, health care leaders nationwide are looking for better ways to address surging patient volumes. Certified Registered Nurse Anesthetists (CRNAs), with experience in rapid systems assessment, airway management, fluid resuscitation and general anesthesia delivery, have proven to be a valuable resource in providing critical care to the influx of COVID-19 patients.
Redeploying CRNAs outside of traditional operating room roles can equip organizations with a much-needed critical care workforce to help manage growing patient volumes and support innovative care delivery.
DOWNLOAD INFOGRAPHIC

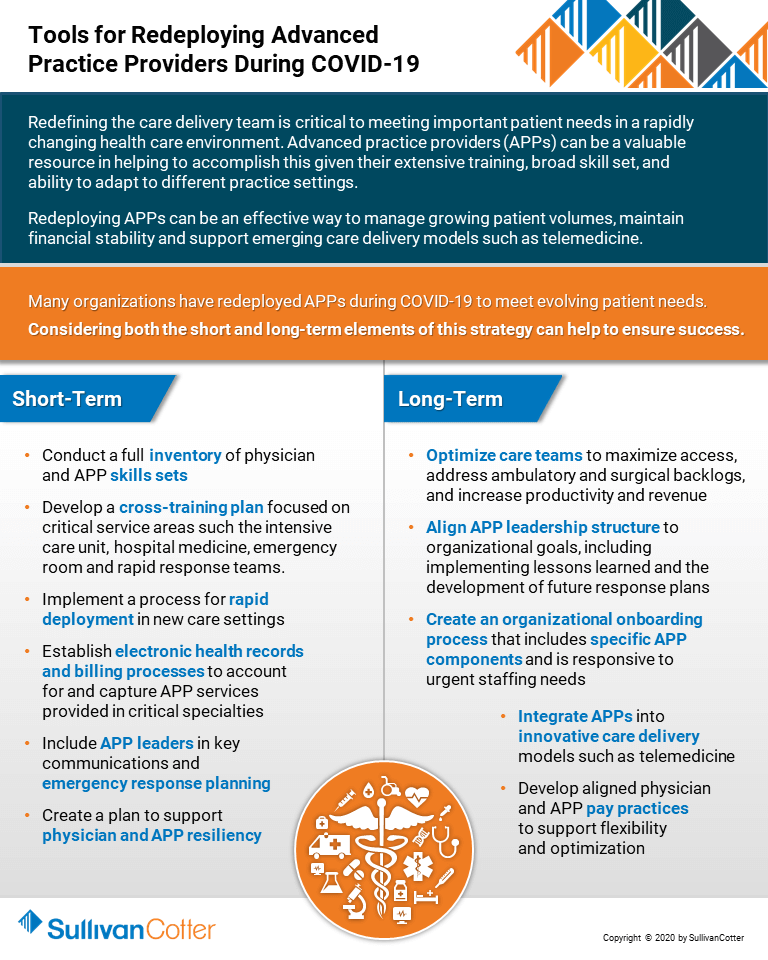
INFOGRAPHIC | Tools for Redeploying Advanced Practice Providers During COVID-19
Many health care organizations have redeployed advanced practice providers during COVID 19 to meet evolving patient needs.
Considering both the short and long-term elements of this strategy can help to ensure success.
Redefining the care delivery team is critical to meeting important patient needs in a rapidly changing health care environment. Advanced practice providers (APPs) can be a valuable resource in helping to accomplish this given their extensive training, broad skill set, and ability to adapt to different practice settings.
Redeploying APPs can be an effective way to manage growing patient volumes, maintain financial stability and support emerging care delivery models such as telemedicine.
DOWNLOAD INFOGRAPHIC

WEBINAR RECORDING | Physician Enterprises After COVID-19: Capturing and Assessing Opportunities
Hosted by McDermott Will & Emery
VIEW RECORDING
Physician enterprises will face lasting changes to their operations following the coronavirus (COVID-19) public health emergency. Transactional opportunities have also shifted, and physician enterprises and their counterparts have new factors to consider when assessing and pursuing collaborations and other transactions in a post-COVID-19 world.
Led by McDermott Will & Emery, SullivanCotter's Kyle Tormoehlen, Principal, and other strategic health care consultants joined leaders from hospital and health system physician groups and private equity-backed physician groups to highlight how physician enterprises can position themselves for success in the new healthcare landscape.
This webinar includes a discussion of:
- How has COVID-19 changed the healthcare and investing landscape?
- How can physician practices shift their means of care delivery, including telehealth solutions, now and after COVID-19?
- How have operational challenges impacted physician practice valuations?
- What transactional opportunities have arisen from the public health emergency?
- How can physician enterprises and their counterparts execute successful strategic collaborations?

Modern Healthcare | 2020: Annual Executive Compensation Article
SullivanCotter helps to examine how health care organizations are adapting their executive compensation practices in response to COVID-19
As costs surge and revenue declines for health care organizations amidst the COVID-19 pandemic, many are re-evaluating their executive compensation programs as they focus on organization-wide equity, recovery and what lies ahead in such an uncertain environment.
Featured in an August 2020 edition of Modern Healthcare, SullivanCotter's Bruce Greenblatt and Tom Pavlik share data from SullivanCotter's recent COVID-19 research and highlight some of the key executive compensation changes being implemented or considered in response. This includes actions on base salaries, adjustments to current year incentives to account for the impact of the pandemic, and adjustments to future compensation programs and talent strategies to incorporate recovery considerations and ongoing uncertainty.
In order to focus on the need for financial sustainability, cost efficiencies and revenue growth, all of which have been accelerated by COVID-19, organizations should adopt a more flexible and fluid approach as they move into 2021 and beyond.
READ FULL ARTICLE

PRESS RELEASE | SullivanCotter Launches Suite of Health Care Benchmarking Solutions
SullivanCotter Launches Innovative Suite of Products to Help Benchmark Health Care Workforce Compensation and Clinical Productivity
READ ON PR NEWSWIRE
July 30, 2020 – Chicago – SullivanCotter, the nation's leading independent consulting firm in the assessment and development of total rewards programs and workforce solutions for the health care industry and not-for-profit sector, is pleased to announce the launch of Benchmarks360TM. Powered by SullivanCotter's proprietary survey data and research, Benchmarks360TM is a suite of intelligent, web-based products that enables health care organizations to analyze and visualize workforce compensation and clinical productivity.
Designed to address enterprise-wide benchmarking needs for employees at all levels – including executives, physicians, advanced practice providers and other clinical and non-clinical staff positions – Benchmarks360TM provides critical industry-leading data, analyses and reporting to support the compensation decision-making process in an increasingly complex operating environment.
"Amidst a rapidly evolving global pandemic, hospitals and health systems are struggling to navigate a number of unprecedented financial and workforce challenges. Strengthening compensation practices and clinical workforce productivity through unique, data-driven intelligence and insights can help to support long-term sustainability in today's ever-changing marketplace. With the ability to conduct a wide variety of quantitative reviews and custom benchmarking analyses, Benchmarks360TM allows organizations to interactively assess clinical productivity and changes in compensation against national market data," said David Schwietz, Chief Information Officer, SullivanCotter.
As one of the most comprehensive products of its kind, it includes two distinct modules to help balance pay and clinical productivity across the organization:
Workforce Compensation and Clinical Productivity Manager
Compare your organization's compensation and clinical productivity benchmarks to the nation's largest health systems and medical groups. Utilize SullivanCotter's proprietary benchmarking information, representing over one million total incumbents, along with other third-party data sources. This module comes in both a Standard (offered with the purchase of SullivanCotter survey data) and a Pro version (upgrade available for additional licensing fee).
Clinical CPT Manager
Analyze and measure your organization's Current Procedural Terminology (CPT) coding distribution against national physician and advanced practice provider clinical benchmarks at the specialty, work RVU and CPT level. This module can be purchased and added separately.
Benchmarks360TM is offered exclusively to organizations who purchase SullivanCotter survey reports. To learn more, including important licensing information and a full list of features and functionality, visit sullivancotter.com/benchmarks360 or call 888.739.7039.
About SullivanCotter
SullivanCotter partners with health care and other not-for-profit organizations to understand what drives performance and improve outcomes through the development and implementation of integrated workforce strategies. Using our time-tested methodologies and industry-leading research and information, we provide data-driven insights and expertise to help organizations align business strategy and performance objectives – enabling our clients to deliver on their mission, vision and values.

PODCAST | Impact of COVID-19 on Physician and APP Compensation Practices
BESLER | The Hospital Finance Podcast®
LISTEN TO PODCAST
Zach Hartsell, Principal, discusses some of the results from SullivanCotter's 2020 COVID-19 Physician and Advanced Practice Provider Compensation Practices Survey on the July 29, 2020 episode of the The Hospital Finance Podcast® with BESLER.
Highlights of this episode include:
- Background on SullivanCotter's COVID-19 survey series
- How organizations are handling furloughs and layoffs during the pandemic
- How cash compensation and benefits have been affected by the pandemic
- What are organizations looking at in terms of salary protections and incentive compensation for physicians?
- Some trends around redeployment and premium compensation for advanced practice providers
TRANSCRIPT
Mike Passanante: Hi, this is Mike Passanante and welcome back to the award-winning Hospital Finance Podcast®. Consulting firm SullivanCotter recently released survey results indicating that organizations are anticipating changes to physician non-productivity-based incentives in 2020. To discuss the study results, I’m joined by Zachary Hartsell, a principal at SullivanCotter. Zachary, welcome to the show.
Zachary: Michael, glad to be here. Thank you for inviting me.
Mike: Today we’ll be talking about the results of SullivanCotter’s COVID-19 Physician and Advanced Practice Provider Compensation Practices survey series. What were you looking at, specifically, in this survey? And who did you survey?
Zachary: Well, happy to discuss it, Michael. SullivanCotter has actually conducted two surveys on this topic, one in April and one in May. We conducted these survey to provide insight to our clients and to the market as to how organizations were responding to the pandemic from a workforce and total rewards perspective. Both surveys had over 100 participants, and we saw a 70% repeat in participation from the first to the second survey. Participating organizations had annual net revenue ranging anywhere from 400 million to 28 billion - representing many of the largest integrated, academic and pediatric hospitals and health systems in the country. The goal of the survey was to understand the changes that occurred or are being considered as it relates to physician and APP compensation practices. When we think about compensation, we think not only about cash compensation, but things like incentives, premium pay, and benefits. We also wanted to understand what kind of compensation plan changes organizations were considering as a result of the different workflows in response to the pandemic, such as redeployments, closed clinics, etc.
Mike: Got it. So let’s dig into something you just said there. What are you finding organizations are doing in terms of furloughs and layoffs at this point?
Zachary: Great question, Michael, and something that we often get. Contrary to the attention-grabbing headlines, most organizations are not furloughing or laying off their employed physicians or advanced practice providers. In fact, less than 10% of survey respondents had implemented layoffs or furloughs. What we’re seeing in place of that is nearly half of the organizations are instead reducing physician and/or APP compensation or considering changes to benefit programs like retirement plans, CME, etc. For the minority of organizations who have looked at furloughs or layoffs, the consistent trend we are seeing is that organizations are focusing more on temporary furloughs rather than layoffs, which seem a little more permanent. Additionally, these changes are impacting the staff physicians and APPs more than they are the APP or physician leaders. When we look at organizations that have implemented furloughs, on average, the duration lasts anywhere from about three to four weeks. I will say, though, since our survey release, through conversations with our clients and media reports, we are seeing an uptick in the need to have, in some markets, more workforce actions like furloughs and layoffs due to the continued financial strain and the lack of patient volumes. But this really varies market by market and organization by organization. In our experience, it seems to be in part due to the pre-COVID financial health of the organization. I think this will be really important to monitor in the coming weeks and months, as we hit additional surges and/or volumes don’t return as projected. And if that were to happen, we could see an increase in the prevalence of furloughs and layoffs. Whereas if volumes return greater than expected, we are going to see more returning to work and even potentially new hiring.
Mike: That would be optimal. Zachary, how have you found cash compensation and benefits? How have they been affected?
Zachary: We’ve been seeing changes in the way organizations are handling compensation of their APPs and physicians as a result of COVID. But it’s not just the COVID pandemic, it’s also the economic fallout from that. And again, like with furloughs and layoffs, these changes are occurring with a lot of variability and are really dependent on the degree of disruption the organization has experienced and the pre-COVID financial health of the organization. Now, within this, we have seen some things that we expect, and we’ve seen some surprises. For example, one surprise was that we have not seen a lot of premium pay for physicians or APPs working in frontline areas with only 10% of organizations reporting that they’ve considered or have implemented premium pay compensation. This was something that we were expecting a lot more of. Compensation protection for physicians were expected, and we see them present. As of May, about half the organizations implemented or were considering temporary compensation floors - and this is for the non-frontline physicians. This is understandable given the continued loss of volume and the loss of patient revenue. Interestingly, though, while half of the organizations were protecting physician compensation, this number actually decreased from the April survey by about 10% - indicating that some organizations that may have offered initial protections had lifted those protections. Benefits are another area where we are seeing organizations making changes. In our May survey, about 35% had implemented or were considering changes to benefit programs such as reducing or eliminating retirement plan contributions, reducing or eliminating CME funds or time off, or reducing PTO time.
Mike: Zachary, let’s talk specifically about physicians for a moment. What are organizations looking at in terms of salary protections and incentive compensation for them?
Zachary: As I mentioned above, it really is dependent on whether they were frontline providers– and I mean ED, critical care, hospital medicine, or non-frontline. As we said, for frontline providers, we saw very little in the way of premium compensation. For the organizations that did use a premium, we have seen a bit of an interesting shift. Initially, those were all applied as a percentage increase to the shift rate. But as financial situations have evolved, the structure of those premium payments has changed to a one-time stipend or bonus. We talked about non-frontline physicians and about half of organizations having cash compensation protection for physicians experiencing a loss of shifts or productivity as a result of the decrease in elective procedures or non-emergent visits. When you break down the detail and you look at the scope of the protection, about 40% of organizations were providing about 100% of historical cash compensation protection, about 40% were protecting between 75 and 90 percent of historical compensation, and anywhere from 5-15% were protecting somewhere in the neighborhood of 50-75% of historical compensation. So there was a significant amount of protection being offered. As organizations begin a slow recovery out of the COVID crisis and as people start to think about how they reconcile the health system financial sustainability, I think that these compensation protections are going to be more in the limelight. As we said, organizations are starting to lift them a bit and I think as protections linger on, or market conditions create the need for subsequent protections, we’ll likely see that the increase of organizations requiring repayment of these – currently it’s about 22%. But as this continues on, we may see more and more organizations requiring repayment. One last thing to talk about with physicians would be the incentive component. And when we talk about incentive, nearly 40% of organizations plan to modify physician incentive plans for the remainder of 2020. When we talk about incentives, though, in this context, we are specifically talking about non-productivity incentives - things such as value-based incentives or the system-wide incentives that physicians are eligible for, not the productivity incentives that we spoke about earlier. Additionally, about a quarter of organizations anticipate making future changes to the physician compensation plan as a result of the fallout from COVID-19.
Mike: Zachary, the work of many advanced practice providers was affected by COVID-19. Tell us about the trends you saw around redeployment and premium compensation for those providers.
Zachary: Well, as we discussed earlier, Michael, this is really interesting to me, being an advanced practice provider myself. I think that this has really been one of the "aha" moments organizations have experienced as a result of COVID - and that is the value that the flexibility of the APP workforce. For example, 71% of organizations have redeployed or plan to redeploy their non-frontline APPs into frontline specialties. And I’ll tell you anecdotally, that’s not just the ICU or hospital-based units. But it’s things like COVID screening clinics, telemedicine, infectious disease, and pulmonary medicine clinics. A critical consideration for organizations looking to redeploy their APPs is ensuring that they’re redeploying the APPs with the right skill set. This is incredibly important and can’t really be overlooked. This is often best accomplished through performing an organization-wide skill inventory of your APPs. Other important considerations when thinking about redeployment include clarifying emergency credentialing policies, reviewing staffing plans, and providing training for new care delivery and documentation requirements. On the compensation side, about half the organizations have made reductions to cash compensation with the average reduction of approximately about 10%. While APP incentive programs are not as common as with physicians, in our survey, about two-thirds did say that they have incentive plans. This is higher than what we typically see. Our May survey indicated that about a quarter of them were modifying their incentive plans. When we break down the data, that was fairly evenly split between modifying the plan, reducing the plan, or eliminating the incentive opportunity altogether. I think what we’re starting to see now is organizations thinking about the future. In our May survey, about 15% of organizations anticipated making changes to future APP compensation, as a result of COVID-19, with another 47% unsure. As the pandemic continues and as there is more clarity around the financial situation post-pandemic, I suspect we’ll have more organizations making decisions about whether they will be making future changes to APP compensation.
Mike: Do you have any recommendations for organizations that are revisiting their compensation packages for physicians and APPs as a result of the pandemic?
Zachary: This really may be a crossroads for physician and APP compensation as COVID-19 will serve as a referendum on the traditional compensation programs. We imagine that there will be organizations who will use this disruption to escalate the movement away from productivity-based compensation to more performance-based compensation. I’ll tell you, though - there will be other organizations that will see this as an opportunity to double down on productivity in order to try to see a quick financial recovery. I think for all organizations the overall question is, “Can you afford to return to the old model? Or is this time of disruption a chance to reset using a different formula?” I think the challenge that most organizations will face is how to make these long-term decisions when there are still so many unanswered questions. "How long will the COVID disruptions last? What’s going to happen to telehealth and the payments? What impact will the rise of the uninsured be on organizational finances?" And something else that has not been discussed as much but will have a big impact is the impending CPT coding changes and how these changes will impact organizational finances and physician compensation in the future. As healthcare organizations attempt to plan for these uncertainties, there’s going to be a need for more efficient operating models. I think there’ll be some right-sizing of cost structures and the reassessment of organizational processes and structures to become a little more clear. I think organizations should be thinking about taking inventory as, “Do you have a clear and consistent base performance and work expectations for all of your physicians and APPs? Do you have physicians and APPs working at the top of their license and training and aligned with desired outcomes like patient access, throughput, and quality? Do you have a compensation philosophy and a model for physicians and APP that is aligned with organizational goals, that is equitable, externally competitive, efficient, and easy to administer?" And most importantly, "Is it understandable to the physicians and APPs?" A clear compensation strategy that is paired with a clearly-defined performance and clinical work expectations are the critical components that leaders can utilize to hold the clinicians accountable, differentiate performance, and in turn, compensation in the future. As the COVID-19 pandemic continues to evolve, we will continue to monitor the market and provide updates to the trends we shared here today. I think these trends are important to keep an eye on and for organizations to consider while they’re analyzing their own compensation plans and financial positions.
Mike: Zachary, if someone wanted to read more about the study results, where can they go?
Zachary: Go to www.sullivancotter.com and look under our resources page. You can also follow SullivanCotter on LinkedIn, where we regularly post compensation trends and insights related to COVID-19 and physician and APP compensation. Finally, I’m happy to answer any specific questions at zacharyhartsell@sullivancotter.com.
Mike: Zachary Hartsell, thanks so much for stopping by today and talking with us on the Hospital Finance Podcast.
Zachary: Thank you again, Michael. I appreciate the invite.

Modern Healthcare |
Pandemic May Pound Lopsided Physician Pay Model Into Shape
Will pandemic-driven changes to physician compensation affect pay programs in the long-term?
In the early days of the COVID-19 pandemic, health care organizations were faced with a number of unprecedented challenges as in-person visits were delayed and elective surgeries postponed. Many responded by having to implement pay cuts, furloughs and/or layoffs - and the physician workforce was not immune to these changes.
Featured in a July 2020 edition of Modern Healthcare, SullivanCotter helps to evaluate how these pandemic-driven changes to physician compensation programs may indeed be a sign of more significant long-term changes to come if the current surge in cases and situation continues. Despite consistent year over year increases in total compensation, according to SullivanCotter's Physician Compensation and Productivity Survey, organizations will now need to reassess physician pay models in light of recent events to help maintain operations and support future sustainability.
READ FULL ARTICLE

SullivanCotter Webinar Series | Care Team Optimization
Hospitals and health systems nationwide continue to face a number of urgent financial and workforce challenges amidst an evolving global pandemic.
As organizations look for ways to increase access and manage recovering patient volumes, transform operations and ensure financial stability, focusing on the optimization of the care delivery team is imperative.
Contact us at info@sullivancotter.com to request the recordings from any of the three sessions.
(*Please note that these webinars are intended for health care provider organizations only)
Session 1: Building the Business Case for APP Optimization
Wednesday, August 19 | 12:00pm-12:45pm CT
In order to effectively optimize the care delivery team, organizations must understand both the barriers and keys to success, effective affiliation models, readiness indicators and more. SullivanCotter will also highlight real examples that show significant increases in revenue opportunity and patient visits through enhanced APP utilization.
SESSION 2: Data-Driven Care Model Design and Implementation
Tuesday, August 25 | 1:30pm-2:15pm CT
Designing care models with intention to help support optimization is a critical next step. During this session, SullivanCotter's overview of this process will include insight into redesign opportunities, effective change management, implementation planning and expected outcomes. Case studies will showcase real results tied to increased revenue, productivity, access and engagement.
SESSION 3: Compensation Strategies to Reinforce Optimization
Wednesday, September 2 | 12:00pm-12:45pm CT
In order to ensure lasting change, optimization requires strategic compensation programs to help reinforce care models, achieve organizational goals and drive desired results. This session will address the evolution of APP and team-based compensation models as well as highlight important considerations moving forward. Case studies will focus on the team-based incentive plans for primary care and specialty services.