
Press Release | SullivanCotter Welcomes Devin Paullin as SVP of Strategic Business Partners
We’re Expanding Our Leadership Team to Better Serve Clients
Devin Paullin joins the firm to fuel innovation and accelerate strategic partnerships across SullivanCotter and its sister organizations.
February 19, 2026 – CHICAGO – SullivanCotter, the nation’s leading independent consulting firm in the assessment and development of total rewards programs, workforce solutions, and data products for health care and not-for-profits, is pleased to announce the addition of Devin Paullin as Senior Vice President of Strategic Business Partners.
A proven health care industry leader, Paullin joins the firm to fuel innovation and accelerate strategic partnerships across SullivanCotter and its sister organizations, including Clinician Nexus, Lotis Blue, and C3 Nonprofit Consulting Group. In this role, he will focus on strengthening market alignment, listening closely to evolving client needs, and developing solutions that help organizations navigate an increasingly complex health care and not-for-profit landscape.
“Devin brings a rare combination of entrepreneurial vision, multifaceted health care industry experience, and operational discipline,” said Ted Chien, Chief Executive Officer, SullivanCotter. “His ability to listen to market needs, build meaningful partnerships, and translate strategy into measurable outcomes will help us continue delivering forward-looking solutions to our clients.”
Fueling Innovation Through Strategic Industry Partnerships
As health care organizations navigate workforce shortages, regulatory complexity, evolving care models, and increasing performance expectations, SullivanCotter continues to invest in capabilities that align closely with client needs.
By collaborating across the broader enterprise, Paullin will help ensure that insights from the marketplace enhance the value that SullivanCotter can deliver to clients in these challenging times.
A Proven Builder of High-Growth Health Care Organizations
Paullin joins SullivanCotter as a transformative health care executive with extensive experience building and scaling commercial organizations across health care technology, life sciences, health care insurance benefits, pharmacy services, physician practices, and in-home medical care.
“Health care organizations are seeking partners who not only understand compensation and workforce strategy, but who help them anticipate where the market is heading,” said Paullin. “I’m excited to collaborate across SullivanCotter and its sister organizations to strengthen partnerships, develop innovative solutions, and deliver measurable value to the clients and communities we serve.”
For more information, please visit www.sullivancotter.com, email info@sullivancotter.com, or call 888.739.7039.
About SullivanCotter
SullivanCotter partners with health care and not-for-profit organizations to improve performance through integrated workforce strategies. Using industry-leading data, expertise, and analytics, SullivanCotter helps organizations align compensation and workforce practices with their mission and goals.

On-Demand Webinar | Administrative Function Centralization: A Balanced and Strategic Approach
Structure smarter. Perform better.
Transform how your system’s administrative functions operate!
Labor shortages, financial pressures, and consolidation are forcing organizations to rethink how their administrative functions are structured.
Many consider centralization – or decentralization – without fully understanding how operating model decisions impact performance, cost, agility and stakeholder experience.
In reality, the most effective models are rarely one-size-fits-all. Leading health systems are moving beyond binary choices to adopt more nuanced, purpose-driven approaches.
In our short on-demand webinar, Sean Butler explores a more balanced and strategic approach to administrative function centralization by highlighting how hybrid models can help organizations align structure with strategy while managing risk and complexity.
Viewers will gain practical insights to help evaluate current models, identify opportunities for improvement, and make more informed decisions that support both near-term performance and long-term resilience.
Want to dive deeper?
Here’s the article that inspired this discussion!
Operating a health system is complicated, especially with today’s evolving labor challenges and rising costs. It’s why many organizations are streamlining their workforce strategies by centralizing certain teams and support functions. Discover how you can approach centralization within your organization, and learn about its powerful impact on base payroll cost, span of control, headcount distribution, and more.
Sign up for instant access to the recording:

INFOGRAPHIC | APP Leadership Insights: Compensation Trends
APP leadership plays a critical role in clinical performance and organizational strategy.
Our latest infographic shares the latest APP leadership insights – including compensation, premium pay, incentives and more.
Advanced practice provider leadership roles continue to evolve as organizations place greater emphasis on clinical integration, operational oversight and strategic alignment. This infographic highlights current national benchmarks and emerging trends in APP leader compensation – illustrating how pay structures, premiums and incentive practices vary by leadership level.
Drawing on the latest survey data from our APP Compensation and Productivity Survey, it offers organizations a clear, data-driven view of how APP leadership compensation is being designed across the market.
See what the data shows!
—
Don’t Forget: the 2026 Survey is Open for Participation!
Secure exclusive pricing and benefits when you submit data to this year’s survey.
Need a quick summary?
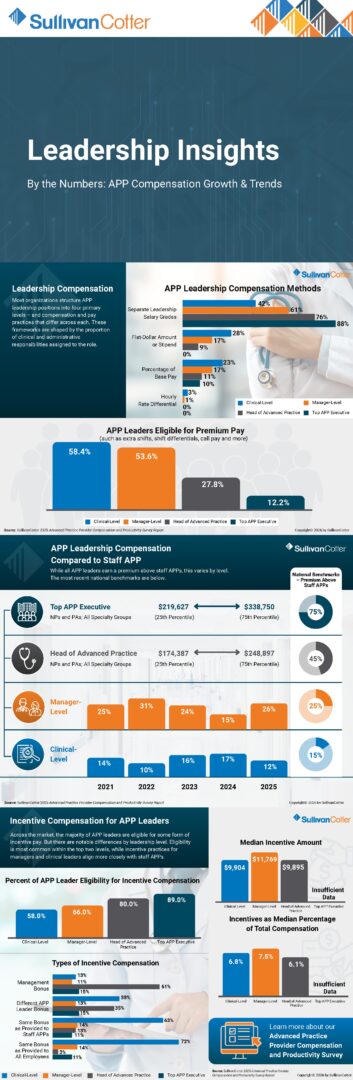
APP Leadership Compensation
- Most organizations structure APP leadership positions into four primary levels – and compensation and pay practices that differ across each.
- These frameworks are shaped by the proportion of clinical and administrative responsibilities assigned to the role.
- 88% of organizations have separate leadership salary grades for top APP executives.
- 28% of clinical-level leaders are paid a flat-dollar amount or stipend.
- Eligibility of premium pay – such as extra shifts, shift differentials, call pay and more – is highest for clinical-level leaders (58.4%) and manager-level leaders (53.6%) and declines to 27.8% for heads of advanced practice and 12.2% for top APP executives.
APP Leadership Compensation Compared to Staff
- While all APP leaders earn a premium above staff APPs, this varies by level.
- The most recent national benchmarks indicate that pay for top APP executives ranges from $291,627 at the 25th percentile and $338,750 at the 75th percentile – this is 75% above staff APPs.
- This premium above staff APPs declines to 45% for heads of advanced practices, 25% for manager-level APP leaders, and 15% for clinical-level leaders.
Incentive Compensation for APP Leaders
- Across the market, the majority of APP leaders are eligible for some form of incentive pay – but there are notable differences by leadership level.
- Eligibility is most common within the top two levels, while incentive practices for managers and clinical leaders align more closely with staff APPs.
- 89% of top APP executives are eligible for incentive compensation – this declines to 80% for heads of advanced practice, 66% for manager-level leaders, and 58% for clinical-level leaders.
- Median incentive amounts are highest at the manager-level at $11,769. This is 7.5% of total cash compensation.
KEY TAKEAWAYS
- APP leadership compensation is highly stratified by role level. Most organizations differentiate pay frameworks across four leadership tiers – clinical-level, manager-level, head of advanced practice and top APP executive—reflecting increasing administrative scope and accountability.
- Separate leadership salary grades dominate at senior levels. While clinical- and manager-level leaders are more likely to receive stipends or percentage-based premiums, the majority of head of advanced practice and top APP executive roles are compensated through distinct leadership salary grades.
- Leadership roles command meaningful premiums over staff APP pay. Compensation premiums increase with leadership level, reaching approximately 45% for heads of advanced practice and up to 75% for top APP executives compared to staff APP benchmarks.
- Eligibility for incentive compensation rises with seniority. Incentive participation is most prevalent among the top two leadership levels, while incentive practices for clinical- and manager-level leaders more closely resemble those of staff APPs.
- Incentive design varies by level and organization. Management bonuses, role-specific APP leader incentives and shared enterprise-wide bonus programs are all common, underscoring the need for thoughtful alignment between leadership responsibilities and reward structures.
Learn more about our APP Compensation and Productivity Survey!
This survey provides organizations with the critical data they need to systematically track and benchmark market changes, which in turn helps managing strategic and financial planning for continued growth and success.
- Base pay, total cash compensation and total cost of benefits
- Productivity data and ratios, including collections and work RVUs
- Pay practices, including salary grades and ranges, shift differentials and extra shifts, on-call pay, education expenses, sign-on bonuses, retention bonuses and moving allowances
- APP incentive plan design, including prevalence and performance measures
- Data reported for nurse practitioners and physician assistants across multiple specialty groups
- Data also reported for certified anesthesiologist assistants, certified registered nurse anesthetists and certified nurse midwives
- Data reported both nationally and regionally by practice setting (inpatient/outpatient) and locale (urban/suburban/rural)
- Total cash compensation data for a number of APP leadership positions

VIDEO | Addressing the Aging Physician Workforce
Discover how we can help you bridge the gap between patient demand and physician supply!
By 2030, approximately 20% of the total US population will be 65 or older.
This is a 14% increase from today. These Medicare-eligible seniors continue to have longer life expectancies and are higher utilizers of health care services.
As this population grows, and the aging physician workforce nears retirement – this creates a significant gap between patient demand and physician supply across all specialties.
In this short video, Jaclyn Zurawski explores how organizations can accurately assess changing service needs and clinical workforce staffing requirements with a comprehensive provider needs assessment.
Reach out to learn more...
Partner with SullivanCotter to determine the right number and type of physicians and APPs required to operate effectively in your community!
Video Transcript
Hi, my name is Jaclyn Zurawski. I’m a Principal with SullivanCotter and have been with the firm for 8 years. My focus is on workforce strategy, and I lead our Provider Needs Assessment team.
By 2030, approximately 20% of the total US population will be 65 or older. This is a 14% increase from today. These Medicare-eligible seniors continue to have longer life expectancies and are higher utilizers of health care services. As the population ages, so do the physicians caring for these patients. 25% of all physicians will reach retirement age by 2030.
This creates a significant gap between patient demand and physician supply across all specialties.
The makeup of the population and physicians varies market to market, and therefore, it is imperative that health care systems have an accurate understanding of the market need, and the age and productivity levels of the physicians practicing in their specific markets to ensure proactive succession plans are in place to fill the gaps and meet patient demand in the coming years.
Accurately assessing changing service needs and clinical workforce staffing requirements is critical as market-specific supply and demand continue to evolve. In addition to determining the right number and type of physicians and advanced practice providers required to operate effectively in the communities they serve, organizations must also address other needs from their workforce planning initiatives.
This includes monitoring potential retirements and reductions in clinical productivity levels to help inform succession planning needs. As more physicians ease into retirement over the next 3-5 years and early-career physicians place greater value on work-life balance than past generations, having a succession plan in place can help fill key vacancies and support your organization’s overall talent strategy.
At SullivanCotter, we partner with health systems across the country to provide accurate, data-driven provider needs assessment insights to identify the greatest gaps in the local markets, ensure proactive physician succession plans are in place, and develop long-term recruitment and retention strategies to meet demand in the coming years.

Case Study | Anesthesiology: Negotiating Professional Services Agreements
We can help you to assess and improve your performance of your professional services agreements.
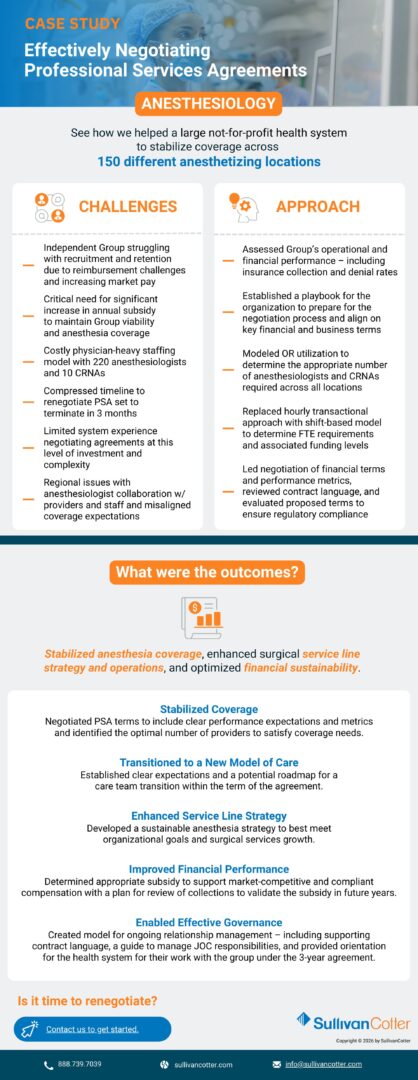
See how we helped a large not-for-profit health system to stabilize coverage across 150 different anesthetizing locations!
Determining how to align and engage anesthesiologists is critical to developing effective clinical partnerships and ensuring anesthesia teams are fully integrated. Strong alignment supports collaboration across surgical services, quality and safety initiatives, and workforce planning, while enabling anesthesiology groups to identify opportunities for continuous improvement and help health systems achieve key strategic and financial objectives.
These efforts can be supported by developing the right anesthesiologist–hospital affiliation models to address evolving workforce needs, including coverage requirements, care team optimization, subspecialty expertise, and call responsibilities.
While professional services agreements (PSAs) can be an effective strategy for securing and stabilizing anesthesia coverage, health systems must ensure these arrangements are structured to support operational efficiency, compliance, and long-term financial sustainability.
What were this system’s challenges, how did we approach them, and what were the outcomes?
CHALLENGES
- Independent Group struggling with recruitment and retention due to reimbursement challenges and increasing market pay
- Critical need for significant increase in annual subsidy to maintain Group viability and anesthesia coverage
- Costly physician-heavy staffing model with 220 anesthesiologists and 10 CRNAs
- Compressed timeline to renegotiate PSA set to terminate in 3 months
- Limited system experience negotiating agreements at this level of investment and complexity
- Regional issues with anesthesiologist collaboration w/ providers and staff and misaligned coverage expectations
APPROACH
- Assessed Group’s operational and financial performance – including insurance collection and denial rates
- Established a playbook for the organization to prepare for the negotiation process and align on key financial and business terms
- Modeled OR utilization to determine the appropriate number of anesthesiologists and CRNAs required across all locations
- Replaced hourly transactional approach with shift-based model to determine FTE requirements and associated funding levels
- Led negotiation of financial terms and performance metrics, reviewed contract language, and evaluated proposed terms to ensure regulatory compliance
OUTCOMES
- Stabilized Coverage: Negotiated PSA terms to include clear performance expectations and metrics and identified the optimal number of providers to satisfy coverage needs.
- Transitioned to a New Model of Care: Established clear expectations and a potential roadmap for a care team transition within the term of the agreement.
- Enhanced Service Line Strategy: Developed a sustainable anesthesia strategy to best meet organizational goals and surgical services growth.
- Improved Financial Performance: Determined appropriate subsidy to support market-competitive and compliant compensation with a plan for review of collections to validate the subsidy in future years.
- Enabled Effective Governance: Created model for ongoing relationship management – including supporting contract language, a guide to manage JOC responsibilities, and provided orientation for the health system for their work with the group under the 3-year agreement.
Is it time to renegotiate?
Professional services agreements are an integral part of a health system’s physician and service line strategy.
Selecting the appropriate model, designing effective terms, and monitoring compliance and performance are critical to driving desired results.
Contact us to see how we can support you!

VIDEO | Physician Compensation Administration: Developing a More Strategic Approach
Strengthen physician compensation administration with insights from our experts.
We can help you scale smarter and reduce risk!
Health systems continue to grow…but physician compensation administration programs often struggle to keep pace.
Many organizations find themselves reacting with minimal standards and limited governance, leading to more exceptions, less transparency, and increased risk. In a complex and resource-constrained environment, this can undermine trust and strain compensation teams.
In this short video, Joe Davio explores how organizations can move toward a more advanced stage of compensation program maturity – one that improves reliability, efficiency, and provider engagement.
Reach out to learn more...
Partner with SullivanCotter to strengthen your provider workforce compensation programs!
Video Transcript
My name is Joe Davio. I am a Consulting Manager at SullivanCotter and I work with clients to assess and reimagine their compensation programs to improve team performance, create high reliability, and lower overall risk.
Over the past decade, the market has seen significant consolidation, resulting in sizable medical groups. This has subsequently led to health system challenges in managing such a large provider compensation program in a strategic and efficient manner. This is especially challenging in a dynamic environment like health care, where provider work varies and the compensation models to support them are inherently different. In addition, organizations are facing resource constraints around staffing, technology, and budget.
As organizations have grown rapidly, we’re commonly finding that they are operating in an initial stage of maturity and reacting with minimal provider compensation standards and insufficient governance. This often leads to more exceptions, a lack of transparency, and a culture of ambiguity or distrust towards the compensation program, regardless of the integrity or intent of the compensation program’s leadership.
In an ideal state, organizations are operating in a more advanced stage of maturity by focusing proactively on people, process, and technology. Of course, each organization is unique and there is no one-size-fits-all solution. So where do you start? We lead clients through a three-step process to create an ideal compensation program.
- First, we conduct a current state assessment of the overall compensation program, which is intended to identify strengths and opportunities.
- Next, we use the assessment to inform a holistic and prioritized project plan to address the organization’s needs that considers risk, feasibility, and interdependent value creation. These initiatives are designed and prioritized to be complementary in nature, maximizing value and lowering risk, ultimately moving organizations to a more advanced stage of operating maturity.
- Step three is design and implementation. Here an organization begins to see the benefits of a strong compliance program where governance is well-defined and consistently applied. The compensation program is standardized and aligned to the organization’s strategic plan, and the compensation team is functioning efficiently – producing timely and reliable results.
Ultimately, the ability to function within this advanced stage of maturity leads to both optimized physician compensation administration and resource efficiency. Improved transparency and reliability create a better understanding and trust among providers, producing the ultimate goal of increased provider engagement.
If your organization is ready to take a strategic approach to physician compensation administration, we would love to partner and help you realize your full potential.
Contact us to learn more about how we can help you strengthen your physician compensation administration processes!

Press Release | SullivanCotter and Lotis Blue Release 2026 Health Care Workforce Retention Study
The Science of Staying: The Next Chapter in Clinician Retention
New Research Reveals Why Stabilized Turnover Still Puts Health Systems at Risk and What Leaders Must Do Next
January 29, 2026 – CHICAGO – SullivanCotter and Lotis Blue Consulting have released The Science of Staying: The Next Chapter in Clinician Retention, a national study examining the psychological forces shaping health care professionals’ decisions to stay, consider leaving, or quit their jobs. Drawing on responses from more than 1,000 licensed, patient-facing clinicians – including physicians for the first time, alongside nurses, advanced practice providers (APPs), and other clinical roles – across more than 300 health care organizations, the research offers a timely assessment of workforce commitment heading into 2026.
While turnover has slowed from pandemic-era highs, the study finds that stabilization has not translated into recovery. Capacity constraints, sustained burnout, and misalignment between clinicians and their organizations continue to erode engagement, productivity, and access to care. The findings underscore that retention decisions now sit at the center of health system performance, with direct implications for financial resilience, patient experience, and long-term viability.
“This research makes clear that fewer exits do not mean a healthier workforce,” said Erica Grant, partner at Lotis Blue Consulting and co-author of the study. “Stabilized turnover doesn’t equal recovery. Workforce shortages, financial constraints, operational pressures, and access challenges are intensifying internal tension, and that tension is increasingly visible in engagement, productivity, and the ability to deliver reliable care.”
The 2026 study builds on an Employee Value Proposition (EVP) framework, now expanded to measure 38 factors across eight dimensions, including new physician-specific drivers. Using independent national polling paired with predictive analytics, the research identifies which aspects of the EVP most strongly influence clinicians’ likelihood of staying, considering leaving, or quitting, with predictive accuracy of up to 85%.
Key findings from the study include:
- Among surveyed clinicians, 80% intend to stay, 11% are considering leaving, and 9% reported quitting a health care job in the past year, a marked decline from the prior study. Notably, nearly 60% of departures were driven by job-related factors, reinforcing that much of today’s turnover risk remains within organizational control.
- Staying decisions are anchored in a work environment that delivers security, belonging, purpose, and sustainability.
- Early disengagement – or considering leaving – begins when clinicians become overstretched, undervalued, or stagnant.
- Quitting decisions occur when work becomes incompatible with clinicians’ values and the motivations that drew them to medicine in the first place.
- Physicians report lower quit rates than other clinical roles, but their commitment is most strongly anchored in trust in clinical discretion, perceived fairness in compensation, and frictionless practice conditions.
- Clinicians with less than one year of service continue to leave at meaningfully higher rates than the overall workforce, underscoring the outsized impact of onboarding, workload design, and early support on long-term commitment.
“This is no longer about chasing engagement scores or reacting to exits after they happen,” said Aaron Sorensen, PhD, partner at Lotis Blue Consulting and co-author of the study. “Retention has become a leading indicator of operational stability. When organizations get the EVP right, they protect capacity, reduce avoidable cost, and create the conditions for clinicians to do their best work.”
A defining feature of this year’s research is a dedicated deep dive into physician retention, which highlights the central role of trust in clinical discretion, a newly measured element in this year’s study. Physician retention is highly sensitive to how organizations enable autonomy, trust, and day-to-day practice conditions. The study finds their decisions are more heavily impacted by the conditions under which care is delivered and professional judgment is exercised, rather than on schedule or workload alone.
“Physicians experience retention pressure differently, and the loss of a physician creates ripple effects across care teams, access, and system performance,” Grant added. “This study gives leaders the precision they need to invest in the few levers that truly matter, especially for the clinicians who are most costly to lose.”
The research also underscores the critical role of early tenure in shaping long-term workforce stability. Clinicians’ first year on the job emerges as a decisive window, as early experiences set the psychological contract that influences whether individuals remain committed or begin to disengage. While first year quit rates have declined from prior peaks, they remain meaningfully higher than the overall average, highlighting the outsized impact of onboarding, workload design, and early support on long-term retention.
“Health systems that continue to manage retention as a downstream workforce issue are missing the moment,” Grant said. “The data point to a clear mandate: design work that is sustainable, align rewards and growth with reality, and rebuild trust where it has been strained. The organizations that act with that level of intention will be far better positioned for what comes next.”
The 2026 Science of Staying: The Next Chapter in Clinician Retention is designed to help health system leaders move beyond anecdote toward evidence-based action, offering a roadmap for stabilizing capacity, strengthening clinician commitment, and restoring momentum at a time when the margin for error has narrowed.
Find the full report at The Science of Staying: The Next Chapter in Clinician Retention.
About SullivanCotter
SullivanCotter partners with health care and not-for-profit organizations to improve performance through integrated workforce strategies. Using industry-leading data, expertise, and analytics, SullivanCotter helps organizations align compensation and workforce practices with their mission and goals.
About Lotis Blue Consulting
Lotis Blue is committed to helping organizations forge strong connections between workforce, leadership, and organizational performance. With deep expertise in data and behavioral science, we deliver insight-driven solutions tailored to each client’s unique challenges.

The Science of Staying: The Next Chapter in Clinician Retention
REPORT: 2026 Health Care Workforce Retention
See what’s driving clinician commitment in 2026!
While turnover may be stabilizing, fewer exits do not mean a healthier and more committed workforce. Your patient-facing clinicians – including physicians, nurses, advanced practice providers, and other licensed professionals – are still under strain.
New research from SullivanCotter and our sister organization, Lotis Blue Consulting, highlights which factors most strongly influence a clinician’s decision to stay, consider leaving, or quit.
This innovative report draws on feedback from more than 1,000 clinicians across 300+ health care organizations nationwide to provide the latest look into the psychological drivers behind turnover and clinician retention. It includes insight into 38 different elements of the Employee Value Proposition.
Download the free report for access to critical data such as:
- Among surveyed clinicians, 80% intend to stay, 11% are considering leaving, and 9% reported quitting a health care job in the past year, a marked decline from the prior study.
- Notably, nearly 60% of departures were driven by job-related factors, reinforcing that much of today’s turnover risk remains within organizational control.
- Staying decisions are anchored in a work environment that delivers security, belonging, purpose, and sustainability.
- Early disengagement begins when clinicians become overstretched, undervalued, or stagnant.
- Quitting decisions occur when work becomes incompatible with clinicians’ values and the motivations that drew them to medicine in the first place.
- Physicians report lower quit rates than other clinical roles, but their commitment is most strongly anchored in trust in clinical discretion, perceived fairness in compensation, and frictionless practice conditions.
- Clinicians with less than one year of service continue to leave at meaningfully higher rates than the overall workforce, underscoring the outsized impact of onboarding, workload design, and early support on long-term commitment.
Hear straight from our experts:
“Stabilized turnover doesn’t equal recovery. Workforce shortages, financial constraints, operational pressures, and access challenges are intensifying internal tension, and that tension is increasingly visible in engagement, productivity, and the ability to deliver reliable care.”
Erica Grant, Partner, Lotis Blue Consulting
—
“Retention has become a leading indicator of operational stability. When organizations get the employee value proposition right, they protect capacity, reduce avoidable cost, and create the conditions for clinicians to do their best work.”
Aaron Sorensen, Senior Partner, Lotis Blue Consulting
Download the report!

INFOGRAPHIC | Physician Compensation Trends in Community Health Systems
Insights from SullivanCotter’s Physician Compensation and Productivity Survey
The pressure on financial sustainability continues to increase for community health systems. Lower professional collections per wRVU and higher total cash compensation (TCC) per wRVU when compared to the national average increases the financial support community health systems must provide to maintain their employed medical staff.
Turn insight into action with the right data!
Compensation
When compared to national averages, physician TCC per wRVU is higher in community health systems across all specialty categories. However, collections per wRVU for physician services are lower than national averages, indicating that physicians within community health systems are paid more for each wRVU they generate and for each professional services dollar collected than national averages.
Median Annual TCC per wRVU and Collections per wRVU
(Percent Difference Compared to National Averages)
- Primary Care: TCC per wRVU: 7.1% – Collections per wRVU: -9.9%
- Medical: TCC per wRVU: 2.3% – Collections per wRVU: -6.1%
- Surgical: TCC per wRVU: 3.0% – Collections per wRVU: -6.3%
- Hospital-Based: TCC per wRVU: 6.1% – Collections per wRVU: 2.3%
- Aggregate: TCC per wRVU: 3.6% – Collections per wRVU: -6.3%
Clinical Work Hours and Call Coverage
Hospital-based specialties in community health systems are required to work more annual hours than national averages, but are also more likely to be paid for their call coverage hours.
Median Annual Clinical Work Hours Required for 1.0 FTE in Hospital-Based Specialties
(Percent of National Average)
- Emergency Medicine: 106.7%
- Pediatrics – Hospitalist: 106.5%
- Critical Care Medicine: 104.3%
- Hospitalist: 104.3%
- Urgent Care: 102.0%
- Neurology – Neurocritical Care: 101.6%
Call Pay Prevalences for Full-Time Clinical Staff Physicians
(Percent Paying)
- Hospital-Based: Community Health Systems: 14.6% – National: 7.9%
- Medical: Community Health Systems: 14.0% – National: 8.4%
- Primary Care: Community Health Systems: 9.4% – National: 5.4%
- Surgical: Community Health Systems: 27.5% – National: 17.1%
Student Loans
Community health systems offer student loan repayments more frequently than the national average, suggesting more difficulty in recruitment.
Student Loan Repayment Used for Staff Physicians
Community Health Systems
- Offer for all new hires: 24.0%
- Offer for select specialists: 8.0%
- Offer as needed: 34.0%
- Do not offer: 34.0%
National
- Offer for all new hires: 11.7%
- Offer for select specialists: 9.2%
- Offer as needed: 31.3%
- Do not offer: 47.9%
How can community health systems address these challenges?
Carefully Balanced Compensation Design and Recruitment
- Implement core performance expectations – including a minimum level of service tied to base salary as a requirement before any potential incentive is paid
- Align productivity incentive eligibility with financial affordability with a specific focus on the retention of high performers
- Include non-productivity incentives, such as physician and APP care coordination, that are aligned with payer performance incentive dollars
- Ensure advanced practice provider (APP) compensation program is externally competitive and aligned closely with the physician plan
Thoughtful Workforce Planning
- Update provider needs assessments for physicians and APPs regularly to anticipate recruitment needs and allow plenty of time to recruit
- Focus on recruitment and retention within the local community – including incumbents and training programs with geographic ties to candidates
- Considering the high cost to replace providers and staff, ensure that succession planning is proactive and coordinated
Performance Enhancement
- Use collaborative care models to ensure top-of-license practice for all providers and care team members
- Reward team-based care with shared incentives
- Improve patient access via joint panels, maximizing APP scheduling, and more Implement compensation management software to reduce administrative burden and build trust between administration and providers


Chief Healthcare Executive | Leadership Competency Models
Why do health systems need leadership competency models more than ever?
Learn more from our experts at our sister organization, Lotis Blue Consulting
In today’s rapidly changing health care environment, organizations face a convergence of pressures – from workforce shortages and financial constraints to regulatory shifts and care model redesigns – that demand more from leaders than ever before. Without a clear framework for what effective leadership looks like within a health system, organizations risk inconsistent talent development, subjective promotion decisions, and misaligned expectations.
A leadership competency model offers a strategic solution by defining the behaviors, skills, and mindsets that leaders need to succeed in a specific context. Unlike generic leadership checklists, an effective model translates a health system’s mission, culture, and strategic objectives into observable expectations that can be embedded in everyday talent practices.
Health systems that adopt these models gain clarity and alignment across leadership levels, which supports intentional hiring, coaching, performance evaluation, and succession planning. Core competencies emerging across the sector — such as change leadership, enterprise-wide strategic thinking, collaboration, and talent development — reflect both the evolving demands of health care and the shift from traditional technical expertise to leadership grounded in emotional intelligence and system-wide influence.
Competency models are not static documents. The most impactful ones are dynamic – tailored to organizational strategy, developed with broad stakeholder input, and routinely refreshed to stay aligned with future needs. Developing and living by a leadership competency model isn’t just best practice, it’s foundational to advancing health system performance and building resilient leaders capable of guiding transformation.
Key Takeaways
Why leadership competency models matter:
- Define what great leadership looks like in your organization.
- Create consistent expectations and a shared leadership language.
- Reduce bias and inconsistency in talent decisions.
Emerging leadership priorities in health care:
- Leading change and fostering innovation.
- Strategic thinking and system-level perspectives.
- Collaboration and relationship building.
- Talent development and coaching.
- Mission alignment, accountability, and values-based leadership.
What makes leadership competency models effective
- Anchoring competencies in strategy and culture.
- Engaging diverse leaders in development.
- Defining observable behaviors, not just abstract concepts.
- Embedding into hiring, performance, and succession processes.
- Revisiting and evolving the model over time.

On-Demand Webinar | 2025 Health Care Staff Compensation Insights
Power your health care staff compensation programs with data that drives results!
Explore the latest data with us…
With workforce shortages showing no signs of stopping, hospitals and health systems must attract, retain, and motivate key employees with confidence.
Turn insight into impact with the latest compensation benchmarks!
The results from our annual Health Care Staff Compensation Survey reveal that the market is moving. Median base pay for health care staff positions rose 4.3% in 2025, up from 2.7% in 2024 — a notable increase reflecting ongoing labor market pressures and the need to remain competitive in recruiting and retaining talent. Clinical Support and Technical roles are leading the way with a year-over-year increase in base hourly rates of 5.1%, while Registered Nursing is close behind at 4.9%
Dive during into the data – which includes data from more than 2,660 organizations on nearly 2.5 million incumbents!
During this impactful session, our panelists will:
- Discuss emerging trends in compensation for both key clinical and non-clinical staff-level roles
- Provide insight into premium and variable pay programs
- Address frontline staffing shortages and how organizations are tackling recruitment and retention challenges with data from our latest pulse survey
See some snapshots from this year's data!
Base Hourly Rates
Salary Budgets and Structure Adjustments
Market Adjustment Trends
Job Pay Changes
Sign up for instant access to the recording:

FORBES | Health Care Access, Labor, and Compensation Challenges
The past year was challenging for many health systems.
What should health care leaders focus on in 2026 to balance quality care with financial viability?
Accessible, high-quality care is a cornerstone of healthy communities — yet achieving it has become increasingly difficult amidst rising demand for services, persistent labor shortages, and outdated compensation frameworks.
At the heart of the issue is a fundamental imbalance: organizations are struggling to deliver timely care because they can’t recruit and retain sufficient clinical and support staff. Labor shortages not only compromise health care access, but also drive up costs and, ultimately, negatively impact patient outcomes.
In his recent article for Forbes, SullivanCotter’s President and CEO, Ted Chien, calls attention to the need for innovative and strategic workforce planning that places equal emphasis on labor sustainability and financial viability.
He outlines three critical areas health systems can focus on as they navigate this complex environment:
Adopting New Business Models To Boost Health Care Access
- Rethink traditional care delivery models to better utilize clinician time
- Explore partnerships with innovative and membership-based care models
- Reassess the role of virtual care to improve reach, reduce emergency department utilization and support underserved populations
Alleviating Labor Challenges
- Recognize that workforce shortages are not short-term disruptions, but structural issues
- Avoid over-reliance on layoffs, which may weaken long-term growth and care quality
- Use technology, including AI-enabled tools, to improve operational efficiency, scheduling and workforce productivity
- Focus on strategies that reduce burnout and support a more sustainable workforce
Rebalancing Skills and Compensation
- Move beyond compensation structures based solely on tenure, volume or traditional productivity metrics
- Align pay with specific skills, competencies and organizational priorities
- Support value-based care by rewarding quality, outcomes and long-term performance
- Consider skills-based compensation approaches to better attract, engage and retain talent
Solving health care access and workforce challenges requires integrated, forward-looking strategies that align care delivery, labor planning and compensation design. Health care organizations that take a holistic approach will be better positioned to build resilient workforces, improve access for patients and succeed in an increasingly complex health care landscape.

How AI Will Shape the Future of Health Care In 2026
The year ahead will test how quickly health care organizations can turn AI ambition into real change.
The future of health care is here. Are leaders prepared for the rapid pace at which this transformation is unfolding?
By Aaron Sorensen, Senior Partner at Lotis Blue Consulting – in partnership with SullivanCotter
Originally published by Healthcare Business Today
AI is advancing at a pace that defies intuition. Most people think in linear terms: steady, incremental progress. But AI is improving exponentially. The capabilities of AI models are increasing even as computing becomes faster and cheaper – and these forces compound each other. As Jensen Huang, CEO of Nvidia, noted in a recent interview, “Every new generation of AI is not just better; it is building the next generation.” Progress is literally layering on itself, as he points out that AI tools have become “100 times more powerful” in just two years.
This is why many describe the moment as a new Industrial Revolution. In the past, machines replaced physical labor. Today, AI is taking on tasks that once required human cognition and judgment. As models continue to advance, computation costs will decline, and applications will start to become more abundant and integrated into the foundations of daily life. Some estimates suggest that AI may soon play a dominant role in generating first-pass summaries, drafts, analyses, translations, and technical scaffolding that underpin modern knowledge work.
And by the latter half of the decade, the convergence of AI and robotics will reshape physical work as well, from logistics and pharmacy operations to elements of clinical workflow. AI agents will coordinate tasks, initiate next steps, and remove friction across complex clinical and administrative workflows and systems. It seems inevitable that autonomous vehicles will pick up patients at their homes, drive to appointments, and robots will take on the role of patient access specialists and care coordinators, both in and outside the home, in the not-too-distant future.
The question for health care is no longer whether AI will transform the workforce, but whether organizations will be ready for the speed of the shift already underway.
Health Care as an Industry Is Behind the Curve
Despite AI’s rapid evolution, health care has traditionally been slower to adopt it – particularly in clinical roles where the impact could be most significant. While new research shows that this may be starting to change, deeply risk-averse cultures, complex regulations, and fragmented data have created a protective posture that sometimes slows experimentation and rewards caution within the industry.
Abdelwanis and colleagues, in a recent Safety Science review, aptly captured this reality: “Organizational challenges such as infrastructure limitations, inadequate leadership support, and regulatory constraints remain significant barriers to AI adoption in clinical practice.”
Meanwhile, other industries have moved forward. A decade ago, self-driving cars were treated as implausible. Today, full self-driving capability demonstrates that iterative improvement, despite setbacks, can lead to meaningful autonomous performance. Tesla’s vehicle safety data shows that vehicles operating with Full Self-Driving experience substantially fewer collisions than national human-driving benchmarks. Progress didn’t come from avoiding risk; it came from learning through it.
Health care has struggled to build similar momentum – and for good reason. Although AI can already outperform humans in pattern recognition, summarization, and administrative processing, adoption is slowed by concerns about safety, changes to professional roles, unclear regulatory pathways, and in some cases, patient uneasiness in utilizing AI for care delivery. Payers also introduce administrative friction that could be alleviated by AI and automation. However, the deeper issue is structural. The industry must balance its commitment to patient safety while exploring the appropriate incentives and operating models necessary to accelerate responsible innovation around AI.
Changing the Narrative – From Fear to Elevating Purpose and Practice
To move forward, health care must shift its narrative about AI. Much of today’s discourse centers on risk. Will AI make mistakes? Will roles be diminished? Will the clinician’s craft be devalued? However, this framing overlooks the real opportunity: returning people to the purpose of their work, rather than the tasks that have accumulated around it.
Huang articulated this distinction clearly during a recent interview by arguing that jobs are built around a core purpose: creating value or addressing a human need. But over time, layers of tasks accumulate, documentation grows, and administrative work expands. Eventually, the mechanics of the job overshadow its purpose and the meaning that humans derive from it. AI’s real power, Huang suggested, is not in replacing people, but in stripping away everything that was never the point of the job in the first place.
To illustrate the idea, Huang revisited a widely cited prediction made nearly a decade ago. In 2016, Geoffrey Hinton, often referred to as the “godfather of AI,” warned that people should reconsider training as radiologists because AI would soon outperform humans in image recognition. At the time, the prediction fueled concerns that AI would render the profession obsolete entirely. The irony, Huang noted, is that the opposite has happened. The number of radiologists has increased, and today, nearly every radiologist utilizes AI in some capacity.
The explanation lies in returning to purpose. The purpose of a radiologist is not to study images for their own sake; it is to diagnose disease. Image analysis is a task in service of that goal. As AI has made image interpretation faster and more precise, radiologists have been able to read more studies, handle greater complexity, and support higher clinical volumes. Better productivity has improved economics for hospitals, which in turn has driven demand for more, not fewer, radiologists.
Recent workforce projections published in the Journal of the American College of Radiology suggest continued growth in the U.S. radiology profession over the coming decades. Furthermore, meaning and purpose, as evidenced by decades of research in the psychological literature, represent the highest-order drivers of engagement and joy from work.
The lesson extends well beyond radiology. Clinicians did not go into medicine to type notes, navigate prior-authorization portals, or click endlessly through EHR menus. These tasks are artifacts of the system, not expressions of clinical purpose. When AI automates documentation, coding, summarization, scheduling, pattern matching, and protocol retrieval, clinicians can operate more consistently at the top of their license – diagnosing, interpreting, communicating, and caring.
This shift is more than just cultural – it’s structural. AI becomes the first draft of everything. The assistant works ahead of the clinician, not behind. The system tracks what matters so humans can focus on what matters most.
What to Expect in 2026 – How AI Will Reshape the Workforce
If recent years were marked by pilots and experimentation, 2026 will be the year AI becomes integrated into the everyday fabric of health care work. AI will also begin to show a step-change impact in health care by moving from information gathering and pattern recognition to reasoning and judgment. The shift will be apparent in current and new health care jobs, leadership expectations, care models, team structures, workforce strategies, learning programs, and daily workflows.
In 2026, the most visible clinical workforce impact will be in the administrative “time sinks” that divert clinicians away from patient care. Research examining physician workflow and time allocation found that documentation and administrative work consume nearly twice as much time as direct patient care.
The biggest shift is that AI will increasingly produce the first draft of clinical work (notes, summaries, and orders), while clinicians concentrate on higher-level tasks such as validation, interpretation, and decision-making.
Ambient technology will rapidly improve and listening and documentation will become mainstream. Evidence is already accumulating that ambient documentation technology is associated with reduced clinician burnout and improved well-being. In practice, this means physicians and APPs will spend less time in the EHR after hours and more time with patients (and with clinical reasoning and decision-making rather than administrative clerical work).
Decision support will expand from imaging into everyday care pathways. AI’s pattern-recognition advantage will continue to strengthen diagnostics and prioritization workflows. Radiology has demonstrated earlier proof points than other specialty areas, with AI tools increasingly supporting scan prioritization, detection, and, in some cases, workflow efficiency—augmenting clinicians rather than replacing them. The workforce effect is subtle but powerful: faster reads and better triage support more favorable outcomes, change staffing models, and raise demand for clinicians who can supervise and integrate AI outputs responsibly.
Nursing and care team workflows will start to be redesigned to automate repetitive tasks. The American Hospital Association highlights that automation can free meaningful portions of repetitive work and posits that GenAI can be a productivity lever in clinical operations – especially when leaders move beyond pilots into workflow redesign. In 2026, expect to see more virtual nursing, AI-assisted triage, and predictive tools that help teams anticipate patient deterioration, manage capacity, and coordinate follow-up care. This will support clinicians as they look to “top-of-license” work.
AI governance will also emerge as a core clinical competency. As predictive and generative tools spread, hospitals will formalize oversight, including accuracy evaluation, bias assessment, and post-implementation monitoring, because clinical leaders will be held accountable for safe performance in production, not just pilot success
How AI Will Impact Non-Clinical and Administrative Work in 2026
In 2026, administrative functions are expected to see faster “hard ROI” adoption because the work is often rules-based, high-volume, and measurable. The change will not simply be efficiency, it will be job redesign. Specifically, fewer roles will be responsible for shepherding transactional workflows, and there will be more roles focused on handling exceptions, ensuring quality, and maintaining governance.
Contact centers and patient access will shift to AI-augmented service. The AHA points to real-world examples where GenAI-augmented call centers have reduced wait times and improved first-call resolution, a preview of 2026 gains that will begin to scale: fewer rote calls handled by humans, and more complex cases escalated to people with better context and tools.
Revenue cycle capabilities will move from “processing” to “exception handling.” Administrative teams will increasingly supervise automated drafting, sorting, and routing (including claims preparation, documentation support, and appeals packets), intervening when edge cases arise. The AHA also cites how AI-enabled appeals processes reduce handling time and misrouting, exactly the kind of measurable workflow where adoption tends to accelerate.
Clinical documentation integrity (CDI) and coding support are becoming increasingly reliant on AI-driven solutions. Expect CDI functions to lean more heavily on AI assistance and embedded guidance tools as systems push for accuracy and completeness at scale. CDI emphasizes scalable approaches to documentation accuracy and improvement, which are fertile ground for AI copilots that reduce manual lookup and standardize best practices.
AI-focused workforce capability-building will also become formalized programs, driven by collaboration with progressive HR leaders and executive leadership. 2026 is the year many organizations will standardize baseline AI literacy – especially in areas such as privacy, transparency, monitoring, and human-in-the-loop expectations. The responsible-use principles from the American Association of Medical Colleges underscore the broader direction: human-centered use, transparency, privacy protection, and ongoing evaluation – concepts that will increasingly appear in onboarding and role expectations, extending well beyond clinicians.
In a health system where clinical talent will always be in short supply for the foreseeable future, AI can be viewed as one way to accelerate the balance of labor supply and demand. It’s an opportunity to solve what continues to be the often-cited number one challenge in health care: access to clinicians that practice at the top of their license.
Frequently Asked Questions
How will AI meaningfully change health care by 2026?
By 2026, AI is expected to move beyond experimental pilots and become embedded in the daily operations of health care organizations. Rather than replacing clinicians, AI will increasingly function as an augmentation layer—supporting clinical decision-making, automating administrative tasks, improving patient access, and enabling more predictive and personalized care. The most visible impact will likely be in workflow efficiency, capacity management, revenue cycle optimization, and earlier identification of clinical risk, helping organizations operate more sustainably under mounting financial and workforce pressures.
Which areas of health care are most likely to benefit first from AI?
Near-term value from AI is most likely in areas with high data volume, repeatable processes, and clear performance metrics. These include revenue cycle management, scheduling and access optimization, documentation support, population health analytics, imaging interpretation, and early warning systems for clinical deterioration. These use cases tend to deliver measurable ROI without requiring radical changes to care delivery models, making them more feasible for broad adoption.
Will AI replace physicians or other clinicians?
The article emphasizes that AI is far more likely to **reshape** clinical roles than replace them. Physicians and clinicians will remain central to diagnosis, judgment, empathy, and complex decision-making. AI tools are designed to reduce cognitive load, surface relevant insights faster, and handle routine or administrative tasks. The organizations that succeed will be those that intentionally design AI to complement clinical expertise rather than compete with it.
What operational challenges does AI adoption create for health systems?
AI adoption introduces challenges related to workflow integration, data quality, governance, accountability, and change management. Even highly capable algorithms can fail to deliver value if they disrupt clinician workflows, lack trust, or are poorly aligned with operational realities. Organizations must also address issues such as model oversight, bias mitigation, data privacy, cybersecurity, and ongoing performance monitoring. These challenges make AI as much an organizational transformation as a technical one.
Why is governance so critical to successful AI use in health care?
As AI systems increasingly influence clinical and operational decisions, governance becomes essential to ensure safety, fairness, accountability, and regulatory compliance. Effective governance defines who approves AI use cases, how models are validated, how performance is monitored over time, and how clinicians can escalate concerns. Without clear governance, organizations risk inconsistent adoption, loss of trust, regulatory exposure, and unintended harm.
How does AI affect clinician trust and engagement?
Clinician trust is one of the most decisive factors in whether AI delivers real value. Trust is built when AI recommendations are transparent, explainable, and demonstrably accurate, and when clinicians retain appropriate decision authority. Conversely, “black box” tools imposed without engagement or training often face resistance. Successful organizations actively involve clinicians in AI selection, testing, and refinement so tools are seen as partners rather than threats.
What skills will health care leaders need in an AI-enabled future?
Health care leaders will increasingly need hybrid skills that span clinical, operational, and digital domains. This includes understanding AI capabilities and limitations, asking the right questions of vendors and data teams, managing ethical and governance considerations, and leading workforce change. Leaders do not need to become data scientists, but they must be fluent enough to guide strategy, prioritize investments, and align AI initiatives with organizational goals.
How should organizations prioritize AI investments?
The article suggests prioritizing AI initiatives that address the organization’s most pressing pain points rather than chasing novelty. High-value opportunities typically align with access constraints, margin pressure, clinician burnout, or quality variation. Clear success metrics, strong executive sponsorship, and phased implementation help ensure that AI investments translate into measurable impact rather than isolated proofs of concept.
What role does data quality play in AI success?
AI systems are only as effective as the data that feeds them. Inconsistent documentation, fragmented systems, biased datasets, or outdated information can significantly degrade model performance. Organizations must invest in data governance, interoperability, and standardization to support reliable AI outputs. Improving data quality often delivers benefits beyond AI by strengthening analytics, reporting, and decision-making overall.
What distinguishes organizations that succeed with AI from those that struggle?
Organizations that succeed with AI treat it as a strategic capability rather than a standalone technology. They align AI initiatives with enterprise priorities, invest in governance and change management, engage clinicians early, and continuously measure impact. Those that struggle often focus narrowly on tools without addressing workflow integration, trust, leadership alignment, or long-term sustainability.
What does the future of AI-enabled health care ultimately look like?
By 2026 and beyond, AI-enabled health care is likely to be quieter and more embedded than today’s hype suggests. Success will look less like dramatic disruption and more like incremental gains—smoother operations, more proactive care, reduced clinician burden, and better use of scarce resources. Over time, these cumulative improvements can meaningfully reshape how care is delivered, financed, and experienced by both patients and clinicians.

Press Release | Participation Open for 2026 Health Care Compensation Surveys
Enable smarter workforce strategies with industry-leading benchmarks!
January 6, 2026 – CHICAGO – SullivanCotter, the nation’s leading independent consulting firm in the assessment and development of total rewards programs, workforce solutions, and data products for health care and not-for-profits, recently opened participation for its annual suite of health care compensation surveys.
For nearly 35 years, SullivanCotter has delivered critical compensation benchmarks to the nation’s top hospitals and health systems. The firm’s market-leading health care compensation surveys provide data-driven intelligence and actionable insights to help organizations confidently manage their total rewards strategy across all segments of the health care workforce.
SullivanCotter’s longstanding flagship surveys include:
- Health Care Management and Executive Compensation
- Physician Compensation and Productivity
- Advanced Practice Provider Compensation and Productivity
- Health Care Staff Compensation
These cornerstone offerings are part of a broader and more comprehensive survey portfolio that also reports on registered nursing roles, benefits practices, physician and medical group executives, on-call pay programs, hospital-based physicians, and more.
“Leveraging reliable and robust compensation data is foundational to strategic workforce management,” said Ted Chien, President and CEO, SullivanCotter. “Our 2026 surveys are designed to meet organizations where they are – supporting leaders with insight into competitive pay dynamics and helping to anticipate future workforce needs as ongoing talent and financial pressures are still top of mind.”
Organizations that participate in SullivanCotter’s health care compensation surveys benefit from:
- Substantial discounts on full survey reports
- Early access to survey results and data tables
- Invitations to related webinars led by SullivanCotter experts
- Dedicated support throughout the participation process
To participate in or learn more about any of our surveys, please visit our website, email surveys@sullivancotter.com, or call 888.739.7039.
About SullivanCotter
SullivanCotter partners with health care and not-for-profit organizations to improve performance through integrated workforce strategies. Using industry-leading data, expertise, and analytics, SullivanCotter helps organizations align compensation and workforce practices with their mission and goals.

Press Release | 2025 Nursing Compensation Data Reveals Targeted Pay Increases
See how these trends are shaping nursing compensation strategies for the year ahead!
December 16, 2025 – CHICAGO – SullivanCotter, the nation’s leading independent consulting firm in the assessment and development of total rewards programs, workforce solutions, and data products for health care and not-for-profits, has released new data and insights from the 2025 Registered Nursing Compensation Survey.
The results highlight how hospitals and health systems are navigating evolving labor market dynamics by making targeted investments in base pay, taking geographic pay differences into account, and focusing on strategies and programs to stabilize their nursing workforce.
Targeted Investments Drive RN Base Pay Changes
In the first half of 2025, the greatest growth in median base pay was among medium-sized organizations – defined as health systems with between $250M and $750M in annual net revenue – at 3.2%. Organizations with revenues between $751M and $1.5B reported a 2.9% increase, reflecting continued emphasis on retaining experienced nursing talent.
From January through July 1, RN leaders (3.0%) and managers (2.7%) received the largest median base pay increases, signaling that organizations are prioritizing nursing compensation for roles with broad supervisory and clinical oversight. And while supervisors (1.9%), charge nurses (2.4%), and staff RNs (1.7%) experienced lower median base pay increases, organizations were more selective in awarding higher pay adjustments at these levels between 5.7% and 8.2% at the 90th percentile.
Nursing compensation movement varied by specialty as well. Critical Care RNs recorded the highest six-month median increase at 3.2%, followed closely by those in Anesthesiology, Oncology, and the Emergency Department. Among non-acute care roles, RN Case Managers (3.0%) and RN Patient Navigators (2.3%) experienced the strongest median growth, while Licensed Practical Nurses had the lowest growth at 1.1%.
“Organizations are making targeted, strategic investments in nursing pay, prioritizing leaders, critical specialties, and hard-to-fill roles as they work to remain competitive in a market that is always evolving,” said Steve Meyers, Principal, SullivanCotter. “It’s important to elevate pay where pressures are greatest and prepare for continued evaluation in the months ahead.”
Nearly 70% of participating organizations plan to review external nursing market data in the second half of 2025, signaling that many anticipate further adjustments to pay strategies this year.
Geographic Differences Remain a Significant Driver of RN Pay
Regional variability continues to strongly influence nursing compensation. The West reported the highest median hourly rates for Clinical Nurse Specialists ($96), Staff RNs ($61), and LPNs ($36) – positioning this region well above the others. The Northeast followed at $69, $50, and $34, respectively, with slightly lower rates across the North Central, South Central, and Southeast regions.
Specialty pay differences were also notable, particularly in the West, which showed the widest intra-region variation, from $74 per hour for Wound Care RNs to $57 for Oncology RNs. Even at the low end, specialty pay in the West remains higher than comparable roles in every other region.
RN Turnover and Vacancy Rates Show Signs of Stabilization
Managing nursing turnover remains a significant challenge for health care organizations, given its impact on staffing, cost, and continuity of care. Compared to 2024, RN turnover rates have decreased while LPN turnover rates have increased. In the first half of 2025, 62% of organizations reported RN turnover between 11% and 20%. For LPNs, more than one-third of organizations reported turnover above 20%.
For RNs, 5.7% fewer organizations have days-to-fill over 90 days, and 10% fewer organizations have vacancy rates over 11%. Year-over-year declines in vacancy rates and time-to-fill metrics indicate that organizations are making progress in addressing staffing gaps and strengthening recruitment pipelines.
“Taken together, these shifts signal that the nursing labor market may be entering a period of greater stability. Organizations are not only seeing fewer extended vacancies, but they’re also experiencing more predictable hiring activity, an important step toward rebuilding workforce sustainability,” said Meyers.
For more information on SullivanCotter’s surveys, please visit our website or contact us via email or by phone at 888.739.7039.
About SullivanCotter
SullivanCotter partners with health care and not-for-profit organizations to improve performance through integrated workforce strategies. Using industry-leading data, expertise, and analytics, SullivanCotter helps organizations align compensation and workforce practices with their mission and goals.

How Nursing Team Configuration Drives Readmission Rates
Explore the Hidden Variable in Patient Outcomes
Your nursing team configuration matters…
By Donncha Carroll, Partner, Lotis Blue Consulting in partnership with SullivanCotter
The Untapped Lever in Patient Care
Consider the following scenario: we have two hospitals with the same patient population and protocols, but one location experiences significantly fewer readmissions. Despite standardized procedures and compliance with best practices, patient outcomes vary significantly.
What could be driving that difference in performance?
We all know that patient readmission is not just about staffing ratios—it’s also about the individuals and teams that constitute the clinical staff. Most would agree that better talent performs at a higher level and contributes more to achieving patient outcomes…but what do we mean by ‘better talent’?
It’s not just about the quality of individual clinicians. There are features of workforce configuration that create better-performing teams. For example, organizations can reduce system readmission rates by building a nursing team configuration that focuses on high ‘experience density’.1
Experience in Nursing Roles Matters
SullivanCotter and its strategic partner Lotis Blue recently conducted research showing that higher levels of ‘experience density’ are associated with a material and statistically significant reduction in readmissions.2 While the relationship between nurse experience and patient outcomes may seem obvious, this discovery is based on experience ‘in-position’.3 This positional dimension of experience highlights a crucial aspect of how workforce configuration can contribute to performance. Using detailed workforce configuration data from over 100 different health systems – which is further broken down at the individual facility or location level – the relationship between experience and readmission becomes more clearly defined.
Percent of Nurses by Job Experience Group and Readmission Ranking Tercile

Key Observations
– Top tercile readmission facilities have a higher percentage of nurses with 6+ years of experience
– All three terciles have approximately the same percentage of nurses with 2-6 years of experience
– Facilities with a higher percentage of nurses with less than 2 years of in-position experience have higher readmissions
Note: The observed relationship is not due to random variation using two statistical tests
Interestingly, the pattern is observable within a position, but it disappears when an individual’s organizational experience (in years employed) or career experience (in years since graduation) is examined. Insights from position-level analysis provide visibility into nursing organization design – including how teams are formed, managed, and operate in delivering patient services. Maintaining a minimum level of tenured staff ‘in-position’ is an important driver of team cohesion and stability.
This pattern is really an operational manifestation of the following:
- Maintaining an anchor population of nurses developing, retaining, and sharing essential knowledge about “how things work around here” helps to enable the success of less experienced nurses and boosts overall team performance.
- More experience ‘in-position’ translates into higher levels of competence in performing a specific set of responsibilities, delivering higher productivity, and better outcomes for the services offered.
Since organizational structure and nurse deployment decisions are modifiable factors, hospitals and health systems can drive clinical and economic outcomes by configuring the workforce in these ways. More specifically, a minimum level of experienced nurses is necessary in the most critical areas of health care service delivery to achieve optimal patient outcomes.
This prompts three key questions:
- Which parts of the nursing organization disproportionately influence or drive patient care outcomes and readmission?
- Within each of those teams, what is the optimal ‘in-position’ experience profile of today’s nursing staff?
- How does an organization encourage its nurses to stay ‘in-position’ longer when the experience profile is below the desired level?
Economic Impact and Strategic Implications
While health systems are motivated to reduce readmissions to provide the best possible care and outcomes for their patients – there is also a financial imperative.
For major teaching hospitals, avoiding a single readmission can result in a direct financial gain of approximately $18k. For non-teaching hospitals, the benefit is around $15k. Each 1% reduction in readmission rates translates to substantial aggregate savings for a facility. This can add up to millions of dollars annually for larger hospitals.
Illustrative Impact 1% Improvement for Mid-Sized Hospital

Rethinking Nursing Workforce Metrics
The health care industry typically focuses on nurse-patient ratios to guide staffing decisions. It is also commonly used as the primary lens into organizational design effectiveness. However, this measure does not adequately consider these other important dimensions of experience and positional knowledge that materially influence team performance.
While the quality of individual talent in each role is also a crucial factor in driving patient outcomes, configuration-aware staffing analytics – which ensure each area of nursing has a bedrock of experience needed to onboard, orient, and deploy resources efficiently – are essential to success.
Call to Action: Redesign with Purpose
Test the Hypothesis
Looking to build a more optimal experience profile in key nursing positions?
We can help you make the business case using the following approach:
- Select two or more facilities within the health system where patient readmissions are notable (both higher and lower than expected).
- Within each facility, identify nursing teams with 30+ resources who have a disproportionate impact on patient outcomes.
- For each team, calculate the percentage of nurses who are ‘in-position’ for more than six years and capture the patient readmission rate.
- Compare readmissions between each team by plotting the percentage of experienced nurses against the readmission rate on a single chart.
- Calculate the rate at which readmissions decline with increasing experience.
Illustration

‘In-position’ experience is a crucial lever in enhancing patient outcomes, and by extension, operational and financial outcomes as well. Positional experience will matter more in cohesive working teams because the experienced group serves as a curator of domain knowledge, protecting the unique expertise required for the team to operate efficiently and effectively. There may also be material differences between the groups in engagement scores, decision quality, organization cohesion, and other talent management metrics.
Improving Experience Density
What does this mean for your organization? You will naturally start to ask what changes to talent management will create a more optimal experience profile. This is more challenging than it appears on the surface as there are competing dynamics for bedside nursing talent. For example, bedside nurses may leave a position to advance into leadership, to move to an ambulatory environment, become an advanced practice nurse, relocate, and more. – the possibilities are endless.
Organizations will need to develop intentional and innovative pathways that encourage bedside nurses to stay in their role. Compensation is not the only lever for this – and oftentimes isn’t enough on its own. Organizational leadership must think more holistically.
The following approach may help you strike the right balance as you work towards this goal:
- Estimate patient readmission impact and the total economic value of each percentage improvement in nurse experience (up to a maximum of 25%).
- Identify a group of nurses who are respected by their peers, with 4+ years ‘in-position’, and considered happy and engaged as a cohort for focused review and investment.
- Conduct focus groups to understand the unique perspectives, needs, and interests of these nurses; disproportionately invest in changes that improve job satisfaction.
- Consider introducing retention bonuses based on the combination of service years and evidence of sustained performance.
- Develop innovative pathways and programs to support these groups of identified and committed individuals including measures that allow teams to grow together in place, promote from within, gain additional education and skills and have a role in selecting, training, and developing early career individuals.
- Ask these committed individuals to participate in or influence staffing decisions, unit policy changes, equipment selection, scheduling, and clinical practice updates.
- Provide time and resources for these experienced nurses to mentor newer staff while maintaining a clinically fulfilling caseload.
- Invite them to participate in committees, safety projects, and innovation efforts. Then, implement ideas they propose and publicly credit them for their contributions.
- Review and estimate the cost of moving compensation close to the top of the in-level pay range; consider’ in-position’ promotions to ensure pay competitiveness.
- Consider introducing retention bonuses based on the combination of service years and evidence of sustained performance.
- Measure, calculate, and advertise the return on investment achieved by closely monitoring trends in readmission rates as these changes are implemented with consideration of incentives for teams that maintain sustained high performance.
Conclusion
The path forward requires intentional design. Health systems must rethink how they structure teams, how they cultivate the expertise that already exists within their walls, and how they build pathways that allow experienced nurses to thrive in place. These choices will shape not only patient outcomes, but organizational culture, workforce stability, and long-term financial performance.
The challenge to nursing leadership is simple—and urgent: test the hypothesis, measure the impact, and redesign with purpose. The organizations that act now will not only see measurable improvements in readmissions—they will build stronger, more resilient clinical teams capable of delivering consistently exceptional care.
References:
[1] Experience density = ratio of nurses with 6+ years of experience in their current position.
[2] The Sullivan Cotter analytics team calculated readmission ranking using CMS data from the following source https://data.cms.gov/provider-data/dataset/bzsr-4my4
[3] A position in an organization is a specific, defined spot or “slot” within the company’s structure that an individual occupies but remains intact as resources come and go over time.
Want to continue the conversation?
Lotis Blue and SullivanCotter stand ready to help health systems operationalize these insights, validate outcomes, and design sustainable workforce strategies that elevate performance at every level.

Advanced Practice Provider Turnover: A Costly Reality
APP turnover is more than an HR challenge – it’s an operational and financial reality.
Hadley Powless, MBA, PA-C, Consulting Manager
Joel Villegas, MBA, Consulting Manager
Lacey Buckler, DNP, ACNP-BC, FAANP, Principal
Introduction
The labor market has faced significant disruption over the past decade, most notably due to the COVID-19 pandemic. While many sectors have returned to prepandemic employment levels, health care continues to experience volatility driven by persistent staffing shortages and inflationary pressures.1 In response, many clinicians have exited the field entirely or transitioned away from direct patient care. Despite service demand stabilizing near pre-COVID levels, clinical staffing shortages remain widespread and have contributed to persistently high turnover rates.2
According to the 2024 National Health Care Retention & RN Staffing Report from NSI Nursing Solutions, the average hospital turnover rate stands at 20.7% with nursing-specific turnover at 18.4%.3 While these rates have declined from the post-pandemic peak of 26%–27%, they remain elevated compared to historical norms. Data from SullivanCotter’s 2025 Advanced Practice Provider Compensation and Productivity Survey indicates a median
external turnover rate of 8.6% among advanced practice providers (APPs), which includes physician assistants (PAs) and advanced practice registered nurses (APRNs).4 Certain specialties – such as emergency medicine and behavioral health – report turnover rates exceeding 14%.5 In comparison, the median voluntary turnover rate for physicians is approximately 7%.6
Turnover is an unfortunate reality in every industry, and its impact on cost, morale, and operational efficiency can be substantial. While physician and nurse turnover has been studied extensively, less attention has been paid to APPs. In 2020, SullivanCotter published a foundational report examining APP turnover, its associated costs, and the organizational factors that influence it. The report introduced a methodology for quantifying turnover-related expenses and offered a framework for organizations to assess and report these costs more effectively.
This research builds on that foundation by presenting updated cost data, analyzing key drivers of turnover and satisfaction, and outlining actionable strategies to improve APP engagement and retention. It includes insights and data compiled by SullivanCotter’s National APP Advisory Council (NAAC) – which consists of health care organizations with some of the nation’s largest and most advanced APP structures.
Additional insights were gathered from the following SullivanCotter survey reports:
• APP Compensation and Productivity
• APP Preferences
• APP Leadership and Organizational
Background
Advanced practice provider turnover has a measurable impact on both patient outcomes and provider engagement. A clear understanding of its root causes and financial implications is essential for developing effective organizational strategies.
SullivanCotter outlines a three-step approach to evaluate the economic impact of APP turnover:
- Identify organizational drivers contributing to turnover
- Quantify the associated costs
- Perform a comprehensive APP turnover cost analysis
Defining and Measuring APP Turnover
APP turnover can be categorized as either external or internal:
- External turnover is when an APP voluntarily leaves the organization to join another employer or exit the health care industry altogether. Often labeled as attrition or resignation, this type of turnover may be preventable through targeted retention efforts.
- Internal turnover or “churn” occurs when an APP transitions between departments or specialties within the same organization. This is more common among APPs than physicians due to the versatility of their licensure and certification, which allows for greater mobility across clinical areas.
Although internal turnover is a common challenge for many organizations, this analysis focuses exclusively on the cost of external APP turnover. While some internal movement supports retention by offering career growth, excessive shifts may signal concerns around equity, compensation, or culture. APP utilization influences both types of turnover. A comprehensive turnover analysis should include exit interviews, employee engagement surveys, utilization reviews, and benchmarking against industry standards to uncover root causes and inform retention strategies.
While understanding the types of turnover is essential, identifying the factors that influence an APP’s decision to stay or leave is equally critical. The following section explores key drivers of engagement and retention based on survey data.
Likelihood to Leave and/or Recommend the Organization
APP Engagement and Retention: Key Correlations
We analyzed data from SullivanCotter’s APP Preferences Survey, focusing on utilization, compensation, onboarding, and workplace dynamics. These insights were compared to APPs’ likelihood of leaving within 12 months and their willingness to recommend their organization. The analysis revealed strong correlations between specific workplace factors and retention outcomes.
Among APPs considering departure, the highest risk factors included:
- Minimal or no utilization
- Physicians not understanding the APP role
- Perceived lower compensation than peers
- Ineffective orientation
Methodology for Assessing Costs
Understanding the factors that drive APP turnover provides important context for evaluating its financial impact. To assess the cost of turnover, it is useful to focus on measurable factors with direct dollar amounts, such as recruitment, sign-on bonuses, and training. Indirect costs, including provider dissatisfaction, burnout, and lost patient revenue, are harder to quantify and can vary widely by organization.
The following elements represent the primary direct costs associated with APP turnover:
- Moving allowance
- Sign-on bonus
- Recruiter time (e.g., hours spent per APP recruited)
- Advertising
- Physician time for orientation and onboarding with a new APP (e.g., hours spent per APP oriented that took time away from patient care)
- APP time for orientation and onboarding (e.g., hours spent in non-billable orientation time)
- Background check/drug screen and licensure verification
Based on SullivanCotter’s 2024 APP Organizational and Leadership Survey Report and grounded in market research conducted with APP executives from organizations employing large APP workforces, the direct cost of turnover for a single APP ranges from $93,000 (25th percentile) to $147,500 (75th percentile), with a median of $120,000.5 These direct costs represent approximately 70% to 110% of the median APP salary.4

When factoring in indirect costs such as lost productivity, provider burnout, and patient care disruptions, the total estimated cost of APP turnover rises to $150,000 to $250,000, with a median of $187,500.5 This equates to 112% to 187% of the median APP salary.5 These estimates are consistent with data from both physician and nursing turnover research.3, 8, 9, 10

While the costs listed here are objective and quantifiable, advanced practice provider turnover costs can vary by organization – which is why each should conduct its own assessment. Elements of turnover should be clearly defined, easily measured or estimated, and agreed upon in advance. To accurately assess the total cost of APP turnover, organizations should have the following information available:
- Number of APPs working in your organization
- External turnover rate
- Headcount of the turnover rate (total number of APPs multiplied by the turnover rate)
- Factors driving turnover (consider exit interviews and/or engagement surveys)
Factors that Enhance APP Job Satisfaction
While understanding the cost of APP turnover is essential, addressing the factors that influence turnover and drive job satisfaction is key to improving retention. As part of SullivanCotter’s APP Preferences Survey, APPs were also
asked what their employers could do to enhance their work experience. Their responses revealed consistent themes that strongly influence engagement, motivation, and long-term commitment.
Analysis of the survey data identified several critical drivers of satisfaction. The top three motivators were:
- Work-life balance, including flexible scheduling (73%)7
- Competitive compensation (68%)7
- Collegial relationships with other clinicians (46%)7
Additional factors that contribute to APP engagement include:
- Competitive compensation and benefits
- Recognition of professional expertise and value
- Opportunities to practice at the top of license
- Clear paths for career advancement
- Meaningful leadership roles
- Adequate staffing and administrative support
- Effective communication from leadership
- A positive and inclusive workplace culture
Focusing on these areas can help organizations reduce burnout, strengthen retention, and foster a more supportive and fulfilling work environment for APPs.
Actionable Strategies to Enhance APP Engagement
Building on insights from SullivanCotter’s APP Preferences Survey, the following strategies reflect feedback from APPs on what would help to improve their work experience and increase job satisfaction. These actions can help organizations strengthen engagement, reduce burnout, and improve retention.
Compensation and Benefits
- Align pay with market rates, experience, specialty, and responsibilities
- Consider the introduction of variable incentives (e.g., wRVU-based rewards, quality/value-based incentives)
- Enhance PTO, health coverage, student loan repayment, and CME benefits
- Regularly evaluate pay equity for APPs, taking into account differences in years of experience and specialty, and reviewing offerings in comparison to other clinical roles such as physicians and RNs
Recognition and Valuation
- Acknowledge APP contributions individually and collectively
- Reflect experience and seniority in titles and compensation
- Include APPs in decision-making and show consistent appreciation
Work-Life Balance
- Consider flexible scheduling (e.g., four-day weeks, reduced night/weekend shifts)
- Address workload and staffing to reduce burnout
- Ensure balanced shift distribution and adequate administrative time
Leadership and Career Advancement
- Define clear career paths and advancement opportunities
- Establish APP councils or leadership roles with decision-making authority
- Ensure titles and compensation reflect leadership responsibilities
Utilization and Scope of Practice
- Support full scope of practice through updated policies and role optimization
- Offer training to expand procedural and clinical skills
Communication and Support
- Improve transparency around compensation, expectations, and organizational updates
- Provide timely feedback on performance, coding, and documentation
Work Environment and Resources
- Ensure adequate support staff (e.g., RNs, MAs) to reduce administrative burden
- Strengthen onboarding and mentoring programs
- Provide dedicated professional spaces to reinforce APP identity
Culture and Respect
- Promote collaboration and mutual respect among APPs, physicians, and leaders
- Recognize APPs as independent clinicians, not ancillary staff
- Address cultural gaps to foster a collegial and inclusive environment
Conclusion
Reducing APP turnover requires a comprehensive, data-driven approach that goes beyond understanding costs. While direct and indirect turnover costs can exceed $300,000 per APP, these figures don’t fully capture the broader impact on care delivery, team engagement, and operational continuity.
To address the root causes of turnover, organizations should implement targeted strategies such as postgraduate clinical fellowships, leadership development programs, enhanced onboarding, and structured career advancement pathways. Research also supports the value of dedicated APP leadership structures in improving retention outcomes.11, 12
Ultimately, sustaining these efforts depends on cultivating a strong organizational culture grounded in collaboration, respect, and shared purpose. By prioritizing APP feedback and investing in targeted strategies, organizations can build a more resilient workforce and ensure the long-term sustainability of high-quality patient care.
References
- Sheiner L., Wessel D., and Asdourian E. (2024). The US Labor Market post COVID: What’s changed, and what hasn’t? The Brookings Institute. https://www.brookings.edu/articles/the-us-labor-market-post-covid-whats-changed-and-whathasnt/
- Shen K., Eddelbuettel J., and Eisenberg MD. (2024). Job Flows Into and Out of Health Care Before and After the COVID-19 Pandemic. JAMA Health Forum. 5:1. 10.1001/jamahealthforum.2023.4964
- NSI Nursing Solutions, Inc. (2024). 2024 NSI National Health Care Retention & RN Staffing Report. Retrieved from https://www.nsinursingsolutions.com/documents/library/nsi_national_health_care_retention_report.pdf
- SullivanCotter’s 2025 Advanced Practice Provider Compensation and Productivity Survey Report
- SullivanCotter’s 2024 Advanced Practice Provider Leadership and Organizational Survey Report
- SullivanCotter’s 2025 Physician Compensation and Productivity Survey Report
- SullivanCotter’s APP Preferences Survey
- Bae SH. (2022). Noneconomic and economic impacts of nurse turnover in hospitals: A systematic review. Int Nurs Rev. Sep;69(3):392-404. doi: 10.1111/inr.12769.
- Dydra L. (2023). The cost of Physician turnover. Beckers Hospital CFO Report. https://www.beckershospitalreview.com/finance/the-cost-of-physician-turnover.html
- Fibuch, E., & Ahmed, A. (2015). Physician Turnover: A Costly Problem. Physician Leadership Journal, 2(3), 22-25.
- Shanafelt, T., Goh, J., & Sinsky, C. (2017). The Business Case for Investing in Physician Well-being. The Journal of the American Medical Association Internal Medicine. 177(12), 1826-1832. doi:10.1001/jamainternmed.2017.4340
- Kurnat-Thoma, E., Ganger, M., Peterson K. & Channell, L. (2017). Reducing Annual Hospital and Registered Nurse Staff Turnover: A 10-Element Onboarding Program Intervention. Sage Open Nursing, 3, 1-13. Retrieved from https://doi.org/10.1177/2377960817697712

VIDEO | Which national trends are impacting APP turnover?
Although the national APP turnover rate is in decline...
Organizations must continue to address it.
Reducing APP turnover is not just a staffing issue – it’s a strategic imperative for delivering sustainable, high-quality health care.
What’s actually influencing retention in today’s competitive clinical talent landscape? Contrary to common assumptions, compensation isn’t the primary driver. Utilization is.
When APPs aren’t empowered to work at the top of their license, organizations risk disengagement, inefficiency, and ultimately, turnover.
In our new video, Hadley Powless explains how SullivanCotter can help to promote stability, continuity and efficiency across your entire care team.
APP turnover is a costly reality.
Need additional insight? Our new analysis uncovers several powerful predictors of retention.
For organizations seeking to strengthen retention in 2026 and reduce the cost of APP turnover, understanding these drivers is essential.

Video Transcript
I’m Hadley Powless and I am a Consulting Manager at SullivanCotter. I am also a practicing advanced practice provider. Specifically, I am a PA with over 18 years of experience working in both clinical and APP leadership roles.
Over the past three years, we’ve seen a slight but meaningful decline in external turnover among APPs. In 2023, the national turnover rate was 12%. In 2024, it dropped to 11%, and according to SullivanCotter’s most recent APP Compensation and Productivity Survey, we’re now seeing the lowest rate since 2022—just 10%.
But what’s driving turnover when it does happen? Using over five years of data from our APP Preferences Survey, we’ve identified the top reasons APPs consider leaving their organizations. Surprisingly, compensation is not the leading factor. The number one reason APPs report is minimal or no utilization in their role—they’re simply not being used to their full potential and working at the top of their license. The second most common reason is working with physicians or staff who don’t fully understand the APP role or capabilities. Third is an ineffective orientation program, and fourth is the perception of lower compensation compared to peers at other organizations.
So why should you care about APP turnover? Because it’s costly—financially and operationally. High turnover leads to increased recruitment and training expenses, lost productivity, and disruptions in patient care. It strains remaining staff and can negatively impact outcomes and satisfaction. When APPs leave, organizations often face coverage gaps and a loss of valuable institutional knowledge. Addressing turnover is not just a staffing issue—it’s a strategic imperative for sustainable, high-quality care delivery.
Low turnover, on the other hand, is the ideal. It promotes stability, continuity, and efficiency across care teams. At SullivanCotter, we help organizations achieve this by evaluating care team models and identifying opportunities for improvement. When we work with clients in care team optimization, we spend valuable time together, collaborating on a few essential steps. First, we assess current roles and responsibilities, analyze patient-provider workflows, and sometimes, conduct quantitative assessments. Next, we work together to define a future-state care model—one that enhances access, engagement, quality, and cost-effectiveness for all. As a last step, we partner together to create an implementation plan with a focus on long-term success.
If you’re interested in learning more or have questions about APP turnover and care team optimization, feel free to reach out—we’re always happy to share insights and continue the conversation.

VIDEO | Fair Market Value: Physician Leadership Compensation
Physician leadership compensation continues to draw heightened attention from regulators.
How can organizations proactively support compliance, demonstrate defensible decision-making, and mitigate potential risk?
In this video, SullivanCotter’s Julie Mannion breaks down five essential best practices that every organization should be incorporating into its approach.
From strengthening role definitions and clarifying leadership responsibilities to aligning compensation with internal governance standards and fair market value expectations, Julie provides actionable insights to help organizations navigate this complex landscape with confidence.
If your organization is refining its approach to physician leadership compensation, this is insight you won’t want to miss.
Reach out to our experts...
Partner with SullivanCotter to maintain compliance in an evolving marketplace!

Press Release | The Next Chapter of Health Care Leadership
SullivanCotter and Lotis Blue Consulting Identify Competencies Defining the Future-Ready Health System CEO
December 4, 2025 – CHICAGO – SullivanCotter, the nation’s leading independent consulting firm in the assessment and development of total rewards programs, workforce solutions, and data products for health care and not-for-profits, and its strategic partner Lotis Blue Consulting have released The Future-Ready Health System CEO: The Competencies and Attributes That Will Define Leadership in the Next Era of Health Care.
The study, developed utilizing the Hogan Leadership Assessment framework, draws on insights from 20 leading client organizations to define the competencies and attributes that will shape the next generation of health system CEOs.
Together, the firms created the Health Care Potential Index (HCPI) – a data-driven framework that replaces traditional indicators like professional history and tenure with evidence-based measures of leadership potential.
Defining Leadership for Health Care’s Next Chapter
“Health care organizations face a perfect storm of financial strain, workforce fatigue, and growing community accountability,” said Aaron Sorensen, Ph.D., Senior Partner, Lotis Blue Consulting. “The leaders who will thrive are those who combine strategic clarity with empathy, operational discipline with courage, and the ability to mobilize others through trust.”
The study highlights ten essential competencies – known as the “Vital Ten” – that define future-ready CEOs. These fall across four domains validated by industry experts:
- Strategic Mindset – Anticipating disruption and positioning systems for the future.
- Execution Engine – Turning vision into measurable results.
- Cultural Leadership – Building trust and alignment among stakeholders.
- Adaptive Capacity – Leading with calm and agility amid volatility.
Beyond these competencies, the research also examines the characteristics important for success in the job. The findings show that ambition, intellectual curiosity, emotional stability, and empathy form the foundation for sustained effectiveness in today’s complex environment.
Implications for CEO Succession and Leadership Development
For boards and executive teams, the HCPI offers an evidence-based approach to identifying and developing leaders equipped for system-level transformation. It helps organizations assess leadership potential objectively to reduce bias and improve succession planning.
“Future-ready CEOs are defined less by what they know and more by how they think and connect,” added Sorensen. “They balance foresight with judgment and ambition with humility – qualities that are essential to leading through disruption.”
About Lotis Blue Consulting
Lotis Blue is committed to helping organizations forge strong connections between workforce, leadership, and organizational performance. With deep expertise in data and behavioral science, we deliver insight-driven solutions tailored to each client’s unique challenges.
For more information on Lotis Blue Consulting, please visit www.lotisblueconsulting.com.
About SullivanCotter
SullivanCotter partners with health care and not-for-profit organizations to improve performance through integrated workforce strategies. Using industry-leading data, expertise, and analytics, SullivanCotter helps organizations align compensation and workforce practices with their mission and goals.
For more information, visit www.sullivancotter.com or contact us at 888.739.7039.