
PODCAST | Submitting Split/Shared Visits for Reimbursement
Zach Hartsell, Principal – APP Workforce Practice – featured in BESLER’s Hospital Finance Podcast to discuss changes to split/shared visit attribution
Listen to podcast >
Every year, the Centers for Medicare & Medicaid Services incorporate changes in policy, regulations, and requirements for billing under the Medicare Physician Fee Schedule (PFS). These changes are often adopted by commercial payers.
On November 2, 2021, CMS released the final rule for the 2022 PFS. The final rule went into effect on January 1, 2022, and includes some important considerations related to the conditions for submitting split-shared visits for reimbursement.
These changes have the potential to alter the existing workflow of physicians and advanced practice providers related to billing split-shared encounters.
To help explain the impact of these changes, this episode includes:
- The definition of a split/shared visit
- Insight into the 2022 changes as well as those coming in 2023
- Explanation of specific activities that CMS has identified
- Case-based examples
Looking for additional insight on the changes to the Physician Fee Schedule regarding Split/Shared Visits?
We’ve recently published some content that may be of interest to you.
ARTICLE
Physician Fee Schedule: Understanding Changes to Split/Shared Visits
INFOGRAPHIC

INFOGRAPHIC | Physician Workforce Trends in Pediatric Hospitals
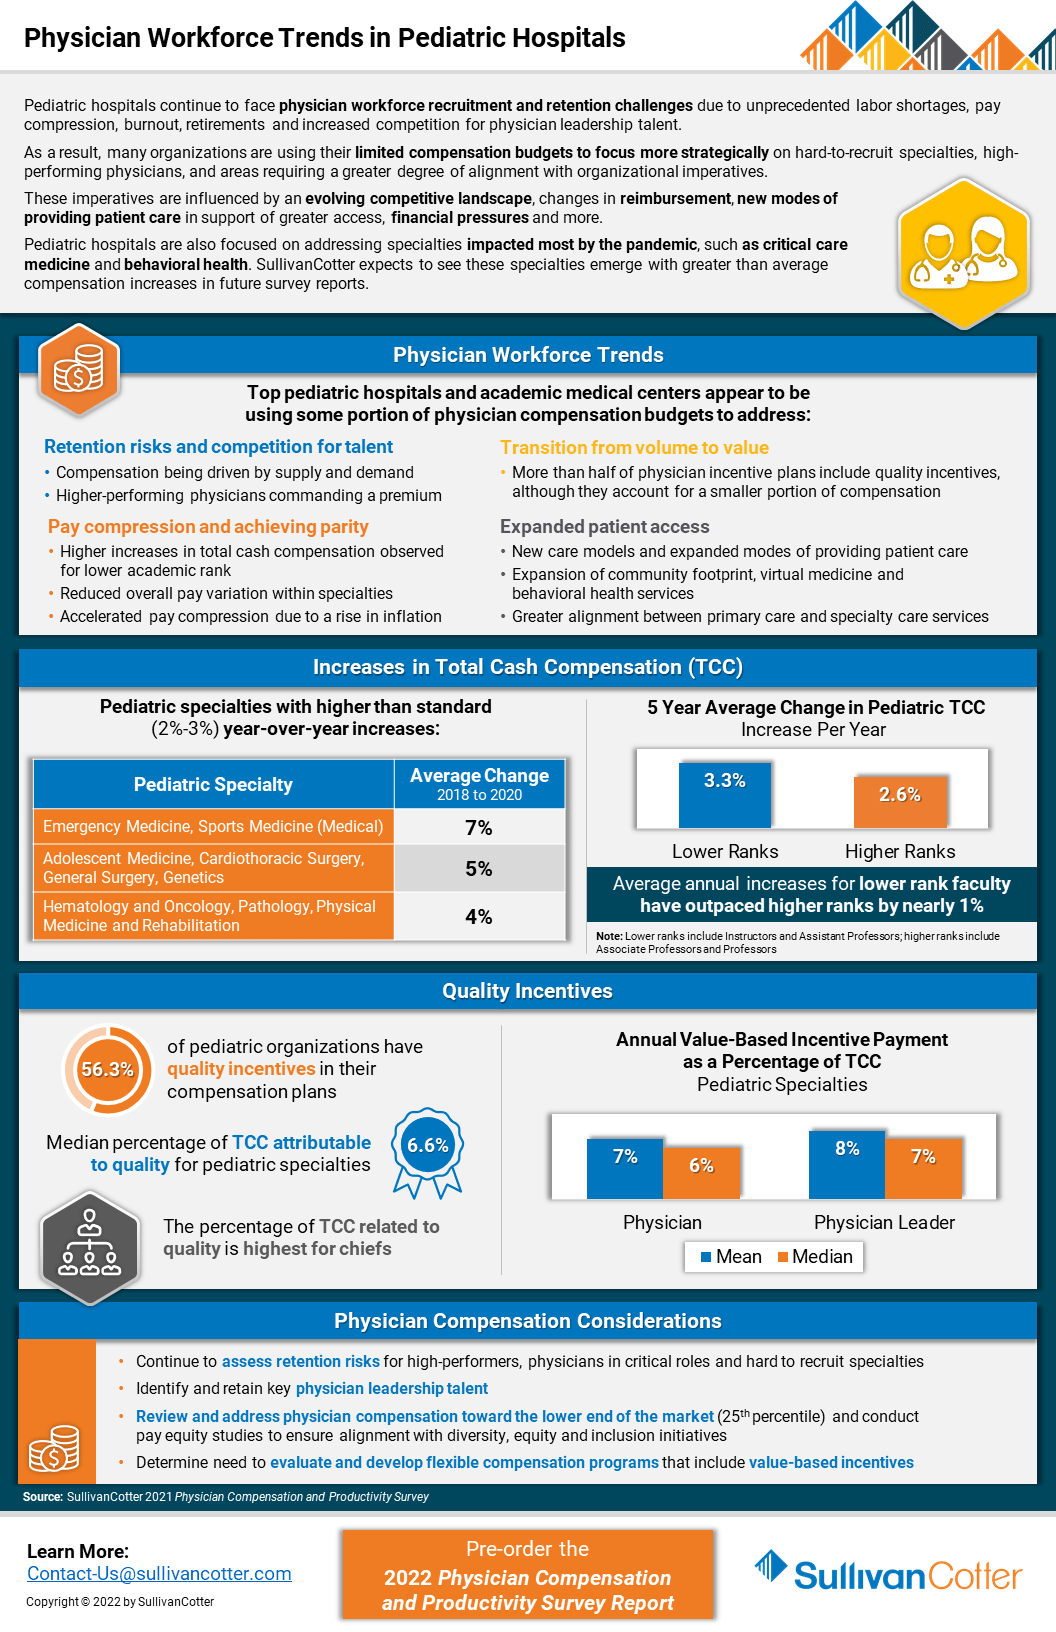
Pediatric hospitals continue to face physician workforce recruitment and retention challenges
Due to unprecedented labor shortages, pay compression, burnout, retirements and increased competition for physician leadership talent, pediatric organizations are experiencing a number of challenges related to recruiting and retaining the right talent.
As a result, many organizations are using their limited compensation budgets to focus more strategically on hard-to-recruit specialties, high-performing physicians, and areas requiring a greater degree of alignment with organizational imperatives.
These imperatives are influenced by an evolving competitive landscape, changes in reimbursement, new modes of providing patient care in support of greater access, financial pressures and more.
Pediatric hospitals are also focused on addressing specialties impacted most by the pandemic, such as critical care medicine and behavioral health. SullivanCotter expects to see these specialties emerge with greater than average compensation increases in future survey reports.
VIEW INFOGRAPHIC
PODCAST | Executive Compensation Committee
Priorities and Trends for the Executive Compensation Committee
Episode 1 >
Episode 2 >
In a rapidly evolving health care environment, oversight of executive compensation, recruitment and retention remains a critical responsibility of the board of directors. These decisions are complex, highly regulated and require heightened executive compensation committee engagement and specialized expertise.
In this two-part edition of the Governing Health Podcast Series, SullivanCotter's Tim Cotter, Managing Director, joins McDermott Will & Emery's Michael Peregrine to discuss emerging trends and practices in health care executive compensation.
These episodes include insight into:
- The current state of salaries, increase budgets, incentive awards and more
- Emerging compensation practices
- Effective retention and transition strategies
- The evolution of annual and long-term incentive plans
- Executive and director co-investment arrangements
- For-profit compatibility data

Executive Span of Control | Identifying the Optimal Structure
Executive span of control, which is generally defined as the number of direct reports under a leader, should be periodically reviewed to ensure an effective and efficient management structure.
Download PDF >
In today’s increasingly complex health care environment, executives are responsible for driving performance aligned with a health system’s mission, vision and values. Span of control, which is generally defined as the number of direct reports under a leader, should be periodically reviewed to ensure an effective and efficient management structure. Health systems strive to attain optimal span of control to ensure their front line staff have the appropriate amount of supervision, communication, training and performance management in place, while also seeking to optimize the cost of their operating model.
At the senior leadership level, span of control is vital and serves as an important measure of accountability for an executive. Having too many direct reports or lines of business to oversee can dilute strategic focus if executives become mired in day-to-day operations and compromise a manager’s ability to effectively develop and grow talent. Conversely, having too few direct reports may be an indication of an inefficient management structure with potential duplication of responsibility and approval channels. This can affect the decision-making processes, slow down overall execution, and lead to excess costs.
Note: Span of control is a complex and nuanced management topic. The purpose of this article is to provide a conceptual introduction, share key data and benchmarks from SullivanCotter’s proprietary Workforce Metrics Benchmark database, highlight key strategies and considerations, and summarize the benefits that health systems can achieve from improving span of control. These benchmarks are aggregated across not-for-profit health care organizations with different operating models and strategic imperatives, and therefore should be used as a general point of reference rather than to create specific performance targets.
Finding the optimal mix of management oversight can be challenging.
For this article, SullivanCotter analyzed span of control for more than 4,000 health system executives across different job families and reporting levels in order to identify the typical range of direct reports and help health systems assess their executive span of control structures.
This analysis is based on data from SullivanCotter’s Workforce Metrics Benchmark database and represents nearly 700,000 individuals from 54 not-for-profit health systems (comprising more than 600 individual/subsidiary hospitals and other operating entities) with an average net revenue of over $4.5 billion.
Range of Span of Control by Level
SullivanCotter evaluated span of control across four different executive-level roles consisting of System CEOs and Presidents, Entity CEOs and Presidents, Executive Vice Presidents, Senior Vice Presidents and Vice Presidents. Definitions of each role are included in the Appendix.
Exhibit 1 below shows the range for the number of direct reports per executive. The green shading indicates the 25th to 75th percentiles, while the red shading indicates the 10th and 90th percentiles.
Range of Span of Control - Number of Direct Reports by Level
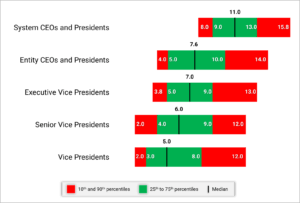
System CEOs and Presidents generally have 9 to 13 direct reports with a median of 11. As we move further down in the organization, this range tends to decrease for any of the Vice President level positions. Having less than 3 or more than 9 direct reports for this group would suggest it may be appropriate to review the span of control.
While the number of direct reports is a fundamental component of an executive’s scope of responsibility, it is not the only indicator. The combined number of direct and indirect reports can help to demonstrate total accountability and can vary widely depending on number of functions overseen, organization size, and functional area. For this purpose, ‘indirect reports‘ include all of the individuals who report through an executive’s direct reports down the organization hierarchy.
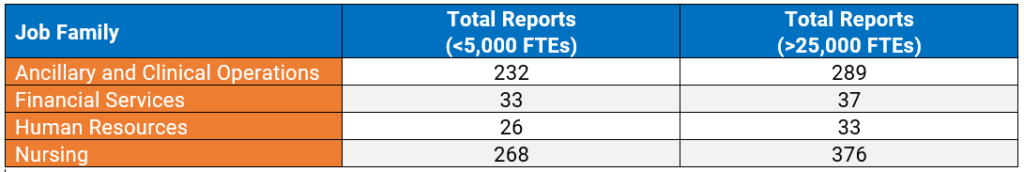
For instance, when evaluating Vice Presidents in Nursing (which may include CNOs of affiliate entities) at smaller organizations (less than 5,000 FTEs), the data show that each VP oversees a median of 268 total direct and indirect reports. At larger organizations (over 25,000 FTEs), each Vice President in Nursing oversees a median of 376 total direct and indirect reports. Across each job family, the number of total reports increases as organization size increases. This highlights the value of scale of an organization in supporting organizational efficiencies. Also, we note that there are more employees within the nursing and operational functions than we typically see in many of the administrative areas (e.g., Marketing, Legal, Human Resources, Finance).
Exhibit 2 below shows the median number of total reports for a Vice President incumbent for select job families by organization size.
Vice Presidents – Median Number of Total (Direct and Indirect) Reports by Job Family and Organization Size
Range of Span of Control by Job Family
SullivanCotter conducted additional research to analyze span of control by job family and each reporting level within that job family (i.e., Chief Officer of a specific job family at level 1, direct reports at level 2, etc.). This analysis shows how span of control structure can vary across reporting levels for certain job families.
Exhibit 3 below highlights the differences between Clinical and Administrative job families. Explanation of the core functions within each job family is included in the Appendix.
Median Direct Reports - Job Family Reporting Level
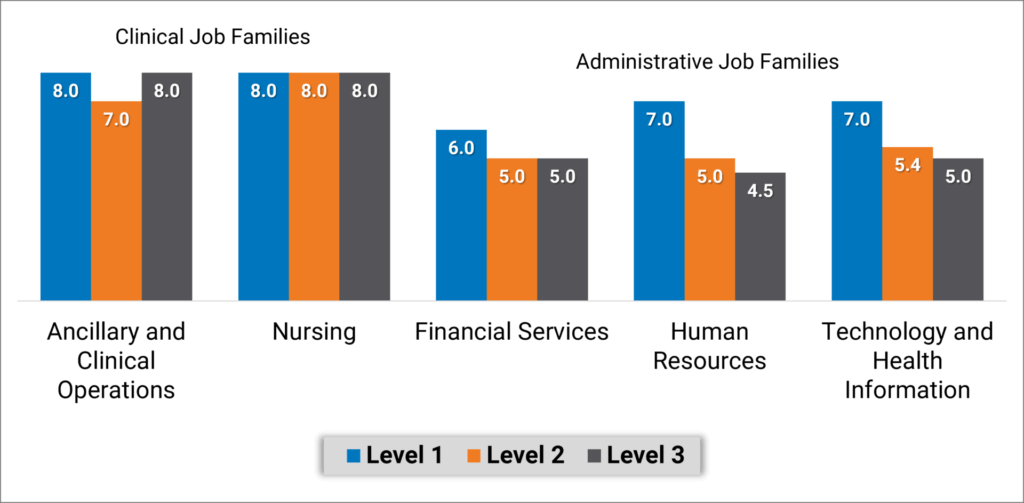
Executives overseeing Nursing and Ancillary and Clinical Operations job families have a more consistent span of control with a median of 7 or 8 direct reports regardless of reporting level. Note that with inpatient nursing having a relatively larger number of employees, median direct span of control for level 2 and 3 nursing executives increases to 9. Median span of control in Administrative job families looks different as top executives in Finance, Human Resources and Information Technology functions, for example, have 6 or 7 direct reports and the executives reporting to them have about 5 direct reports.
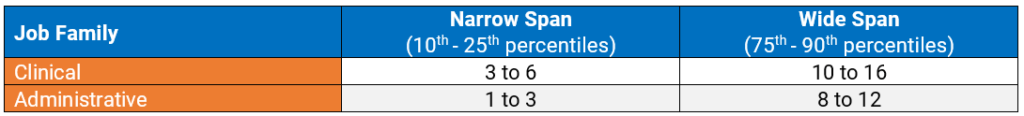
To assess the limits of span of control, SullivanCotter analyzed executives at levels combined across Clinical and Administrative job families. We consider typical span of control to fall between the 25th and 75th percentiles, with narrow or wide span of control falling outside of that range. Health systems can use these benchmarks to identify individuals that fall below the 25th percentile or above the 75th percentile. Based on these data, executives in Administrative job families who have only 1 or 2 direct reports may have an overly narrow span of control. Conversely, executives in Clinical job families who have 15 or 16 direct reports may have a span of control that is too wide. Again, with inpatient nursing having a relatively larger number of employees, the range of data from the 75th percentile to 90th percentile is 12 to 20 direct reports.
Exhibit 4 below identifies the number of directs reports that fall within these two categories.
Range of Span of Control by Job Family
Strategies for Assessing and Redesigning Executive Span of Control
Improving span of control begins with a current state assessment to understand where the health system may deviate from leading practices. These steps include:
- Identify a relevant peer group. Consider the health system’s size and operating model and utilize specific studies or industry surveys (such as SullivanCotter’s Workforce Metrics Benchmark Survey) that contain benchmarks on span of control and management structures. Management consulting firms may also maintain databases and can develop customized comparative analyses.
- Complete an overall span of control analysis across the enterprise. Starting with an overall span analysis may help to identify specific functions or entities that may have outlier data points for further review. Be sure to include both direct and indirect reports.
- Conduct a more detailed span assessment for priority functions such as certain clinical areas or functional support (e.g., revenue cycle, nursing). When conducting detailed analyses for certain clinical or functional support areas (e.g., revenue cycle, nursing), benchmarking against both peer and internal references (e.g., across individual hospitals or entities) is useful in providing additional context. Health systems should also pay attention to individual management incumbents that may be outliers (having many more or less direct reports) compared to benchmarks or to other managers in comparable roles.
- Identify priority areas for improvement. Data-driven insight can help to identify opportunities for improvement. Unique functional nuances or operating models can have an impact on management scope and health systems should consider specific operational characteristics that may contribute to certain individuals having a higher or lower than expected span of control.
In order to right-size executive span of control, there are several key strategies health systems can consider to help facilitate this process:
- Consolidate functional areas (such as the development of Shared Services). For health systems that may have a narrow executive span of control, the consolidation of responsibility under fewer executives can help to widen these. It is important to consider the operational and strategic implications of consolidating or redistributing functional areas and to be deliberate about how similar functions should be grouped together under specific executives.
- Eliminate unnecessary levels. Some health systems may discover that narrow spans of control are the result of too many layers of management. Eliminating a layer can allow for wider span of control while also reducing the number of individuals involved in decision-making and team communication. This, in turn, can help to increase operational efficiency. The optimal number of layers may differ by job family or functional area. Health systems should retain flexibility in their organizational structure to enable customization rather than attempting a ‘one-size-fits-all’ approach.
- Redistribute functional oversight. Certain sub-functions may be assigned to a different executive who has a more narrow span of control to help balance out the ratio of direct reports. In doing this, it is important to balance the number of direct reports across all executives so as not to simply transfer a wide span of control from one executive to another.
- Increase the level of intermediate leadership. Executives with an overly wide span of control may need to add leadership layers in order to spread their scope of responsibility. This does not always mean adding headcount and labor cost. They may choose to elevate one or more of their direct reports and have a handful of functional areas within their scope of responsibility report to this individual instead.
- Re-evaluate total rewards. As individuals are reassigned to different levels, assess their total rewards package to ensure equity across levels. In addition to evaluating market competitive pay based on updated job responsibilities, other total rewards components such as incentive targets, paid time off and benefits eligibility should also be considered.
As health systems select and prioritize these strategies to refine span of control, there are a number of additional considerations to keep in mind:
- Improving span of control is not just about reducing management headcount. Span of control can also influence and impact other aspects of work such as safety, employee engagement, turnover and talent management/professional development. A wider span of control can be linked to lower employee engagement as oversight gets diluted, leading to reduced talent development and career growth.
- While a typical span of control metric involves calculating the ratio of managers to direct reports, health systems should not be focused solely on achieving a target metric. Organization structure needs to be considered in the design of a function to help ensure that the right roles at the right levels are put in place to execute on the operating model. Having the right reporting relationships and management layers in place can also aid with career pathways and succession planning.
- Evolving workforce dynamics also make span of control about much more than the number of managers and staff. Health care span of control ratios have historically been measured on direct in-person supervisory relationships. However, health systems are growing increasingly complex as matrixed reporting and dyad management models become more prevalent. With increased outsourcing, contracted services may not show up under a manager’s official direct reporting. However, these responsibilities still need to be accounted for. The growth of the remote workforce may also impact how we approach people management. While less time may be spent on in-person supervision, health systems are investing in ways to connect more meaningfully and effectively with their employees - which requires sufficient management capacity to execute.
Positive Outcomes
A number of benefits associated with rightsizing span of control have been discussed in this article. The following diagram recaps some of these positive outcomes that health systems have achieved.
| Streamlined Decision Making
Health systems with efficient management structures can come to conclusions more quickly and move on to execution and implementation as fewer individuals are involved in the decision-making process.
|
Efficient Communications
Health systems that streamline management layers find that certain types of information, especially when communicated verbally, flows from senior leaders to staff much faster when less interim levels of management need to receive and in turn pass on those communications.
|
Stronger Talent Development
With the appropriate reporting relationships and manager-to-staff ratios customized for each function, employees can build strong coaching and development ties with their managers. These structures also facilitate succession planning as employees are well-positioned to develop into future leaders.
|
| Greater Operational Efficiencies
Health systems that streamline through consolidation of functions have realized benefits in operational efficiencies such as shared staffing, common data sources, increased interaction and collaboration that drives towards common results. |
Improved Clinical and Staffing Outcomes
Health systems should avoid overly high span of control as that can be linked with lower employee engagement and poor adherence to work standards due to limited managerial investment and day-to-day oversight. In clinical settings, research has shown that a greater span of control can correlate with higher rates of patient infection, employee injuries and staff turnover.1
|
Labor Cost Control
Improvements in span of control are not only about headcount reductions. While some health systems have realized labor cost savings through position eliminations when streamlining their management structure, others have been able to focus on other changes such as shifting positions from VP levels to director levels to prevent a “top heavy” organization structure.
|
1Omery, A., Crawford, C.L., Dechairo-Marino, A., Quaye, B.S., Finkelstein, J. (2019). Reexamining the Nurse Manager Span of Control with a 21st-Century Lens. Nursing Administration Quarterly, 43(12), 230-245. doi:10.1097/NAQ.0000000000000351
Conclusion
The data show that spans of control vary significantly among different operations and functional support areas as well as by executive level. As health systems evaluate their leadership structures, differentiated spans of control should be applied for various cohorts of leaders. Robust benchmark data provide an important reference as health systems determine the optimal spans of control.
Span of control is one aspect to consider when evaluating the ideal management oversight model and should not be reviewed in isolation without other performance metrics. Department leaders must still be accountable for achieving their expected outcomes and quality measures. So while health systems may set targets for executive oversight, they must not become fixated on achieving a specific numerical ratio and lose sight of the overarching goal of balancing the need for senior leaders to focus on strategy and growth while also effectively leading their functions to achieve these goals.
Appendix
Executive Job Level Definitions
- Enterprise CEOs and Presidents: Associates mapped to this level are the enterprise chief executive reporting to the Board of Directors.
- Entity CEOs and Presidents: Associates mapped to this level typically have overall responsibility for a distinct organizational entity.
- Executive Vice Presidents: Associates mapped to this level are typically managers of one or more Senior Vice President subordinates. Typically has responsibility for multiple job families and is found at the second reporting level in the organization. Within SullivanCotter’s standard titling structure jobs found at this level are typically referred to as “Executive Vice President” or “Chief Officer”.
- Senior Vice President:Associates mapped to this level are typically managers of one or more Vice President subordinates. Typically has responsibility for one job family and is found at the second or third reporting level in the organization. Within SullivanCotter’s standard titling structure jobs found at this level are typically referred to as “Senior Vice President” or “Chief Officer”.
- Vice President: Associates mapped to this level are typically third level managers of one or more Director subordinates. Typically has responsibility for multiple functional areas and is often found at the third, fourth or fifth reporting level in the organization. Within SullivanCotter’s standard titling structure jobs found at this level are typically referred to as “Vice President” or “Associate Vice President”.
Select Core Functions within Clinical and Administrative Job Families
Clinical
Ancillary and Clinical Operations includes executives in behavioral and mental health, laboratory, pharmacy and rehabilitation, as well as executives that oversee hospital operations such as the COO and VP of Operations.
Nursing includes executives in care management, inpatient and outpatient nursing, surgical services, transitional care, clinical education, emergency medical services and women's health.
--
Administrative
Financial Services includes executives in functions such as financial administration, tax, audit, planning and analysis, managed care financing, revenue cycle, treasury and investments.
Human Resources includes executives in functions such as diversity and inclusion, employee and labor relations, organizational development, HR operations, leadership and workforce development, talent acquisition and total rewards.
Information Technology (IT) and Health Information includes executives in functions such as IT administration, health information management, IT security, instructional and learning technology, network and infrastructure management, programming and systems development and web services.
Note: As the purpose of this article was to evaluate select job families for conceptual illustration, not every job family or function was analyzed. Examples of other job families not included in the analysis are dietary, housekeeping, maintenance, supply chain, service lines and medical group operations (though ambulatory/outpatient nursing executives are included in Nursing).

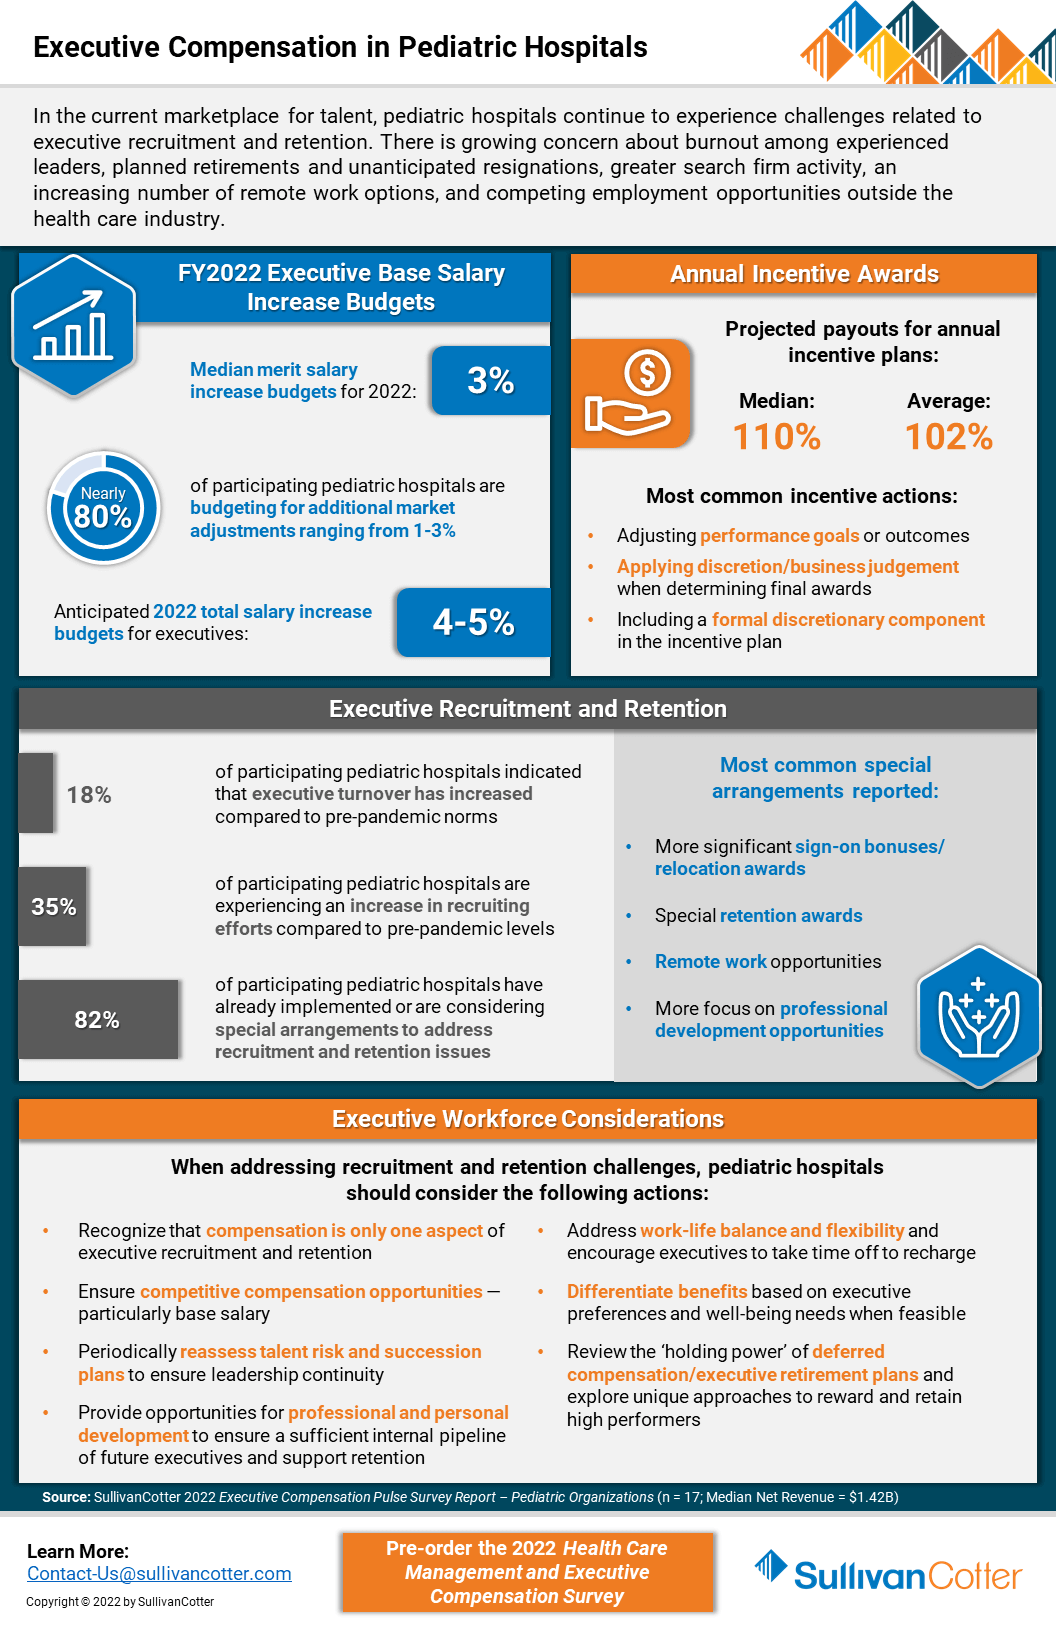
INFOGRAPHIC | Executive Compensation in Pediatric Hospitals
SullivanCotter addresses executive compensation in pediatric hospitals via a recent pulse survey
In the current marketplace for talent, executive compensation in pediatric hospitals is growing increasingly complex as recruitment and retention challenges mount. Organizations remain concerned about burnout among experienced leaders, planned and unanticipated resignations, greater search firm activity, employment opportunities outside the health care industry, and remote work presenting more non-traditional employment opportunities.
SullivanCotter recently conducted a pulse survey to help pediatric hospitals understand how their peers are addressing 2022 executive salary increase budgets and incentive awards for FY2021 performance.
It also highlights other actions these organizations are taking to support executive recruitment and retention.
VIEW INFOGRAPHIC

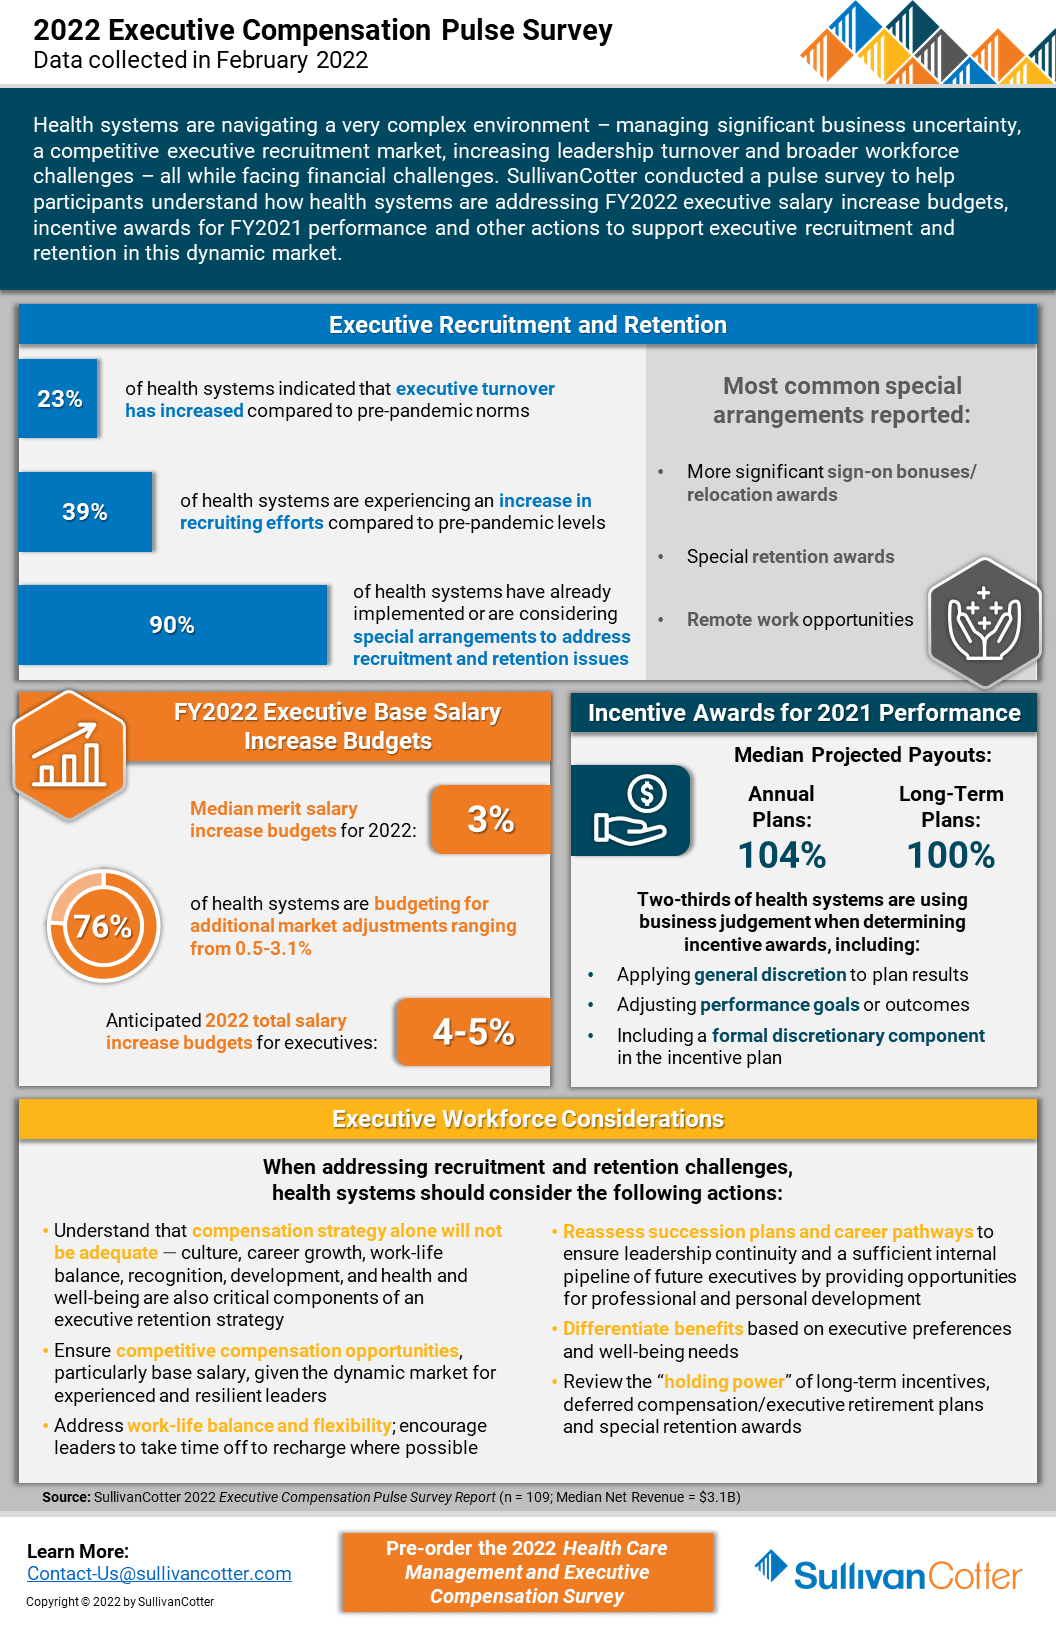
INFOGRAPHIC | 2022 Executive Compensation Pulse Survey
SullivanCotter’s recent executive compensation pulse survey provides insight into how health care organizations are addressing recruitment and retention challenges in an increasingly dynamic marketplace
Health systems are growing increasingly concerned about burnout among experienced leaders, planned retirements and unanticipated resignations, greater search firm activity and employment opportunities outside the health care industry, as well as remote work presenting more non-traditional employment opportunities.
Considering these concerns, SullivanCotter conducted an executive compensation pulse survey to help participants understand how health systems are addressing FY2022 salary increase budgets and incentive awards for FY2021 performance.
It also highlights other actions systems are taking to support executive recruitment and retention in this dynamic market.
VIEW INFOGRAPHIC

PRESS RELEASE | Wayne Hartley Joins SullivanCotter to Help Expand Physician Workforce Advisory Services
Longstanding knowledge in health care operations, finance and human resources
Chicago, IL | March 29, 2022
SullivanCotter, the nation's leading independent consulting firm in the assessment and development of total rewards programs, workforce solutions, and technology and data products for the health care industry and not-for-profit sector, is pleased to welcome back Wayne Hartley as a Principal in the firm's Physician Workforce Practice.
Wayne is an accomplished senior consulting leader with a distinguished history of managing high-quality medical operations and utilizes more than 20 years of direct health care industry experience in his work with clients. With longstanding knowledge in health care operations, finance and human resources, Wayne specializes in helping organizations to strengthen physician compensation program strategy, regulatory compliance and value-based outcomes.
"As health care organizations look for innovative ways to stay ahead of the curve in an ever-changing marketplace, our aim is to leverage a diverse and growing panel of expertise from the industry's best and brightest consultants. We're thrilled to welcome Wayne back to SullivanCotter and, with his unique skillset and insight, look forward to learning from his extensive clinical and operational leadership experience, building strategic partnerships with new and existing clients, and expanding the firm's clinical workforce advisory services," said Mark Ryberg, Physician Workforce Practice Leader, SullivanCotter.
In his new role with SullivanCotter, Wayne will work with clients to lead physician compensation design projects and develop models to support organization-wide goals as they relate to patient access, panel size, productivity, quality and more. Additionally, he will advise organizations on the fair market value and commercial reasonableness of physician transactions to enhance compliance and mitigate risk, liaise with boards and physician leaders on high-value business strategies, and introduce new methodologies to assess and improve health system readiness for risk-based reimbursement.
Wayne also serves on the firm's Large Clinic™ Group Growth Team in which he helps to direct strategy and member engagement for the 45-year-old independent affinity group comprised of the largest medical organizations in the U.S.
Prior to joining the firm, Wayne previously served in a variety of leadership positions for a number of nationally-recognized consulting firms. He also has a wealth of clinical and operational experience from his time at two of the largest health systems in Minneapolis.
About SullivanCotter
SullivanCotter partners with health care and other not-for-profit organizations to understand what drives performance and improve outcomes through the development and implementation of integrated workforce strategies. Using our time-tested methodologies and industry-leading research and information, we provide data-driven insights, expertise, data and technology products to help organizations align business strategy and performance objectives – enabling our clients to deliver on their mission, vision and values.
READ ON PR NEWSWIRE

PRESS RELEASE | Enhancing PPMT™ User Experience for Physicians and APPs
Identifying opportunities to educate and engage the clinical workforce
Chicago, IL | March 23, 2022
SullivanCotter, the nation's leading independent consulting firm in the assessment and development of total rewards programs, workforce solutions, and technology and data products for the health care industry and not-for-profit sector, announces new functionality for its growing Provider Performance Management Technology™ (PPMT™) platform that enhances ease of access and usability for physicians and advanced practice providers (APPs). PPMT™ is an industry-first, cloud-based product that engages the clinical workforce and informs leaders through transparent performance-based compensation administration, contract management, and analytical and reporting capabilities.
New functionality includes valuable upgrades to the PPMT™ portal – allowing physicians and APPs one-click access to view key performance indicators via mobile or desktop. This provides physicians and APPs with a quicker line of sight into current performance and productivity results and enhances their ability to track progress against goals on their personal landing page. PPMT's more robust reporting capabilities are also still available for clinicians who are looking to dive deeper into detailed productivity, performance, and compensation results.
The focus on physician and APP engagement is further enhanced with the addition of self-service utilization reporting for compensation administrators. Enabling administrators to easily see which physicians and APPs have been utilizing PPMT™ and what reports have been accessed helps them to identify opportunities to engage the clinical workforce. "Administrators, leaders and managers are often having conversations with individual clinicians about their compensation and these reports help them to go into these meetings better prepared with opportunities to engage and educate their colleagues," said Shelly Slowiak, Director of Product Support - PPMT™, SullivanCotter.
Designed to address a spectrum of physician, leadership and other key stakeholder needs, PPMT™ combines years of health care compensation insight and expertise with an intuitive and automated technology platform to help drive performance and support the transition from volume- to value-based care.
"The needs of the health care organizations we serve are dynamic and ever-changing – especially in a marketplace that has grown increasingly complex in the past two years. SullivanCotter remains dedicated to continually enhancing our technology products to drive greater value for clients by understanding these needs and evolving alongside them," said David Schwietz, Chief Information Officer, SullivanCotter.
For more information on these enhancements or our entire suite of Provider Performance Management Technology™, visit www.sullivancotter.com/PPMT or contact us at 888.739.7039.
About SullivanCotter
SullivanCotter partners with health care and other not-for-profit organizations to understand what drives performance and improve outcomes through the development and implementation of integrated workforce strategies. Using our time-tested methodologies and industry-leading research and information, we provide data-driven insights, expertise, data and technology products to help organizations align business strategy and performance objectives – enabling our clients to deliver on their mission, vision and values.
READ ON PR NEWSWIRE

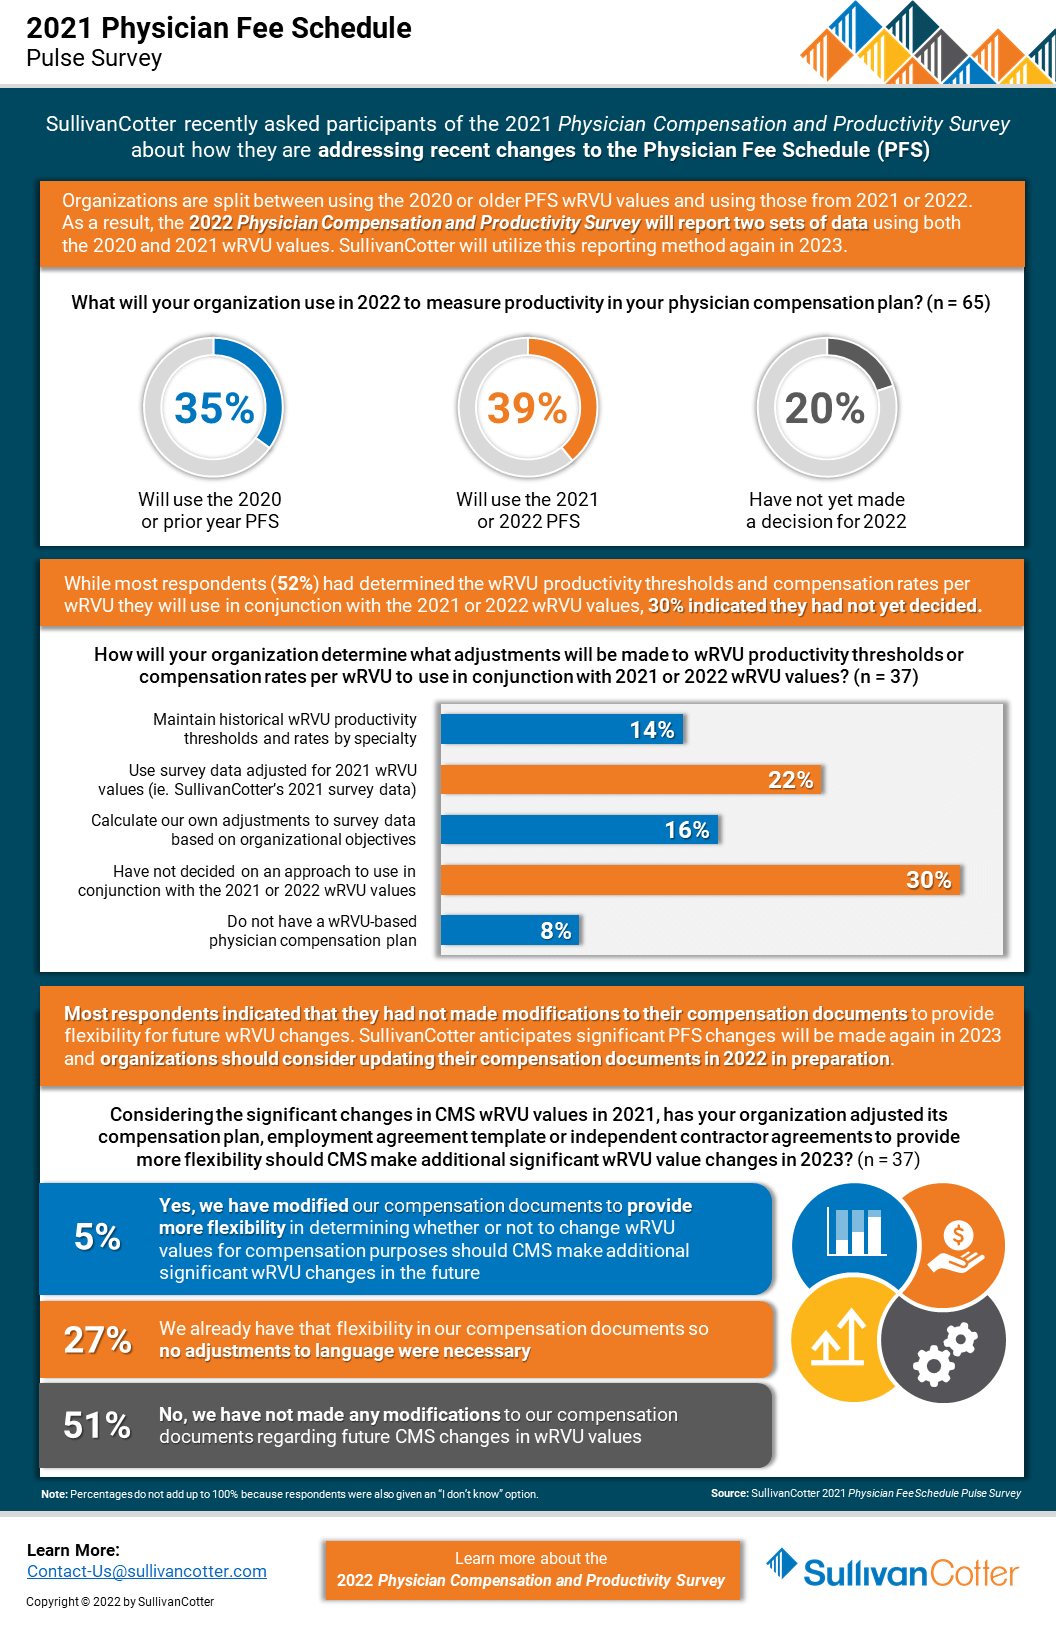
INFOGRAPHIC | Pulse Survey Results: 2021 Physician Fee Schedule Changes
How are health care organizations addressing the 2021 Physician Fee Schedule changes?
Following its annual review of the American Medical Association’s Relative Value System Update Committee’s recommendations, the Centers for Medicare and Medicaid Services (CMS) finalized proposed changes to the 2021 Physician Fee Schedule and has significantly overhauled the Evaluation and Management (E&M) code documentation requirements, time-effort recognition, and wRVU values for new and established patient office visits. These changes were effective as of January 1, 2021.
As organizations look to understand the impact of these changes on reported physician productivity levels, it is also important to assess the effect it will have on physician compensation arrangements, fair market value and commercial reasonableness considerations, financial sustainability and national survey benchmarks.
SullivanCotter recently conducted a pulse survey for participants in the 2021 Physician Compensation and Productivity Survey to assess how organizations are addressing these changes. View highlights from the results – including insight into expected adjustments to work RVU productivity thresholds and compensation rates per work RVU.
VIEW INFOGRAPHIC

Registered Nurses | Strategies to Recruit and Retain
Looking for better strategies to recruit and retain registered nurses?
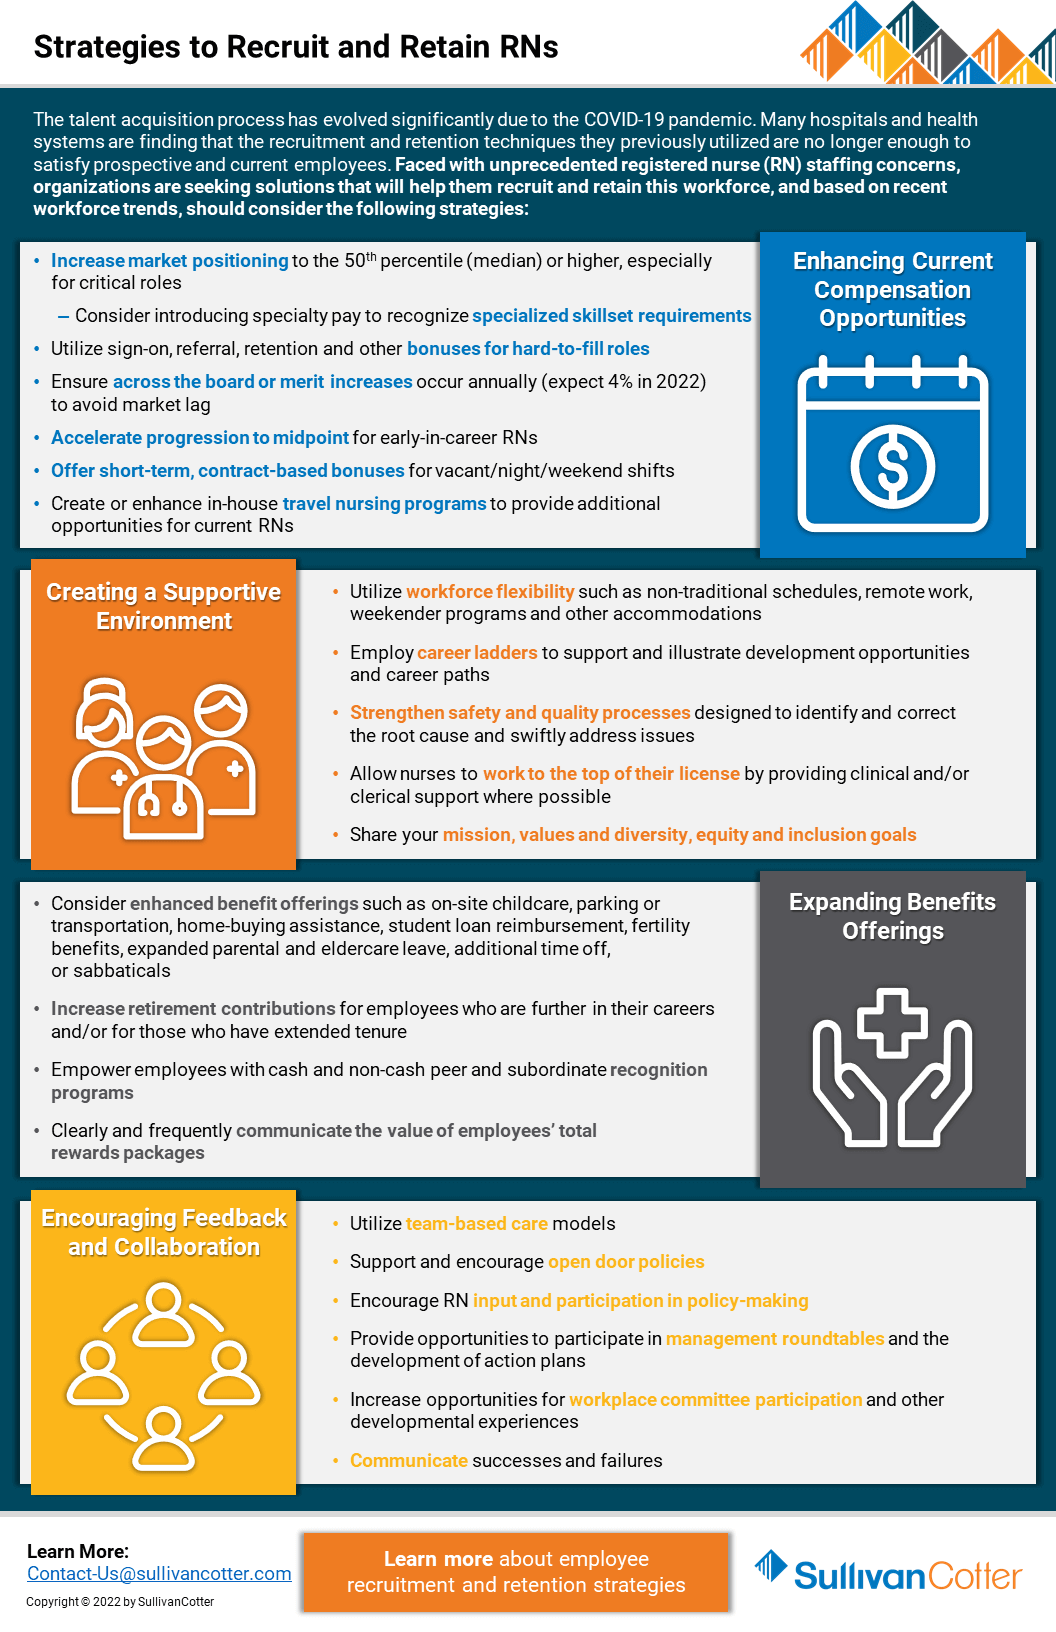
The talent acquisition process has evolved significantly due to the COVID-19 pandemic. Many hospitals and health systems are finding that the recruitment and retention techniques they previously utilized are no longer enough to satisfy prospective and current employees. Faced with unprecedented staffing concerns regarding registered nurses (RN), organizations are seeking solutions that will help them recruit and retain this workforce.
Based on recent workforce trends, hospitals and health systems should consider the following strategies:
Enhancing Current Compensation Strategies
- Increase market positioning to the 50th percentile (median) or higher, especially for critical roles
- Consider introducing specialty pay to recognize specialized skillset requirements
- Utilize sign-on, referral, retention and other bonuses for hard-to-fill roles
- Ensure across-the-board or merit increases occur annually (expect 4% in 2022) to avoid market lag
- Accelerate progression to midpoint for early-in-career RNs
- Offer short-term, contract-based bonuses for vacant/night/weekend shifts
- Create or enhance in-house travel nursing programs to provide additional opportunities for current RNs
Creating a Supportive Environment
- Utilize workforce flexibility such as non-traditional schedules, remote work, weekender programs and other accommodations
- Employ career ladders to support and illustrate development opportunities and career paths
- Strengthen safety and quality processes designed to identify and correct the root cause and swiftly address issues
- Allow nurses to work to the top of their license by providing clinical and/or clerical support where possible
- Share your mission, values and diversity, equity and inclusion goals
Expanding Benefits Offerings
- Consider enhanced benefit offerings such as on-site childcare, parking or transportation, home-buying assistance, student loan reimbursement, fertility
benefits, expanded parental and eldercare leave, additional time off, or sabbaticals - Increase retirement contributions for employees who are further in their careers and/or for those who have extended tenure
- Empower employees with cash and non-cash peer and subordinate recognition programs
- Clearly and frequently communicate the value of employees’ total rewards packages
Encouraging Feedback and Collaboration
- Utilize team-based care models
- Support and encourage open-door policies
- Encourage RN input and participation in policy-making
- Provide opportunities to participate in management roundtables and the development of action plans
- Increase opportunities for workplace committee participation and other developmental experiences
- Communicate successes and failures
Looking for additional workforce insights and data?
Contact us to learn more about employee recruitment and retention strategies

PRESS RELEASE | SullivanCotter Partners with Paradigm for Parity®
Reinforcing SullivanCotter's commitment to championing gender equality in corporate leadership positions
Chicago, IL | March 8, 2022
SullivanCotter, the nation’s leading independent consulting firm in the assessment and development of total rewards programs, workforce solutions, and technology and data products for the health care industry and not-for-profit sector, is pleased to announce its commitment to achieving gender parity within the firm’s executive leadership team by 2030.
“Ensuring an equitable and inclusive workforce has long been a cornerstone of SullivanCotter’s mission, vision and values. As a member of the Paradigm for Parity® movement, we are reinforcing our commitment to actively closing the gender gap by enhancing female representation and ensuring women of all cultures, races and backgrounds are able to thrive and advance within our firm,” said Ted Chien, President and CEO, SullivanCotter.
By implementing the Paradigm for Parity® 5-Point Action Plan, SullivanCotter is part of a coalition of companies dedicated to promoting gender equality through the minimization or elimination of unconscious bias in the workplace. The plan calls for members to accelerate the pace of change by significantly increasing the number of women in senior operating roles to 30% in the near-term, measuring targets and maintaining accountability by providing regular progress reports, basing career progress on business results and performance, and providing sponsors, not just mentors, to help position women leaders for long-term success.
"Paradigm for Parity® is excited to welcome SullivanCotter to our coalition of companies working to close the corporate leadership gender gap for women of all races, cultures and backgrounds," said Sandra Quince, CEO, Paradigm for Parity®. "Using our Paradigm for Parity® Toolkit and 5-Point Action Plan, companies can act on their commitments to gender parity and accelerate the advancement of women into leadership positions. We applaud SullivanCotter’s dedication to diversity, equity and inclusion to achieve gender parity in corporate leadership."
SullivanCotter’s Women’s Council, a group formed to raise awareness of women’s experiences and promote a workplace culture of balance and inclusivity, will help to identify opportunities and recommend initiatives designed to support the Paradigm for Parity® Roadmap as the firm moves forward with its pledge.
About the Paradigm for Parity® Movement
The Paradigm for Parity® coalition is comprised of CEOs, senior executives, founders, board members and business academics who are committed to achieving a new norm in corporate leadership: one in which women and men have equal power, status, and opportunity.
The coalition created the Paradigm for Parity® 5-Point Action Plan for corporations to accelerate the pace of gender equity in senior executive roles. This unique agenda defines bold and specific actions that, taken together and simultaneously implemented as a package, will catalyze change and enable today’s business executives to secure the best leaders of tomorrow. Visit www.paradigm4parity.com or follow us on Twitter using @p4parity to learn more about this exciting initiative.
READ ON NEWSDIRECT

INFOGRAPHIC | Split/Shared Visits
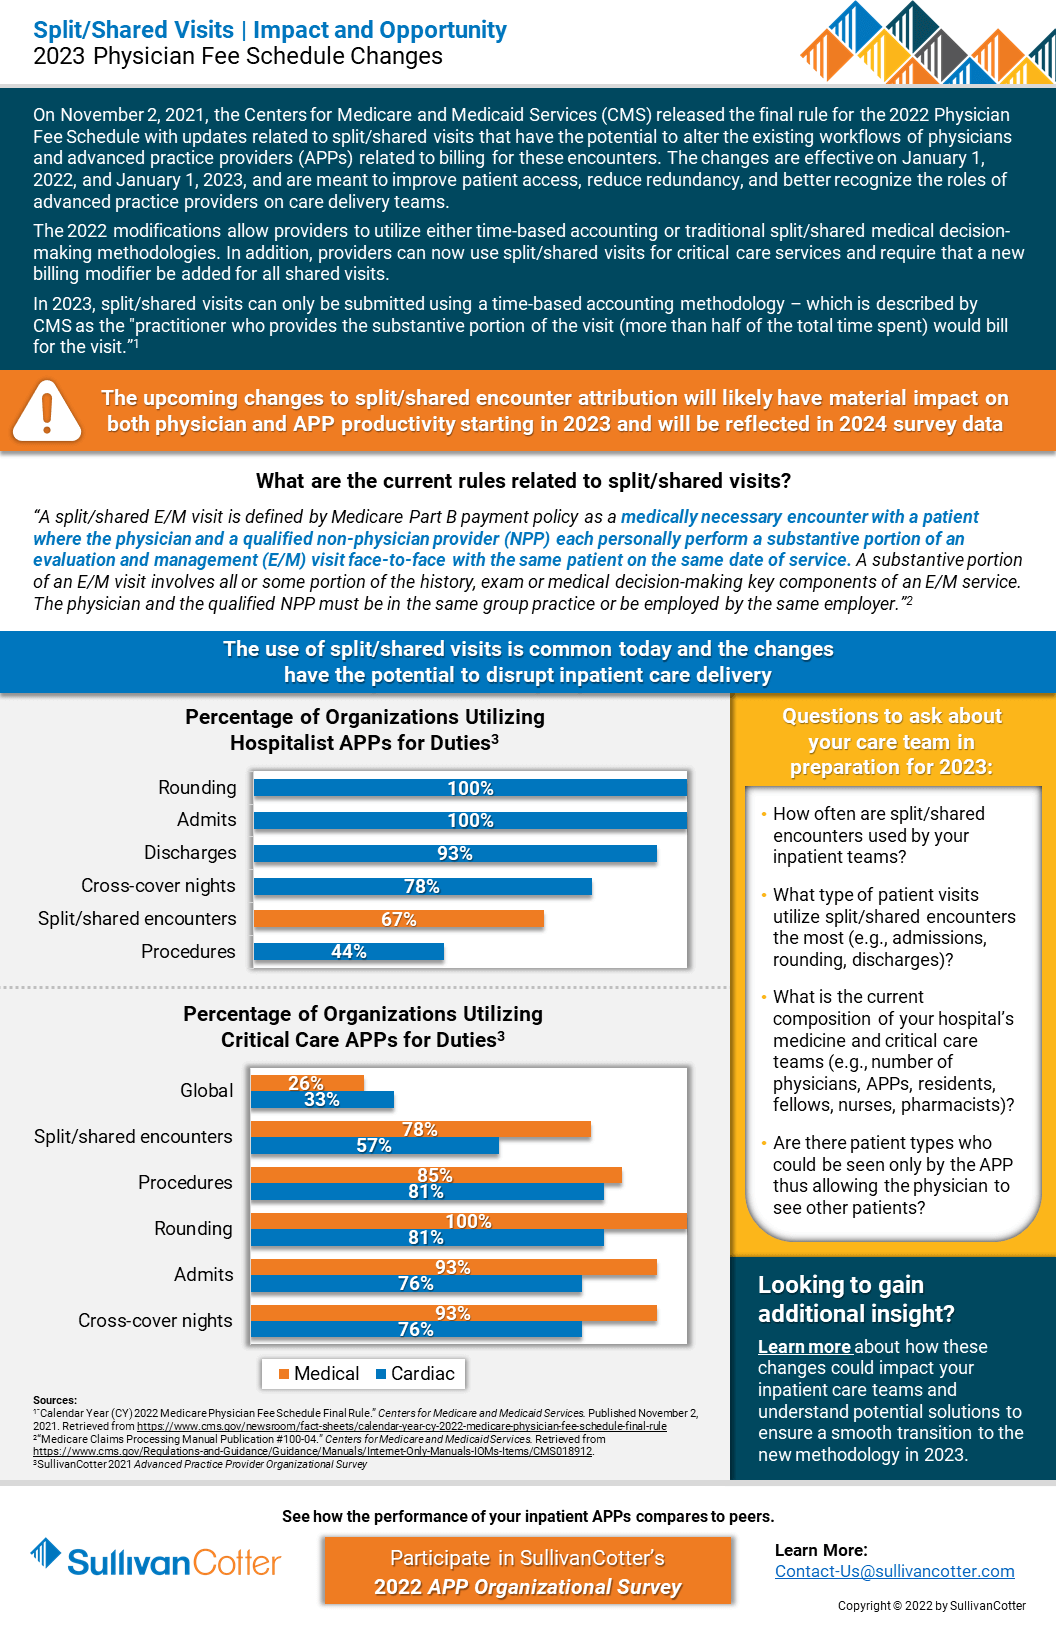
Split/Shared Visits: Understanding the impact and opportunity of the 2023 Physician Fee Schedule Changes
RELATED CONTENT
ARTICLE | 2022 Physician Fee Schedule Changes
On November 2, 2021, the Centers for Medicare and Medicaid Services (CMS) released the final rule for the 2022 Physician Fee Schedule with updates related to split/shared visits that have the potential to alter the existing workflows of physicians and advanced practice providers (APPs) related to billing for these encounters. The changes are effective on January 1, 2022, and January 1, 2023, and are meant to improve patient access, reduce redundancy, and better recognize the roles of advanced practice providers on care delivery teams.
The 2022 modifications allow providers to utilize either time-based accounting or traditional split/shared medical decision-making methodologies. In addition, providers can now use these visits for critical care services and require that a new billing modifier be added for all shared visits.
In 2023, split/shared visits can only be submitted using a time-based accounting methodology – which is described by as the “practitioner who provides the substantive portion of the visit (more than half of the total time spent) would bill or the visit.”
Learn more about the current rules related to split/shared visits.
VIEW INFOGRAPHIC

INFOGRAPHIC | 2021 Health Care Staff Compensation Survey
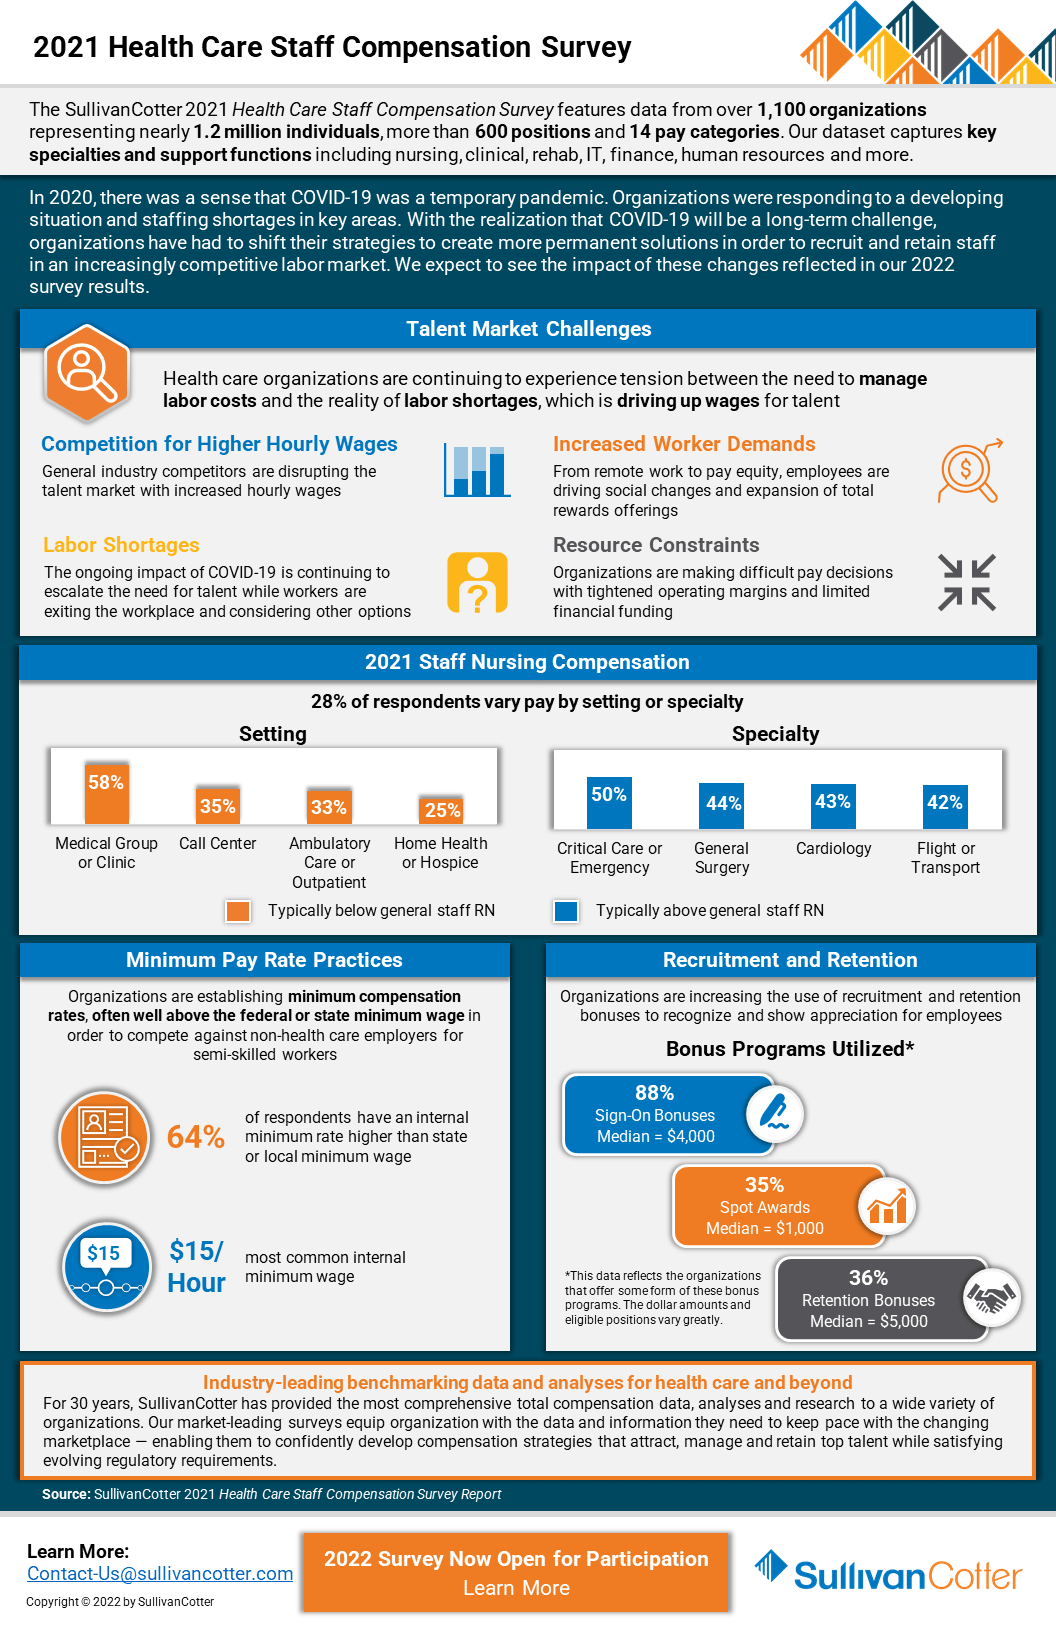
Hospitals and health systems continue to experience tension between the need to manage labor costs and health care staff compensation with the reality of employee workforce shortages
In 2020, there was a sense that COVID-19 was a temporary pandemic. Organizations were responding to a developing situation and dealing with staffing shortages in key areas.
Results from SullivanCotter’s 2021 Health Care Staff Compensation Survey help to shed some light on the impact of the pandemic on the industry’s employee workforce. Featuring data from over 1,100 organizations representing nearly 1.2 million individuals, more than 600 positions and 14 pay categories, this dataset provides insight into key specialties and support functions including nursing, clinical, rehab, IT, finance, human resources and more.
With the realization that COVID-19 will be a long-term challenge, organizations have had to shift their strategies to create more permanent solutions in order to recruit and retain staff in an increasingly competitive labor market. We expect to see the impact of these changes reflected in our 2022 survey results.
The 2022 survey is now open! Submit data to gain access to exclusive participant benefits.
DOWNLOAD INFOGRAPHIC

INFOGRAPHIC | Advanced Practice Provider Productivity
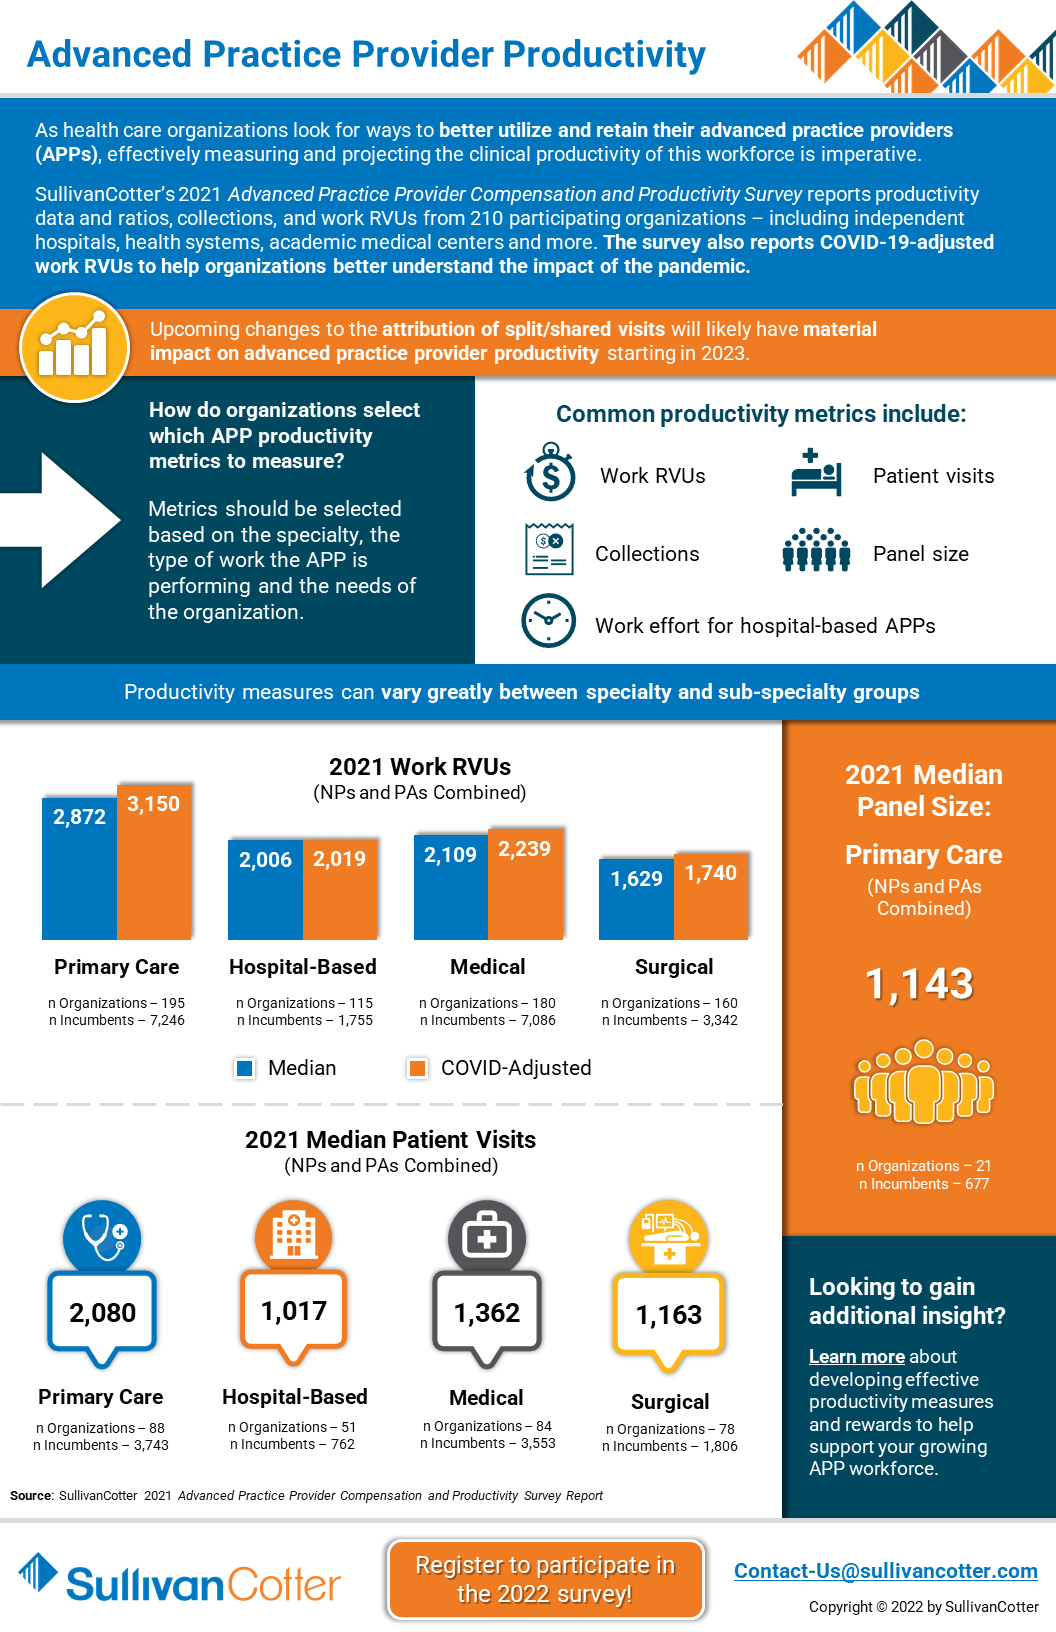
How do health care organizations select which APP productivity metrics to measure?
As health care organizations look for ways to better utilize and retain their clinical workforce, effectively measuring and projecting advanced practice provider productivity is imperative.
SullivanCotter’s 2021 Advanced Practice Provider Compensation and Productivity Survey reports productivity data and ratios, collections, and work RVUs from 210 participating organizations – including independent hospitals, health systems, academic medical centers and more. The survey also reports COVID-19-adjusted work RVUs to help organizations better understand the impact of the pandemic.
The 2022 survey is now open! Submit data to gain access to exclusive participant benefits.
Looking to gain additional insight?
Learn more about developing effective productivity measures and rewards to help support your growing APP workforce.
DOWNLOAD INFOGRAPHIC

E-Book | Key Agenda Items for Health Care Board Committees
Supporting health care board committee effectiveness in a changing environment
ACCESS E-BOOK
SullivanCotter has contributed two chapters to the third edition of the comprehensive e-book from McDermott Will & Emery entitled Key Agenda Items for Board Committees: Supporting Committee Effectiveness in a Changing Environment.
> Trends and Priorities for the Human Capital Committee
Authors: Tim Cotter, Managing Director - Kathy Hastings, Executive Workforce Practice Leader - Cathy Loose, Employee Workforce Practice Leader
Is your organization equipped to address ongoing industry challenges in 2022 and beyond? COVID-19 has not only accelerated dramatic shifts within health care, it also has become a catalyst for change in workforce strategies. Identifying emerging trends and practices and understanding their impact is important for the human capital committee to consider as it plans for the upcoming year.
> 10 Questions for the Compensation Committee
Authors: Tim Cotter, Managing Director - Bruce Greenblatt, Managing Principal
What important items should the Compensation Committee be considering as it plans for 2022 and beyond? SullivanCotter addresses important committee priorities, compensation-related matters such as executive salary adjustments and incentive programs, critical diversity, equity and inclusion initiatives, and more.

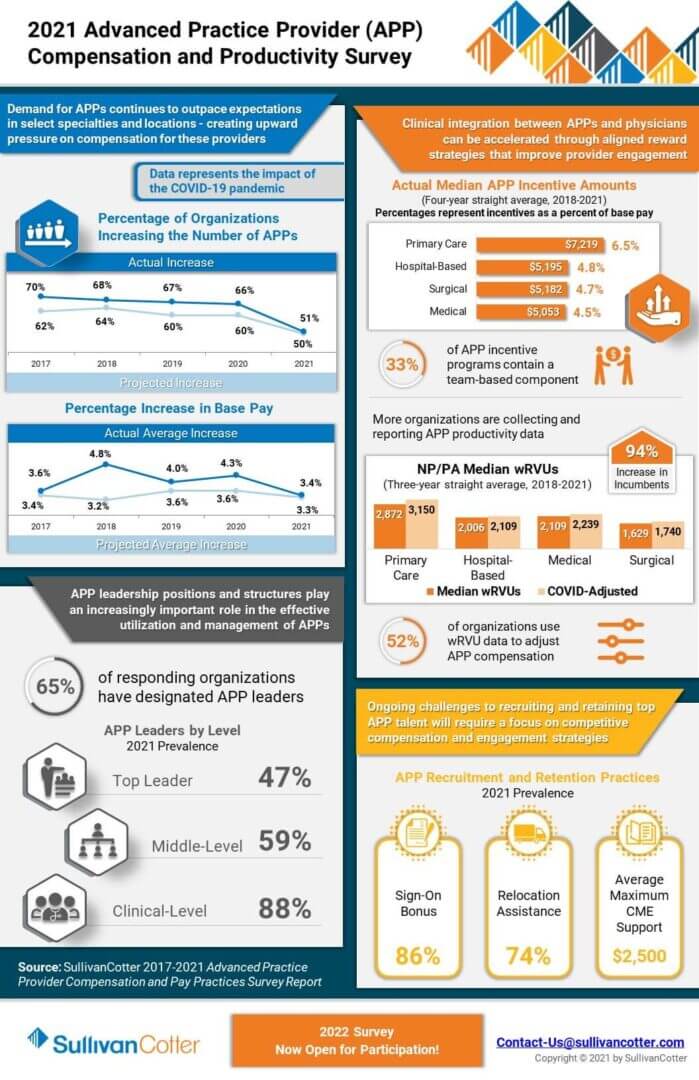
INFOGRAPHIC | 2021 Advanced Practice Provider Compensation and Productivity Survey
Market-leading survey data to help manage the growing APP workforce
As health care organizations nationwide continue to increase the size of their advanced practice provider workforce, the market’s interest in data-driven intelligence to help recruit, retain, and engage this critical provider group is growing.
View highlights from SullivanCotter’s 2021 APP Compensation and Productivity Survey – featuring data on more than 92,000 thousand individual APPs (nurse practitioners, physician assistants, certified registered nurse anesthetists, certified anesthesiologist assistants and certified nurse midwives) and nearly 2,200 APP leaders.
The survey collects and reports important advanced practice provider benchmarking information as it relates to utilization, productivity, compensation, pay practices as well as addressing important issues such as APP turnover and vacancy rates. Additionally, this year’s results contain the first set of benchmark data following the onset of COVID-19 and represent an important resource for organizations needing pre and post-pandemic reference points.
The 2022 survey is now open! Submit data to gain access to exclusive participant benefits.
DOWNLOAD INFOGRAPHIC

PRESS RELEASE | Aimee Greeter Joins Physician Workforce Practice
Leading pay and career equity initiatives with organizations looking to improve fairness, transparency and advancement
Chicago, IL | January 25, 2022
SullivanCotter, the nation’s leading independent consulting firm in the assessment and development of total rewards programs, workforce solutions, and technology and data products for the health care industry and not-for-profit sector, is pleased to announce the addition of Aimee Greeter, Principal, to the firm’s growing Physician Workforce Practice.
For nearly 15 years, Aimee has served as a trusted advisor to a variety of health care provider organizations nationwide. As the industry continues to undergo significant change, Aimee works with physician groups and health systems of all sizes to develop competitive compensation and rewards strategies focused on supporting pay equity and enhancing physician engagement.
“In the wake of a COVID-19 resurgence, recent changes to the Physician Fee Schedule, and a looming provider shortage, hospitals and health systems are dealing with a myriad of challenging present-day obstacles,” said Mark Ryberg, Physician Workforce Practice Leader, SullivanCotter. “Aimee’s deep-seated industry knowledge and strategic insight reinforces our ability to provide clients with the guidance needed to develop innovative solutions to complex issues as they plan for 2022 and beyond.”
Aimee specializes in helping organizations assess, develop and implement pay and career equity initiatives and consults with employers on ways to improve fairness, transparency and advancement for all people regardless of their gender identity, race and ethnic background. She also works closely with clients to optimize physician and advanced practice provider alignment and affiliation activities to support quality care outcomes, cost efficiencies, integrated care team delivery and patient-centered operations.
Aimee has additional experience in conducting clinical service line reviews, providing advisory support on mergers and acquisitions, and facilitating boards and executive leaders in strategic planning and growth initiatives related to market sustainability, care delivery transformation and business model evolution.
Before joining SullivanCotter, Aimee held senior leadership roles at a boutique health care consulting group.
Aimee is the author of the recently published book Effective Crisis Leadership in Healthcare: Lessons Learned from a Pandemic and is a popular national speaker on topics of crisis leadership, health care transactions and provider engagement. She is also a Fellow in the American College of Healthcare Executives and holds a Lean Six Sigma Yellow Belt.
READ ON NEWSDIRECT

APPs: 2021 Evaluation and Management CPT Codes
Part II: Understanding the Impact on Advanced Practice Providers
DOWNLOAD FULL ARTICLE
RELATED CONTENT:
PART I | 2021 E&M CPT Code Changes: Understanding the Impact on Physician Compensation
INFOGRAPHIC | Considerations for Addressing the 2021 E&M Work RVU Changes
ARTICLE | Navigating Change: Implications of the 2021 Physician Fee Schedule
SullivanCotter's CPT Advisory Services and Technology Solutions
BACKGROUND
Every year, the Centers for Medicare and Medicaid Services (CMS) evaluates the recommendations of the American Medical Association’s Relative Value System Update Committee and conducts its own review of the Work Relative Value Unit (wRVU) values associated with each Current Procedural Terminology (CPT) code to determine if revisions are needed based on the time, skill, training and intensity necessary to perform each service. The degree of change varies from year to year, and the impact on individual specialties depends on which codes are modified and the extent to which the codes are adjusted.
CURRENT SITUATION
At the end of 2019, CMS proposed widespread modifications to a subset of the Evaluation and Management (E&M) CPT codes (99201-99215) that include face-to-face office visits and other outpatient services for new or established patients. The goal of the adjustments is to provide an increase in certain wRVU values to address added responsibilities clinicians have absorbed over the last five years, reduce documentation requirements, recognize extended patient visits, and account for qualified, severe or complex chronic conditions. On December 1, 2020, CMS finalized the 2021 Physician Fee Schedule – which went into effect on January 1, 2021.
Additionally, in response to COVID-19, CMS has implemented new guidance as it relates to telehealth services. Although it is unknown whether these CPT code changes will be maintained or altered as the pandemic subsides, the agency has indicated a desire to make longstanding revisions to telehealth visit valuations. While the 2021 Physician Fee Schedule final rule permanently expanded some of the telehealth changes for rural communities, the adoption of the telehealth changes has not been identified as permanent.
In Part I of this series, SullivanCotter explored the impact of the E&M code changes on physician compensation and productivity levels as well as other implications health care organizations must be mindful of as they plan physician compensation for 2021 and beyond. For additional background, Part I also included a detailed summary of the final changes – including greater insight into the “Patients Over Paperwork” goal, the results of a work-effort/time-study commissioned by CMS, and two related add-on codes.
As we continue to assess how these changes affect the clinical workforce, Part II in this series reviews the impact on advanced practice providers (APPs).
ADDRESSING THE IMPACT ON ADVANCED PRACTICE PROVIDERS
Based on the overlapping scope of services performed by APPs and physicians, CMS modifications to CPT code valuations will impact both APPs and physicians. At a broad level, these changes include:
- An increase in wRVUs for most office-visit E&M CPT codes due to added responsibilities clinicians have absorbed over the last five years.
- A 3.3% reduction in the Medicare conversion factor (now $34.89) for physician fee schedule payments to maintain budget neutrality that impacts all E&M services no matter who provided the service.
- An add-on code to recognize extended office-visit time.
Due to the differences in practice patterns between APPs and physicians, there will be some variation in how the changes will impact APPs as compared to physicians. The differences may include the following factors:
- APPs often perform a greater amount of non-billable work and provide services covered under a global visit.
- APPs may see lower acuity patients in some specialties or settings.
- In our analysis of reported CPT data, APPs in surgical specialties report E&M services (e.g. office visits) as a greater proportion of their overall work compared with physicians who report a relatively greater proportion of procedures and surgeries.
Additionally, there are some APP-specific provisions that may affect scope of practice:
- Effective as of January 1, 2021, Medicare now permits physician assistants (PAs) to perform diagnostic tests in accordance with supervisory requirements outlined in state law rather than in Medicare’s general supervision requirements. This change means that PAs are no longer subject to two sets of requirements as Medicare now defers to state policy instead. This helps to reduce administrative burden and potential confusion within organizations about which regulations to follow.1
- The rule for 2021 allows all APPs (APRNs and PAs) to supervise the performance of diagnostic tests in accordance with their state’s scope of practice. Previously, only physicians were authorized to do so. The ability of APPs to be able to perform diagnostic tests will likely have an impact on APP procedural specialties like interventional radiology and some medical specialties such as cardiology and gastroenterology.2
As health care organizations absorb these changes and plan for what lies ahead, there are a number of practical implications for APP productivity and compensation to keep in mind. This article helps organizations to understand and address the impact on APP productivity levels in various specialties, temporary changes to telehealth codes, and unintended consequences for APP productivity-based incentive plans. It also highlights other variables that could influence the assessment of APP productivity – such as survey benchmarks and how to utilize these going forward.
WORK RVU ADJUSTMENTS
The impact of the wRVU changes may result in material shifts in wRVU productivity for APPs. According to SullivanCotter’s 2020 Advanced Practice Provider Compensation and Pay Practices Survey, over 40% of APPs work in office-based specialties and ambulatory clinics.
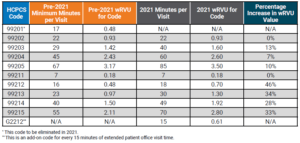
Table 1 below compares the pre-2021 E&M code time allocation and wRVUs to the January 2021 changes.
Note that the established office-visit codes 99212-99215, which are the most frequently used office-visit codes, show the most significant increases between 28%-46%. To balance CMS’ expenditures, the 2021 conversion factor, which is multiplied by total RVUs to determine Medicare payments to physicians and APPs, has dropped by 3.3% from $36.09 to $34.89. SullivanCotter notes that approximately half of the rate reduction mitigation is designated only for the 2021 calendar year as a result of the Consolidated Appropriations Act of 2021 – meaning an additional conversion factor reduction looms for 2022.
This change impacts all clinicians regardless of specialty and, combined with the E&M wRVU increases, creates a redistribution of federal payer reimbursement from proceduralists and hospital-based specialties to cognitive specialties.
Table 1: Time Allocations and wRVUs Adjustments: Current Versus 2021
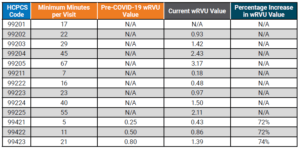
Additionally, there are CPT code changes related to COVID-19 that will impact both physician and APP compensation and productivity. In March 2020, CMS expanded the Medicare telehealth coverage waiver to enable beneficiaries to receive a wider range of health care services from clinicians without having to travel to a health care facility. The announcement expanded previous telehealth coverage for beneficiaries living in rural areas who were able to receive care at a local facility with a clinician from a remote area.3
Under the new provisions, all beneficiaries are able to receive telehealth coverage. Effective March 2020, telehealth services were paid under the Medicare Physician Fee Schedule at the same rate as in-person services.
Table 2 below compares the pre-COVID-19 E&M code time allocation and wRVUs to the changes made in March 2020. It is unclear how long CMS plans to keep the expanded rates in place.
Table 2: Telehealth wRVU Adjustments: Results of 2020 Waivers
THREE IMPORTANT POTENTIAL IMPACTS TO APP PRODUCTIVITY LEVELS AND RESULTING COMPENSATION AND BENCHMARK MEASUREMENTS
1. How will the 2021 wRVU changes impact the measurement of APP productivity?
This common question is complex for APPs given that productivity benchmarks have generally been difficult to collect and interpret due to the wide variation in how APPs are utilized – even within the same specialty. Historically, productivity data has been absent, inconsistent or inaccessible due to the variety of billing practices used to capture APP work effort including shared visits and incident-to billing. Additionally, APPs often perform more non-revenue generating work compared to physicians in the same specialty (e.g., global visits) – contributing to inconsistency and difficulty in collecting the data.
To help analyze the impact, SullivanCotter used its proprietary database consisting of individual CPT code volumes and modifiers for approximately 3,000 APPs across 45 different specialties. Two sets of wRVU productivity benchmarks were calculated for comparison. One is based on the pre-2021 wRVU values, and one is based on the 2021 wRVU values. By keeping volumes and distribution consistent, the resulting change in wRVU productivity is due entirely to the E&M wRVU adjustments.
Summary findings indicate that of the 45 specialties reviewed, the average change for all specialties due to the E&M adjustments is 14.6%. As shown in Table 3 below, nearly half (44.4%) of wRVU benchmarks increased between 6% and 17%. An additional 44.4% of specialties were impacted by changes greater than 17%. Only two specialties had changes of less than 1%.
Table 3: Overall APP Specialty Impact of 2021 E&M Changes
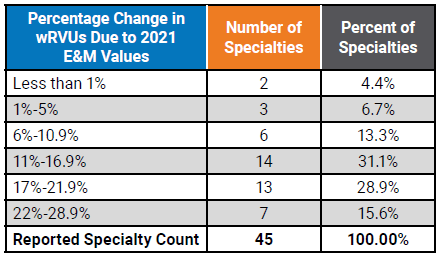
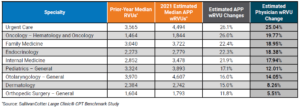
Table 4 below shows a representative sample of the resulting impact at the specialty level. This represents a significant change to wRVU benchmarks in many specialties and will be important for organizations to understand the implications to APP compensation payouts and affordability in all of the various specialties and care teams. Comparing the estimated wRVU changes for APPs and physicians in the same specialty shows general alignment in the medical and primary care specialties with a greater impact on the APPs in surgical specialties due to the higher utilization of E&M visits by APPs compared to physicians.4
Table 4: Median wRVU Impact of 2021 E&M wRVU Changes
2. How will wRVU changes impact compensation for APPs differently than physicians?
The impact will vary for a few notable reasons.
According to SullivanCotter’s 2020 Advanced Practice Provider Compensation and Pay Practices Survey, only 56% of organizations use wRVU data to adjust APP compensation as compared to greater than 90% for physicians.5,6 Because APP compensation is typically salary-based, APPs are less susceptible to compensation impacts due to the CPT adjustments.
Additionally, nearly half of APPs with an incentive component in their compensation plan have the productivity-based incentive amount capped – which will affect the degree to which compensation will be impacted.5
Finally, in our experience, the market compensation per wRVU rate for APPs is often utilized in a different manner compared with physicians. Physician compensation plans typically directly utilize the market compensation per wRVU benchmark rate as a major incentive to drive compensation. For APPs, whose compensation plans are not as heavily incentivized as physician plans, organizations often just utilize market wRVUs and/or compensation per wRVU rates as a guide. Typically, APP plans allow for more significant guaranteed base salaries. Depending on the methodology used for each, this may limit the impact of any increases in APP compensation due to the changes.
Table 5 below highlights the estimated changes to survey benchmarks. See Column A to find the estimated change in compensation.
Table 5: Estimated Survey Benchmark Changes in Clinical Compensation and wRVUs
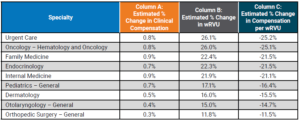
If an organization utilizes data on wRVU productivity targets to determine compensation using the pre-2021 survey data while calculating wRVUs using the 2021 wRVU schedule, this will result in higher payouts as APPs on incentive plans will meet or exceed the benchmarks at a much greater rate.
Similarly, if an organization uses the pre-2021 compensation per wRVU survey benchmarks while using the new 2021 values to calculate APP productivity, clinical compensation will increase as a result of the pre-adjusted compensation per wRVU rates.
These compensation change estimates are based only on the recalculations of the E&M wRVUs. This does not estimate other market factors that also drive compensation change. Additional factors include supply and demand, inflation, cost-of-living, changes in productivity and more. As with wRVUs, these factors can also vary significantly by specialty.
3. How will this impact APP compensation?
This depends on the structure of an organization’s existing APP compensation program and the degree of productivity incentive. It may have less of an impact than changes to physician compensation for a number of reasons:
- As noted previously, just over half (56%) of organizations use market wRVU data to adjust APP compensation.5
- Only 35% of organizations reported wRVUs for all APPs within the organization.5
- 42% are not tracking or reporting APP wRVUs at all.5
- 49% of organizations report having incentive plans for APPs with wRVUs being the most common component.5
Organizations incentivizing APPs based on wRVU productivity and utilizing national benchmarks to determine annual salaries and compensation per wRVU rates need to assess and understand how these changes to the benchmarks will impact APP compensation payout levels.
SullivanCotter reviewed several different compensation methodologies to estimate the impact on survey benchmarks. Considering the E&M code changes and assuming no modifications are made to compensation plan methodologies, we estimate the average clinical compensation for all APPs to increase by approximately 0.5%. This is compared to approximately 6% for physician compensation identified in Part I.
For organizations with APPs whose pay is structured more like physician compensation, it will be critical to understand the impact these changes will have on incentive plans – which is likely to be far greater than the average 0.5% suggested in this study.
4. If organizations utilize compensation per wRVU benchmarks for APPs, what should they expect with regard to the 2021 benchmarks?
For any group implementing the 2021 rate into their APP compensation plans, a fundamental understanding of how market benchmarks will change is important. This is especially true in some of the procedural specialties where APPs code a much higher number of E&M visits (compared to physicians who are more focused on the procedural codes). As a result, APPs will often see marked increases in wRVUs. It is important to monitor the unintentional impact on work effort for both APPs and physicians as clinicians adapt to the new weighting of professional encounters.
OTHER FACTORS TO CONSIDER WHEN ANALYZING COMPENSATION IMPACTS
As organizations continue to evaluate the impact of the 2021 Physician Fee Schedule, there are several additional factors to consider. These include:
- Are physician and APP compensation plans, incentive opportunities, and metrics aligned and will changes to one component impact the other?
- For specialties that include paid shift rates, are there additional incentives based on productivity?
- Does the organization pay physicians and APPs for virtual care visits that tie to E&M values? This could result in higher compensation for virtual care.
- Will the changes in CPT valuation for telemedicine be permanent or be adjusted after the end of the pandemic?
- CMS will also be adding G2212 as an add-on code for every 15 additional minutes of visit time. The assumptions and analysis above do not account for the changes in the distribution of E&M coding or increases in wRVUs due to these new codes.
- A wRVU increase does not automatically equate to an equal revenue reimbursement increase.
- CMS also applies an annual budget factor that caps the overall per wRVU reimbursement to avoid a significant increase in CMS payments. This can significantly increase the total percentage of revenue an organization receives that can be paid to physicians and APPs.
Sources:
1CMS Releases 2021 Physician Fee Schedule Rule. AAPA News Central. December 2, 2020. Accessed at: https://www.aapa.org/news-
central/2020/12/cms-releases-2021-physician-fee-schedule-rule/
2Proposed Policy, Payment and Quality Provisions Changes to the Medicare Physician Fee Schedule for Calendar Year 2021. August 3, 2020. Centers for Medicare and Medicaid Services. Accessed at: https://www.cms.gov/newsroom/fact-sheets/proposed-policy-payment-and-quality-provisions-changes-medicare-physician-fee-schedule-calendar-year-4
3Medicare Telemedicine Health Care Provider Fact Sheet. Centers for Medicare and Medicaid Services Fact Sheet. March 17, 2020. https://www. cms.gov/newsroom/fact-sheets/medicare-telemedicine-health-care-provider-fact-sheet
4SullivanCotter Large Clinic® CPT Benchmark Study
5SullivanCotter 2020 Advanced Practice Provider Compensation and Productivity Survey
6SullivanCotter 2020 Physician Compensation and Productivity Survey
SullivanCotter offers advisory support and technology solutions to help your organization understand and respond to the potential impact of these changes.
To learn more, contact us at 888.739.7039 or info@sullivancotter.com

Q&A | Utilizing Technology to Engage the Clinical Workforce
Aligning clinical workforce compensation strategies with quality and efficiency goals
DOWNLOAD FULL ARTICLE
Health care continues to evolve at a rapid pace as the industry seeks to maintain financial sustainability and transform operations in the midst of post-COVID-19 recovery plans. This includes enhancing the quality of care, managing costs, improving patient access and satisfaction, and increasing physician and staff engagement to help achieve organizational goals. Market pressures are forcing organizations to develop new clinical capabilities as well as adapt their operations to perform more effectively under value-based reimbursement requirements. A key success factor in this evolution is the ability to align quality and efficiency goals with physician and advanced practice provider (APP) compensation strategies.
As pay practices continue to evolve, many organizations are looking to address the following questions:
- How can you ensure your compensation administration and performance management programs are engaging physicians and APPs in support of your cultural and organizational strategy?
- What tools and resources will help to enhance transparency in the reporting of performance to clinicians?
- What are the optimal communication, education and engagement processes to align performance around value-based metrics?
- How do these tools and resources help with recruitment and retention of the clinical workforce?
Compensation and performance management tools require transparency to build trust and reliability while also enhancing the clinical workforce’s ability to understand the process and the results.
Consistent measures, reporting, and expectations are foundational to building trust.
SullivanCotter consultants Kevin Wilson, Dan Iliff and Tom Trachtman recently answered questions on aligning physician and APP workforce performance — helping to uncover emerging trends, technologies and practices among high-performing hospitals, health systems and medical groups.
Why should health care organizations prioritize their compensation and performance programs during this transition?
DAN: Whether your organization is a single specialty independent medical group or one of the largest health systems in the country, success is reliant on the performance of your clinical workforce. As with any employee, in any industry, compensation and work expectations are two important variables. When appropriately designed and aligned, compensation plans play a vital role in helping to motivate this workforce and achieve organizational objectives. These variables are also important in clinical staff satisfaction and retention.
Physicians and APPs often express dissatisfaction when they do not fully understand their compensation plans, lack insight into how they are being measured, or do not have faith in the reporting system. This is becoming more common with the increasing prevalence of value-based pay components. This lack of transparency can leave them feeling disengaged and may contribute to turnover.
KEVIN: Agreed, Dan makes an important point. An effective compensation strategy is critical to engage and align the clinical workforce to achieve targeted performance. The importance of alignment is growing in the
transition to value-based care as organizations integrate more non-productivity metrics into compensation plans to help improve access, quality of care, service and affordability. Historically, physicians and APPs have lacked faith in the accuracy of reported non-productivity metrics. In order to reach desired outcomes and results, the administration, management and reporting process must be comprehensive and transparent enough to truly engage physicians and APPs. Regardless of the size or scope of your operations, a more transparent view into how physicians and APPs are performing and being paid is critical. This requires access to timely, accurate and actionable data in an understandable format. A comprehensive performance management program and process supported by innovative technology and reporting can help to achieve this.
What are some of the common administrative pain points hospitals, health systems and medical groups are experiencing as they try to support the engagement and alignment of a growing population of physicians and APPs within their organizations?
DAN: The way in which organizations measure and report physician and APP performance is often outdated and opaque. With a change in both the number and type of performance metrics being used, all of which help reflect a more balanced approach to performance, compensation programs are becoming increasingly complex and difficult to administer. Physicians and APPs often find the data difficult to understand, hard to verify and lacking in transparency. For these reasons, many organizations are struggling to effectively engage their clinicians in new pay-for-performance models that now include value-based metrics in addition to traditional productivity components.
According to SullivanCotter’s 2020 Physician Compensation and Productivity Survey, the prevalence of value/ quality incentives as a compensation plan component, which rewards performance on measures such as clinical quality, patient experience and access, hovers at or above 50% for all major specialty categories — primary care, medical, surgical and hospital-based. While reimbursement models continue to evolve and organizations are focused on incorporating more complex value-based components into their compensation programs, many organizations lack the internal processes and systems to efficiently track and manage multiple areas of performance. With multiple sources of information, this process can be both tedious and time-consuming, especially given the limited number of personnel assigned to the task.
Today, organizations often track performance relative to these new quality metrics in large and unwieldy offline spreadsheets. Not only do these spreadsheets create problems with version control, but error rates tend to increase as teams manually sift through endless rows of data. With nearly 90% of spreadsheets containing mistakes, this can prove costly as these errors can have a large impact on critical compensation and reporting functions.1 Additionally, there are the added complexities of data capture and validation across an increasing number of physicians, APPs and their associated sub-specialties. This complexity adds to the distrust that physicians and APPs often experience with these types of measures.
TOM: One of the most common issues I’ve seen related to this is delayed and incomplete production figures that lead to inaccurate performance results. Poor reporting makes it difficult for physicians and APPs to both track and trust what is being reported. Additionally, it makes it difficult for leadership to assess progress toward organizational goals. The lack of transparency doesn’t help to instill trust in the data. A large quantity of performance and productivity data must be properly merged, analyzed and validated from disparate systems before physicians, APPs, clinical leaders and managers can obtain and act upon the information they need. These limited reporting capabilities are a burden on the administrative staff responsible for delivering the information and helping to provide actionable insights.
Moreover, many organizations cite a lack of analytical talent available to properly evaluate the data they already have – and the COVID-19 pandemic may further this shortage. A recent report conducted by the Everest Group states that “75% of enterprises believe there will be a talent shortage for key roles in IT, analytics and special skills areas post-COVID-19…new skills gaps will emerge as a result of the structural changes in business occurring in response to the pandemic.”2 As health systems merge, consolidate and increase the number of physicians and APPs within the organization, the amount of data will only become more difficult to manage. Similarly, there must be control mechanisms in place to govern the data and ensure it maintains validity and relevance.
How can organizations develop a trusted performance management program that addresses and aligns a spectrum of needs for all key stakeholders — including leadership, physicians, APPs and administrative staff?
KEVIN: Clinical delivery structures are evolving and there should be a comprehensive process in place to administer, analyze and report on physician and APP performance and compensation across various levels of leadership. The first step is to consider the needs of each group of stakeholders:
Leadership
- Routine and consistent reporting with easy-to-consume information to assess progress towards organizational goals
- Actionable insights into drivers of performance at the organization, group and physician level
- Ability and capacity to focus on performance improvement efforts and coaching
Administration
- Accuracy, speed and reliability of performance and compensation analytics
- Alignment with internal partners
- Capacity and tools for deeper analysis
- Identification and reconciliation of issues
- Efficient utilization of technology to analyze real-time data to provide insight to leadership
Physicians and APPs
- A trusted and reliable source of truth for timely and efficient clinical compensation and performance management
- Easily accessible, current-state, performance results with clear action steps to help drive improvement
- Access to individual, peer and group performance in addition to patient-level detail
- Supporting resources (people, processes, technology) that enable physicians and APPs to make changes that can help improve results
How can technology be used to enable and provide greater value for your organization?
KEVIN: Alignment is important to building a trusted and reliable compensation and performance management program that engages clinicians. Along with the clinical workforce, leadership and administrators also require a clear understanding of expectations, progress and results. Without the ability to provide these insights in a timely fashion, these stakeholders are unable to effectively understand key drivers of performance and assess progress against goals. Building trust through transparency is key, and it leads to higher engagement, enhanced collaboration and clearer lines of communication. The expected outcomes should be clinically significant as well as easy to understand and measure.
With the addition of new quality incentives, a greater degree of “at-risk” compensation has become commonplace for physicians and APPs. Whether this “at-risk” compensation is based on panel size, access, clinical quality metrics or patient satisfaction, it is becoming common to have a component of compensation tied to performance. For primary care physicians, median quality incentive payments comprised 7.4% of total cash compensation in 2020.3 For medical and surgical specialists, this percentage is lower at 5.6% — although we expect to see growth as organizations work to further develop and refine these programs to ensure they have credible measurement and reporting systems in place before moving forward.3
DAN: I agree. High-performing organizations are constantly evolving and must be supported with tools and technology that can evolve with them. Technology is a platform for change at a time when change is inevitable. By providing access to clear and concise performance data all in one place, technology can serve as a single source of truth that combines administration, reporting and analytics capabilities into one system. The right technology can turn data into actionable insights, communicate goal definitions, benchmark performance, develop KPI reports and automate a number of data-related functions — all of which help to build trust and instill greater confidence in the data and reported results. Greater transparency can also play a critical role in improving engagement and aligning physicians and APPs with the mission and vision of the organization in which they work. Moreover, technology will enable physician leaders to better focus their efforts where it really counts — actively managing and coaching the clinical workforce.
What are the most important things to consider when assessing how technology can better support your performance management and compliance program?
DAN: New tools and technologies can allow your organization to streamline an increasingly complex communication, compensation and performance process by resolving inefficiencies in the way that data is collected, analyzed and reported. When assessing how technology can support these changes in relation to physician and APP compensation, performance and compliance, there are four key areas of functionality to consider:
- Performance management
- Productivity insights
- Compensation administration
- Contract lifecycle management
The first key area of functionality is performance management. Organizations must have a comprehensive system in place to communicate, measure, and drive performance while delivering actionable insights.
Once the key drivers of performance are identified, this understanding can then be translated into action and ultimately lead to improved results. Organizations must also provide the tools and support to help physicians and APPs improve performance while being mindful of not adding undue complexity or setting unrealistic expectations.
TOM: For example, imagine a scenario where physicians and APPs are compensated based on patient access. There has to be visibility into their schedules, time to next appointment, patient wait times and other components related to this metric. Without this visibility, there are limited fact-based insights to be gained.
The ability to properly assess performance and related compensation against defined targets and metrics is important to identifying best practices and improvement opportunities. Extensive built-in audit and reconciliation tools that help to ensure data integrity and improve the speed and accuracy of administration efforts exist in the marketplace today and can provide customized access and views tailored to the unique needs of leadership, physicians and administrators.
DAN: Another key piece of functionality relates to productivity insights. As a result of constantly changing wRVU schedules, evolving compensation models, billing reconciliation and other changes, physician and APP compensation and performance administration is multifaceted. Technology that automates the revenue and productivity data collection and analysis component of this process will yield immediate time savings for physicians, APPs and administrators. Additionally, it will allow physicians and APPs to be able to understand the reported data and have faith in the process. A system that allows you to review billing information in a central repository and assists with complex RVU functions such as sharing arrangements, scale conversion, modifier adjustments and non-billable credit information will greatly increase the speed and accuracy of a multitude of productivity assessments. The consistency and transparency of the process will also build trust with the physicians and APPs and ultimately creates time and credibility for your team to dedicate to more strategic initiatives.
The third area of focus is on compensation administration — or the communication of results. This is where a compensation program comes full circle through customized dashboards and reports that are tailored to
individual providers and administrators. By integrating data on compensation earned from all sources for all physicians and APPs in a central repository, technology will help streamline the reporting process and get the right data into the right hands at the right time. The timely delivery of accurate compensation results to the clinician strengthens trust and improves engagement. Whether you are an administrator facilitating monthly settlements or a physician or APP monitoring performance on specific metrics, these dashboards are the key to success and will help to track progress against organization-wide goals.
Lastly, ensuring that physician employment agreements align with system-wide compensation terms and payments remains a challenge for health care organizations nationwide. Integrating an automated contract
lifecycle management solution that will provide your organization with an accurate and comprehensive view of clinical employment contracts and obligations across the organization in real-time helps to support compliance and ease of administration while also providing transparency and greater access to the clinicians.
The ideal technology solution brings all four of these components together to equip your organization with a more transparent, accurate and timely view of individual, group and system performance. physicians and leadership with the information they need to reliably inform performance and drive desired outcomes. A strong technology platform can act as the cornerstone to help facilitate change. Similar to how EHRs revolutionized care delivery, a mature compensation and performance infrastructure can help to revolutionize how performance is measured and communicated.
What are the next steps for organizations considering the implementation of a new compensation and performance management system?
TOM: Compensation and performance programs are constantly evolving in today’s dynamic health care marketplace and organizations will continue to adapt as operations grow more complex. They require scalable solutions to help streamline the compensation administration process while also providing physicians and leadership with the information they need to reliably inform performance and drive desired outcomes. A strong technology platform can act as the cornerstone to help facilitate change. Similar to how EHRs revolutionized care delivery, a mature compensation and performance infrastructure can help to revolutionize how performance is measured and communicated.
DAN: The specific actions your team should consider include:
- Identify key stakeholders through a holistic analysis of your compensation and performance program
- Aggregate and organize pain points across stakeholders to identify their root cause
- Acknowledge gaps in technology in order to meet the needs of all stakeholders
- Determine the functionality required to assess, analyze and report on physician and APP performance
- Evaluate the technology options available and how respective platforms can help advance your organization’s performance management programs
SullivanCotter’s Provider Performance Management Technology™
Provider Performance Management Technology™ (PPMT™) is an industry-first, cloud-based solution that enables clinician engagement through transparent performance-based compensation administration, contract management, and reporting and analytical capabilities.
Utilizing best-in-class technology and decades of physician compensation and health care expertise, PPMT™ is designed to support organizations in the transition from volume to value. PPMT™ is offered as part of a comprehensive portfolio of advisory, information and technology services to address client needs.
As a trusted partner in compensation and performance management, reach out to SullivanCotter to learn more about our comprehensive Provider Performance Management Technology™ and our suite of clinical workforce advisory services.
Sources:
- 1Olshan, Jeremy. (2013). 88% of Spreadsheets Have Errors. MarketWatch. Retrieved from https://www.marketwatch.com/story/88-of-spreadsheets-have-errors-2013-04-17
- 2The Everest Group. (2020). 75% of Enterprises Bracing for Widening IT & Analytics Talent Shortage Despite Recession. Retrieved from https://www.everestgrp.
com/2020-08-75-of-enterprises-bracing-for-widening-it-analytics-talent-shortage-despite-recession-press-release-.htmlhttps://hitconsultant.net/2019/10/16/health-it-staffing-shortage-crisis/#.YGtEaehKiUk - 3SullivanCotter 2020 Physician Compensation and Productivity Survey Report

Modern Healthcare | Physician Compensation Plateaus During Pandemic
Protecting physician compensation during the COVID-19 pandemic
While many health care organizations continue to undergo post-pandemic financial and operational recovery planning, maintaining the broader workforce remains a top priority. Although physician compensation may have been expected to drop over the course of the last year due to a major decline in patient volumes and the cancellation of elective procedures during the shutdown, the majority of hospitals and health systems implemented to protect physician compensation to some degree.
Featured in a July 2021 edition of Modern Healthcare, SullivanCotter helps to evaluate how compensation evolved during the COVID-19 pandemic, which pay actions organizations implemented in response, and how to move forward with evaluating pay programs for 2021 and beyond. Organizations will now need reassess physician pay models in light of recent events to help maintain operations and support future sustainability while paying close attention to newly-released 2021 benchmarks and effectively adjusting for months most affected by the pandemic.