PRESS RELEASE | 2023 Physician Compensation and Productivity Survey
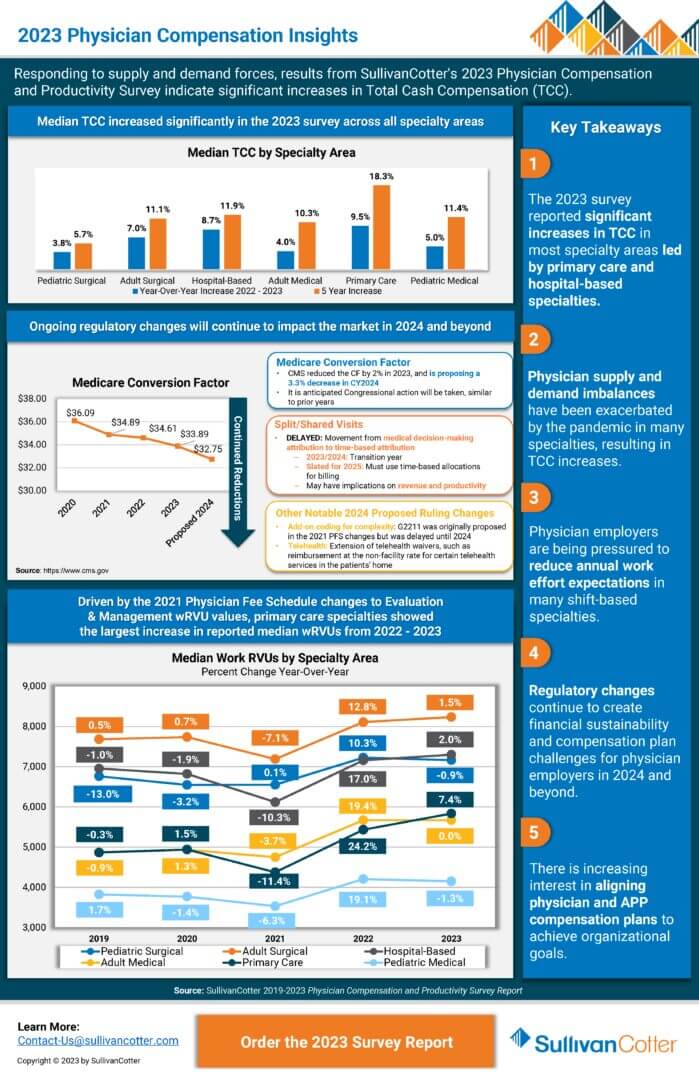
Responding to supply and demand forces, SullivanCotter’s 2023 Physician Compensation and Productivity Survey results indicate significant increases in Total Cash Compensation (TCC).
—
CHICAGO–(BUSINESS WIRE)–SullivanCotter, the nation’s leading independent consulting firm in the assessment and development of total rewards programs, workforce solutions, and data products for health care and not-for-profits, has released its 2023 Physician Compensation and Productivity Survey report.
The report reveals the most significant median total cash compensation (TCC) increases for Primary Care (9.5%) and Hospital-Based (8.7%) specialties, and finds increases across most specialty areas in 2023. With the anticipated shortage of primary care physicians (survey respondents reported the highest percentage turnover in primary care at 8.4%) projected to increase, healthcare organization leaders will confront sustained upward pressure on compensation for these roles moving forward.
SullivanCotter’s data represent the largest and most comprehensive physician compensation resource for health systems and hospitals, with findings reported on more than 306,765 physicians, APPs and PhDs.
Numerous market forces continue to influence health systems’ strategic and operational focus for 2023, many of which are directly impacting the provider workforce. Clinical workforce demand continues to outpace supply, which has been exacerbated by increased turnover and physician burnout and has created upward pressure on compensation. Regulatory changes, including a proposed reduction in the Medicare conversion factor for 2024 and changes to split/shared billing for 2025, continue to create financial sustainability and compensation plan challenges. Finally, in part due to physician supply and demand imbalances, more health care organizations are working to better align physician and advanced practice provider (APP) care delivery models and eliminate potential compensation barriers to team-based care delivery.
“For primary care specialties, the Physician Fee Schedule transition is still impacting physician compensation as compared to last year’s survey results. As for the hospital-based specialties, many of the physician specialties with the most significant reported TCC increases in the 2023 survey were on the front lines in the pandemic, including hospitalists, intensivists, and emergency medicine,” said Dave Hesselink, Managing Principal, SullivanCotter.
The survey also reported that primary care had the largest increase (7.4%) in reported median wRVU productivity from 2022 to 2023. “As primary care patient volumes have rebounded post-pandemic and wRVU values have shifted due to the Physician Fee Schedule changes, this jump in reported wRVU productivity is expected,” Hesselink added. Across all specialty categories, TCC per wRVU rates saw moderate increases over 2022 survey levels with a spike in pediatric surgical rates (8.8%).
The 2023 report showed that base salary and wRVU components continue to be prevalent in primary care, medical, and surgical specialty compensation plans. About 70% of survey participants report using those plan components in their compensation plans, which is consistent with the 2022 survey results. Value-based or quality incentives are used by about 50% of organizations and payments range from 6-8% of TCC for specialists, and 8-9% for primary care, reflecting a slight increase over 2022 survey results which reported ranges of 5-6% and 6-8%, respectively.
Additionally, the prevalence of team-based incentive compensation continued to trend. Similar to the 2022 survey results, approximately one-quarter of organizations (23%) indicated they used team-based incentives in their compensation plans. Of those with team-based incentive compensation, the incentive accounted for 11% of physician TCC, which has been trending upward since 2020 when it was reported at approximately 8%. Just over half of organizations (52%) defined a “team” as including both physicians and advanced practice providers (APPs).
“Increased use of team-based incentive compensation correlates with the growing focus our clients have on population health, care coordination, and positioning APPs to practice at top of license. Now, more than ever, we see organizations evaluating how APPs can most effectively partner with physicians and care teams to deliver high-quality patient care,” said Mark Ryberg, Managing Director and SullivanCotter’s Physician Workforce Practice Leader.
About SullivanCotter
SullivanCotter partners with health care and other not-for-profit organizations to understand what drives performance and improves outcomes through the development and implementation of integrated workforce strategies. Using our time-tested methodologies and industry-leading research and information, we provide data-driven insights, expertise, and data products to help organizations align business strategy and performance objectives – enabling our clients to deliver on their mission, vision, and values.
For more information on SullivanCotter’s surveys, please visit our website at www.sullivancotter.com, or contact us via email or by phone at 888.739.7039.
Note to media: Additional data and interviews are available on request.
INFOGRAPHIC | 2023 Physician Compensation Insights
According to SullivanCotter’s 2023 Physician Compensation and Productivity Survey report, physician supply and demand imbalances have resulted in total cash compensation increases as well as increased pressure on physician employers to reduce annual work effort expectations in many shift-based specialties. Gain additional insights and view key takeaways.
PRESS RELEASE | 2023 Executive Compensation Survey
Health care organizations and boards should continue to balance competitive talent markets with an uncertain performance environment.
—
October 12, 2023 – CHICAGO – SullivanCotter, the nation’s leading independent consulting firm in the assessment and development of total rewards programs, workforce solutions and data products for health care and not-for-profits, has released its 2023 Health Care Management and Executive Compensation Survey report.
Base Salaries
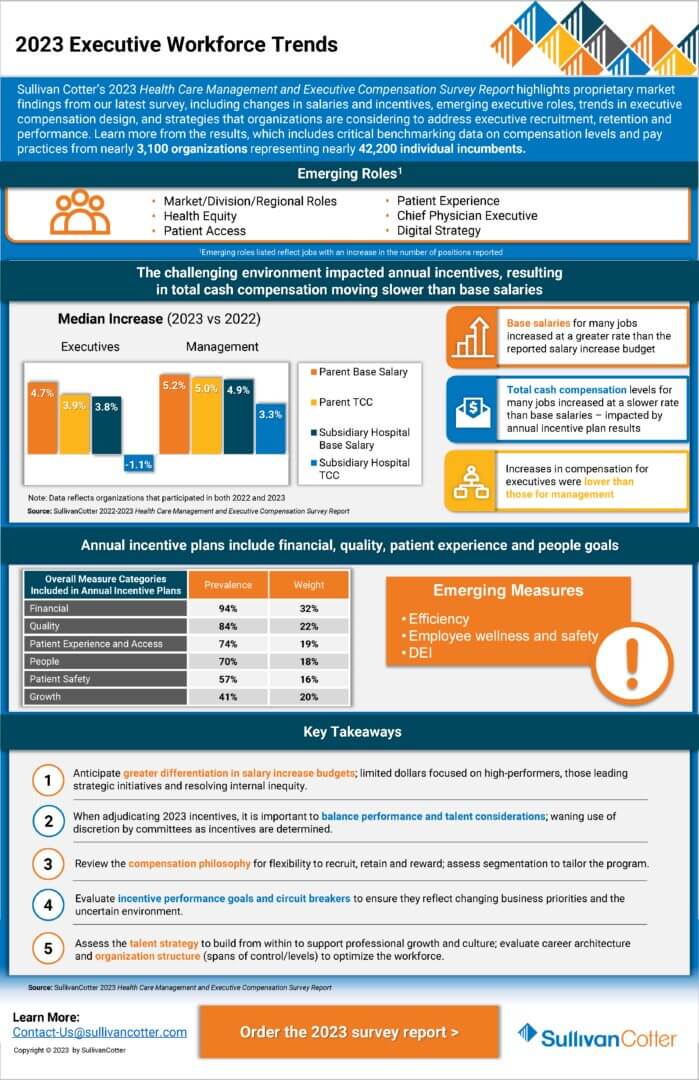
The report details year-over-year changes in median base salaries for healthcare leaders (i.e., salary, merit, across-the-board, market adjustments). This year’s 4.1% increase for all healthcare executives is slightly lower than the 2022 increase (4.3%). The findings represent the largest and most comprehensive resource for hospitals and health systems, surveying more than 3,000 organizations representing roughly 42,160 individual incumbents.
“Health systems have been under pressure to ensure that leaders have the skills needed to address a complex operating environment, including workforce shortages, increased labor, supplies and borrowing costs, and ongoing revenue shortfalls due to service mix changes, access limitations and low volumes,” said Bruce Greenblatt, Executive Workforce Practice Leader, SullivanCotter.
As a result, base salary levels are trending up, as health systems seek to attract, retain and motivate the right leaders in a competitive market. And compensation committees are working to balance the financial, operational, and talent risks as they oversee the executive compensation program.
Incentive Awards
While 2023 salaries increased, incentive awards moderated. Incentive plan payouts were lower for 2022 performance compared to 2021, reflecting a more challenging operating environment and sustained financial headwinds. As a result, the year-over-year increase in 2023 total cash compensation (TCC, equal to base salaries plus annual incentive awards) was lower than the increase in base salaries. While health system executives’ base salaries increased by 4.8%, median TCC levels increased by 3.5%. Median annual incentive payouts for 2022 were moderately below target, compared to payouts that were moderately above target last year. The data showed no significant shifts in annual incentive plan prevalence or award opportunity levels.
“The year-over-year change in TCC was more modest due to a dip in incentive plan payouts in 2022, which reflected more pressures and variability in performance,” said Tom Pavlik, Managing Principal, SullivanCotter. “Incentive plans are working as designed, given the challenges in meeting performance goals.”
Differentiation in Salary Adjustments for Select Roles
Given the increasing complexity of health systems and the focus on integration, health system executive salary increases (4.8% at median) outpaced subsidiary hospital executive salary increases (3.9% at median), continuing a trend observed over the past several years.
Health system positions that noted higher increases in pay (roles with median base salary increases of 5.0% or higher) tended to be those focusing on strategy/planning, technology, financial sustainability and risk, integration, and workforce strategy:
- Top Leadership Roles: Chief Executive Officer, Chief Operating Officer, Chief Financial Officer
- Technology Roles: Chief Information Officer, Top Information Security Executive
- Business/Operating Roles: Top Planning Executive, Top Risk Management Executive, Top Internal Audit Executive
- Workforce Leadership Roles: Chief Human Resources Officer, Diversity, Equity, and Inclusion Officer
Planning for 2024 and Beyond
Health care organizations and their boards should ensure that executive compensation programs and governance are able to adapt to today’s challenging environment. As it relates to compensation and talent strategy, organizations should consider the following:
- Anticipate base salary increase budgets for FY2024 that include both core merit increases (estimated to be 3.0% at median) and market adjustments to retain key contributors and address pay equity issues.
- Focus incentive plan measures and goals on key operating and strategic priorities, including quality of care, efficiency, growth, access, and employee wellness/engagement.
- Differentiate rewards so limited dollars are directed to address retention/recruitment needs and reward high performers critical to the organization’s short and long-term leadership plans; ensure that the compensation philosophy allows for flexibility to differentiate rewards and programs.
- Conduct a risk assessment to determine where there may be potential retention concerns for critical roles; develop an intervention plan to mitigate risks, considering compensation, professional development, and other tactics.
- Focus on internal leadership development and talent-building to help retain and grow the current leadership team – such an approach reinforces the organization’s desired culture and may potentially reduce costs related to external recruitment.
- Regularly review and refine succession plans; memorialize professional development plans; ensure a strong talent pipeline; determine gaps or emerging skills where external hires may be necessary.
- Review the leadership organization structure, to assess if the executive headcount, distribution, and spans of control are optimal; consider if executive leveling criteria should be evaluated to support integration and talent strategy.
- Ensure adequate flexibility to support recruitment, retention, and performance, including using a range of peer groups, tailored competitive positioning based on criticality and performance, and individualized compensation arrangements (including tailored incentives and multi-year retention awards for select individuals).
About SullivanCotter
SullivanCotter partners with health care and other not-for-profit organizations to understand what drives performance and improve outcomes through the development and implementation of integrated workforce strategies. Using our time-tested methodologies and industry-leading research and information, we provide data-driven insights, expertise, and data products to help organizations align business strategy and performance objectives – enabling our clients to deliver on their mission, vision, and values.
For more information on SullivanCotter’s surveys, please visit our website at www.sullivancotter.com or contact us via email or by phone at 888.739.7039.
Note to media: Additional data and interviews are available on request.
FOR IMMEDIATE RELEASE
Contact: Becky Lorentz, SullivanCotter
beckylorentz@sullivancotter.com
314.414.3719
Amy Fisher, Padilla
amy.fisher@padillaco.com
612.805.5707
INFOGRAPHIC | 2023 Executive Workforce Trends
Sullivan Cotter’s 2023 Health Care Management and Executive Compensation Survey Report highlights proprietary market findings from our latest survey, including changes in salaries and incentives, emerging executive roles, trends in executive compensation design, and strategies that organizations are considering to address executive recruitment, retention and performance. Learn more from the results, which include critical benchmarking data on compensation levels and pay practices from nearly 3,100 organizations representing nearly 42,200 individual incumbents.
The 2023 survey report is now available for purchase.
Bridging the Union vs. Non-Union Compensation Gap
Short and Long-term Strategies to Attract and Retain Clinical Talent
Organizations increasingly recognize the need to pay non-union nurses competitively to compete against union members and the broader market. Although this is critical to bridging the gap, flexibility and balance are also important considerations in delivering innovative solutions that meet workforce needs.
In our recent article, “The Presence and Impact of Labor Unions among Health Care Workers,” Cathy Loose, Managing Principal and Employee Workforce Practice Leader at SullivanCotter, offers some short and long-term approaches to creating a competitive rewards program to attract and retain clinical talent.
Fill out the form below to download the full article.
PRESS RELEASE | SullivanCotter Co-Sourcing Services Help Health Care Providers Address Labor Shortage, Add Critical Skills and Optimize HR Resources
September 14, 2023 – MINNEAPOLIS – SullivanCotter, the nation’s leading independent consulting firm in the assessment and development of total rewards programs, workforce solutions, and data products for health care and not-for-profits, has announced its new co-sourcing services, designed to address the health care labor shortage and maintain critical skills needed to keep providers running at peak performance.
This offering allows SullivanCotter clients to access the expert resources of SullivanCotter as an extended version of their internal teams without the associated costs of insourcing. Unlike traditional outsourcing, co-sourcing combines the skills of both internal and external professionals, giving teams external resources that build on and enhance existing internal capabilities.
“Co-sourcing services allow organizations to access expertise as needed in areas we’ve consulted in every day. Our highly flexible services can be customized to meet each client’s unique needs, maximizing the value of their investment,” said Ted Chien, President and CEO of SullivanCotter. “Our goal is to deliver efficient and sustainable solutions that enable our clients to reach their highest potential.”
Health systems nationwide struggle to meet staffing requirements and establish a sustainable pipeline of future talent. Persistently high turnover rates, escalating burnout levels, and an overwhelming demand for patient care that surpasses the available supply are all factors.
“These ongoing challenges impose a substantial burden on HR teams but also open the door to a flexible co-sourcing approach. A lack of proper staffing can result in a lack of focus on critical operational needs, so the importance of finding effective solutions and ensuring consistency and quality in the service delivery cannot be understated,” emphasized Cathy Loose, Practice Leader of Employee Workforce Solutions at SullivanCotter.
Co-sourcing/interim services offered by SullivanCotter include:
Compensation Planning: Review salary structure and model costs, identify areas for improvement and recommend compensation adjustments.
Survey Operations: Facilitate annual benchmarking by managing employee survey submissions, mapping client jobs to appropriate survey matches, auditing/peer reviewing facts, maintaining market-standard compliance and more.
Portfolio Management: Track and administer ongoing changes to survey job profiles, coordinate with survey vendors to ensure successful implementation, and effectively manage multiple survey platforms on the client’s behalf.
Market Analysis: Conduct competitive analysis and compare organizational practices to market benchmarks – including access to SullivanCotter’s proprietary Benchmarks360™ workforce compensation and performance insights platform.
Market Insights: Provide strategic insight on market trends, including annual pay structure movement and merit adjustments.
Job Descriptions: Support documentation needs associated with creating new roles or revisions to existing roles, aiming to market price and evaluate roles upon completion.
Interim Support: Provide strategic support via a dedicated SullivanCotter Consultant to deliver ad-hoc advisory services, train new hires, and provide various operational and tactical compensation services.
SullivanCotter offers additional specialized services tailored to meet client needs through co-sourcing, including essential initiatives such as Pay Equity and developing and maintaining governance structures.
For more information about SullivanCotter co-sourcing, please visit www.sullivancotter.com, or contact us via email or phone at 888.739.7039.
About SullivanCotter
SullivanCotter partners with healthcare and other not-for-profit organizations to understand what drives performance and improve outcomes through the development and implementation of integrated workforce strategies. Using our time-tested methodologies and industry-leading research and information, we provide data-driven insights, expertise, and data products to help organizations align business strategy and performance objectives – enabling our clients to deliver on their mission, vision and values.
Modern Healthcare | 2023 Annual Physician Compensation Article
SullivanCotter featured in Modern Healthcare’s annual physician compensation issue
The latest trends in physician compensation
Physician compensation is on the rise as provider organizations try to attract more doctors in a tight labor environment. The industry is still responding to post-COVID-19 pandemic market dynamics, according to companies that responded to Modern Healthcare’s 2023 Physician Compensation Survey, which analyzes data from nine staffing and consulting firms. As patients return for deferred procedures, burned-out doctors are taking a step back from work and students are rethinking career options, creating supply-demand mismatches.
To recruit more physicians, providers are turning to higher base salaries, in addition to sweetening the deal with signing bonuses or educational opportunities. Productivity remains the largest factor in calculating total compensation, but employers are also incorporating quality metrics, recruiting and consulting.
Featuring data and insights from both SullivanCotter’s 2023 Physician Compensation and Productivity Survey and 2023 Medical Group Compensation and Productivity Survey, Modern Healthcare discusses five trends that emerged from this year’s Physician Compensation Survey.
Looking for additional data and benchmarks?
SullivanCotter recently released its annual Physician Compensation and Productivity Survey Report. For more than 30 years, this survey has been and continues to be the largest and most comprehensive physician compensation survey published. With data reported on over 306,765 physicians, APPs and PhDs, this survey continues to lead the market in all areas – sample sizes, contemporary and emerging pay practices and the number of specialties and position levels surveyed.
Fill out the form below to download full article.
INFOGRAPHIC | Workforce Size
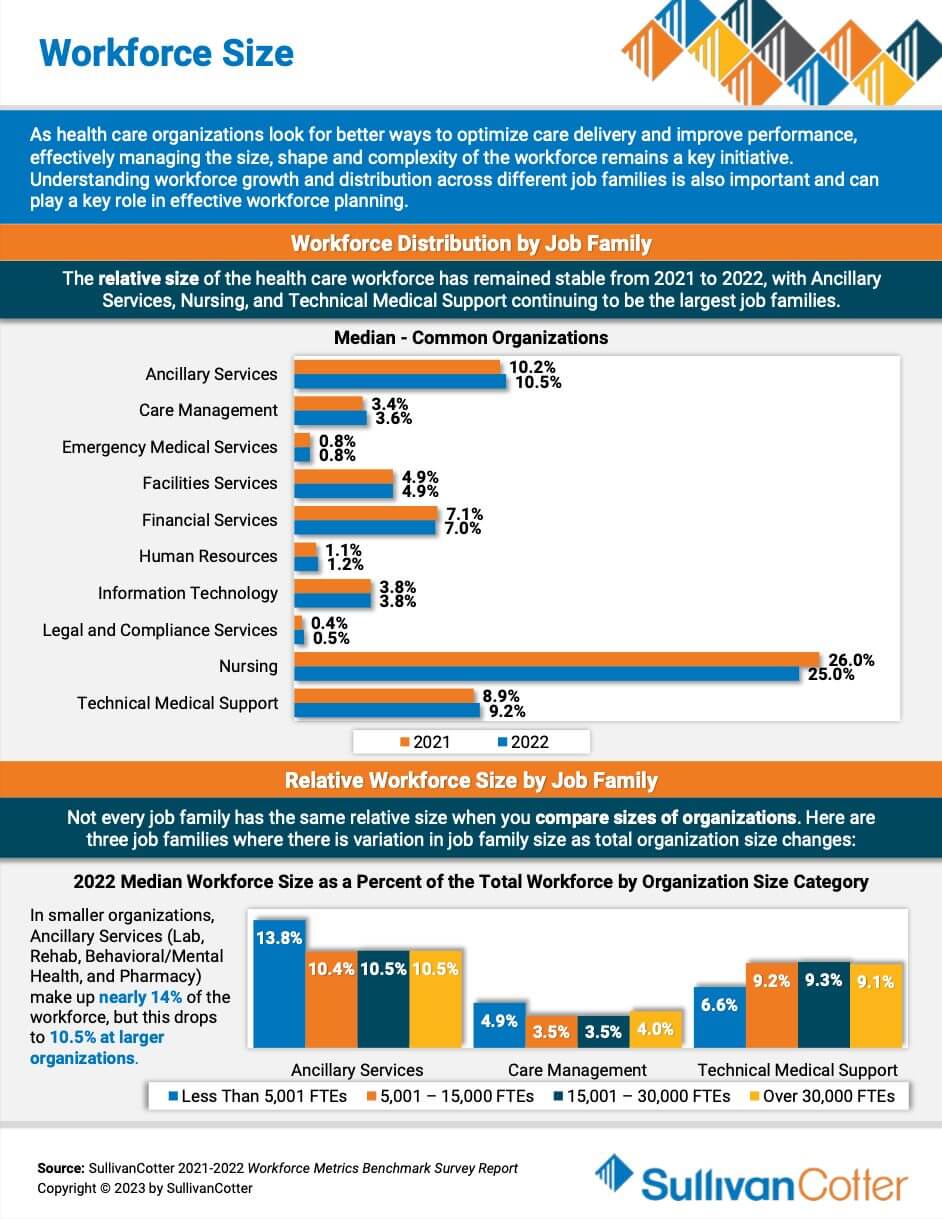
As healthcare organizations look for better ways to optimize care delivery and improve performance, effectively managing the size, shape and complexity of the workforce remains a key initiative. Understanding workforce growth and distribution across different job families is also important and can play a key role in effective workforce planning. Featuring data from SullivanCotter’s Workforce Metrics Benchmark Survey Report, this infographic features insights on workforce size to help your organization navigate healthcare workforce staffing challenges.
INFOGRAPHIC | Workforce Demographics
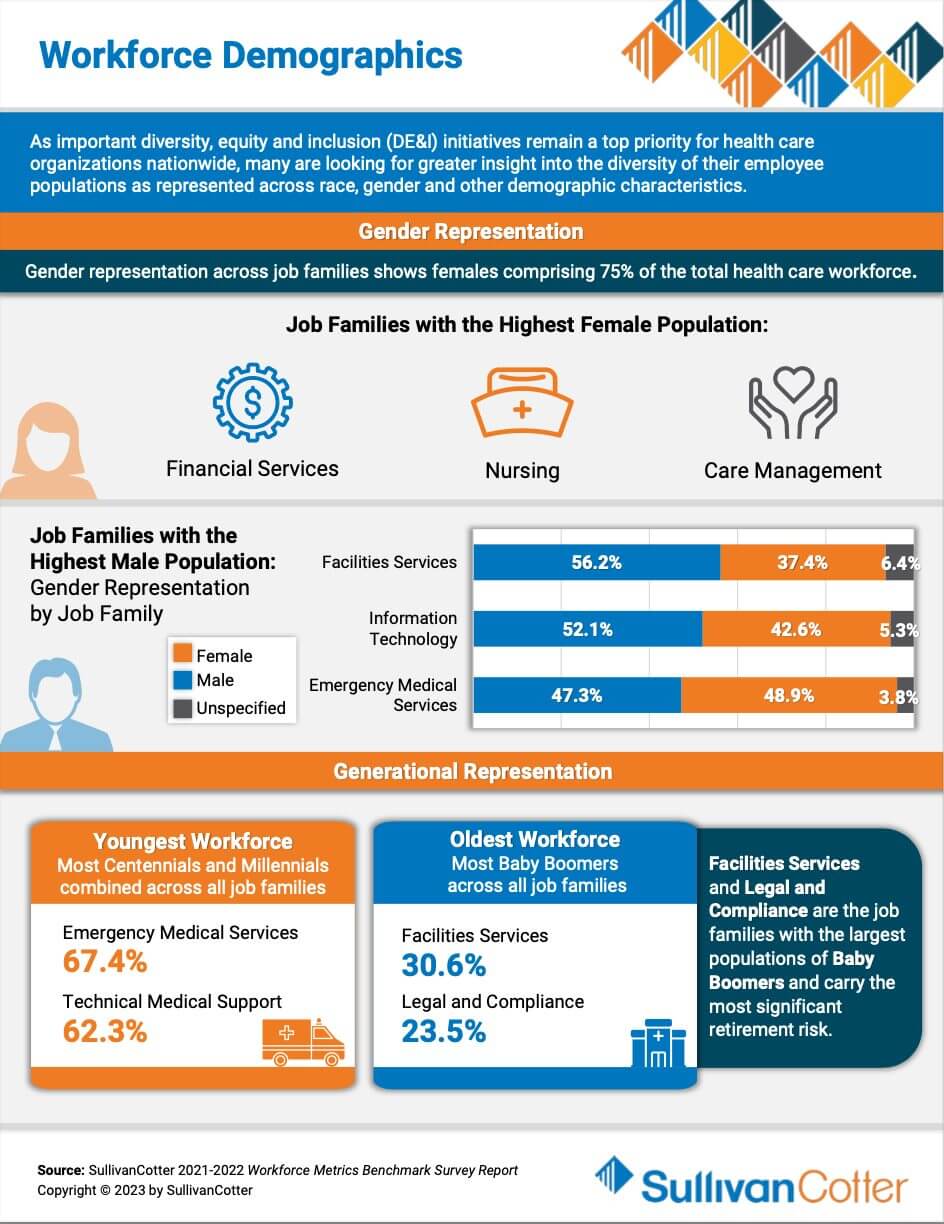
As important diversity, equity and inclusion (DE&I) initiatives remain a top priority for healthcare organizations nationwide, many are looking for greater insight into the diversity of their employee populations as represented across race, gender and other demographic characteristics. Featuring data from SullivanCotter’s Workforce Metrics Benchmark Survey Report, this infographic features demographic insights to help your organization navigate healthcare workforce staffing challenges.
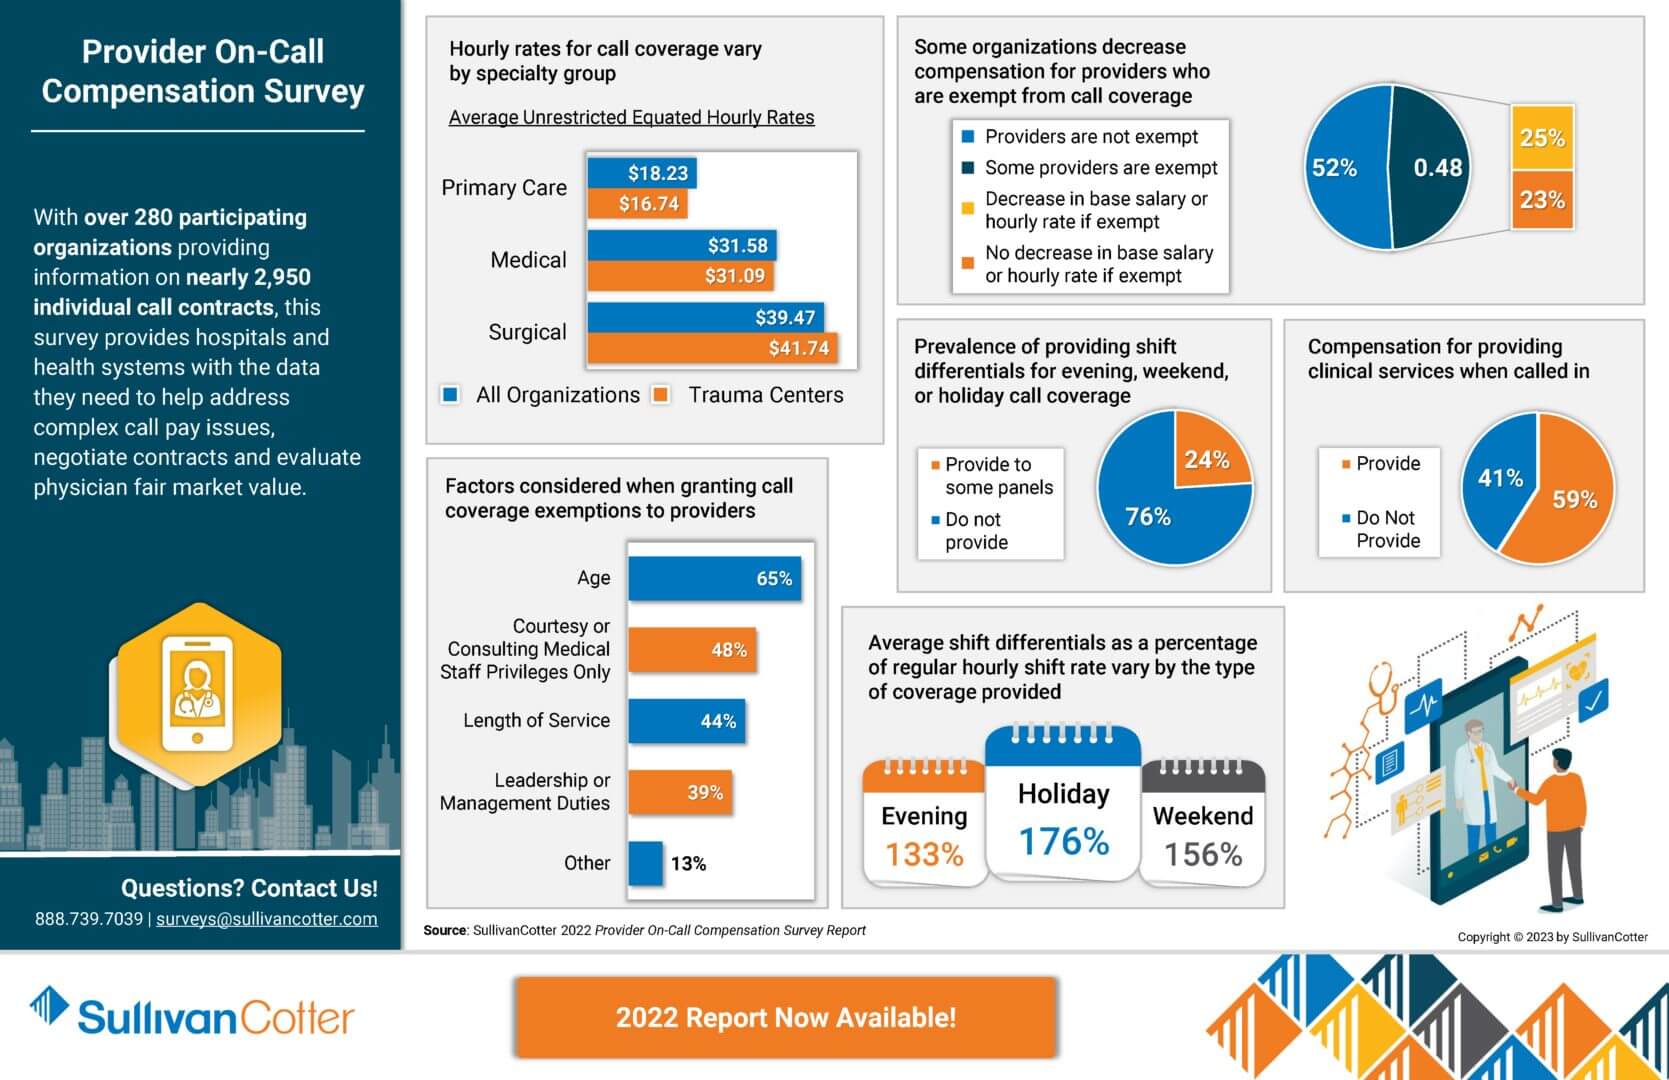
INFOGRAPHIC | 2022 Physician and APP On-Call Compensation Survey
As clinical care settings and practices continue to change in a rapidly evolving health care environment, many organizations are expanding or evaluating their provider on-call programs. Designing effective arrangements to support this demand is critical and starts with gaining access to the right data.
With over 280 participating organizations providing information on nearly 2,950 individual call contracts, the 2022 Provider On-Call Compensation Survey provides hospitals and health systems with the data they need to help address complex call pay issues, negotiate contracts and evaluate physician fair market value.
View highlights from the 2022 results to learn more!
Looking to again access to the latest benchmarks? The 2024 survey is now open for participation!
VIEW INFOGRAPHIC
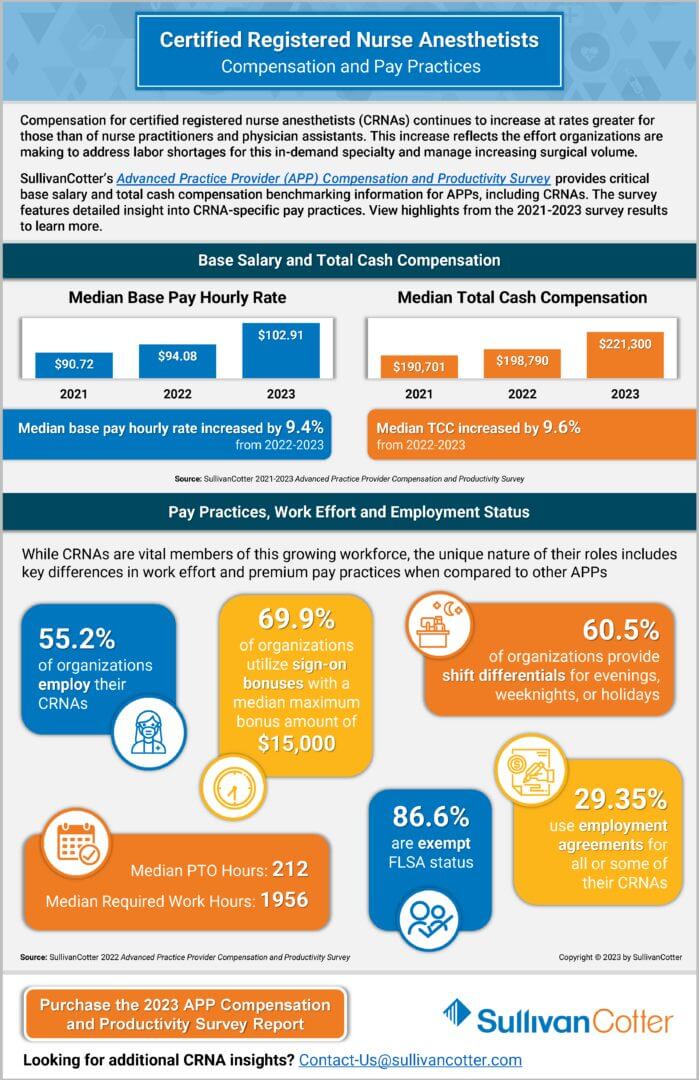
INFOGRAPHIC | 2023 CRNA Compensation and Pay Practices
Compensation for certified registered nurse anesthetists (CRNAs) continues to increase at rates greater for those than of nurse practitioners and physician assistants. This increase reflects the effort organizations are making to address labor shortages for this in-demand specialty and manage increasing surgical volume.
SullivanCotter’s Advanced Practice Provider (APP) Compensation and Productivity Survey provides critical base salary and total cash compensation benchmarking information for APPs, including CRNAs. The survey features detailed insight into CRNA-specific pay practices. View highlights from the 2021-2023 survey results to learn more.
VIEW INFOGRAPHIC
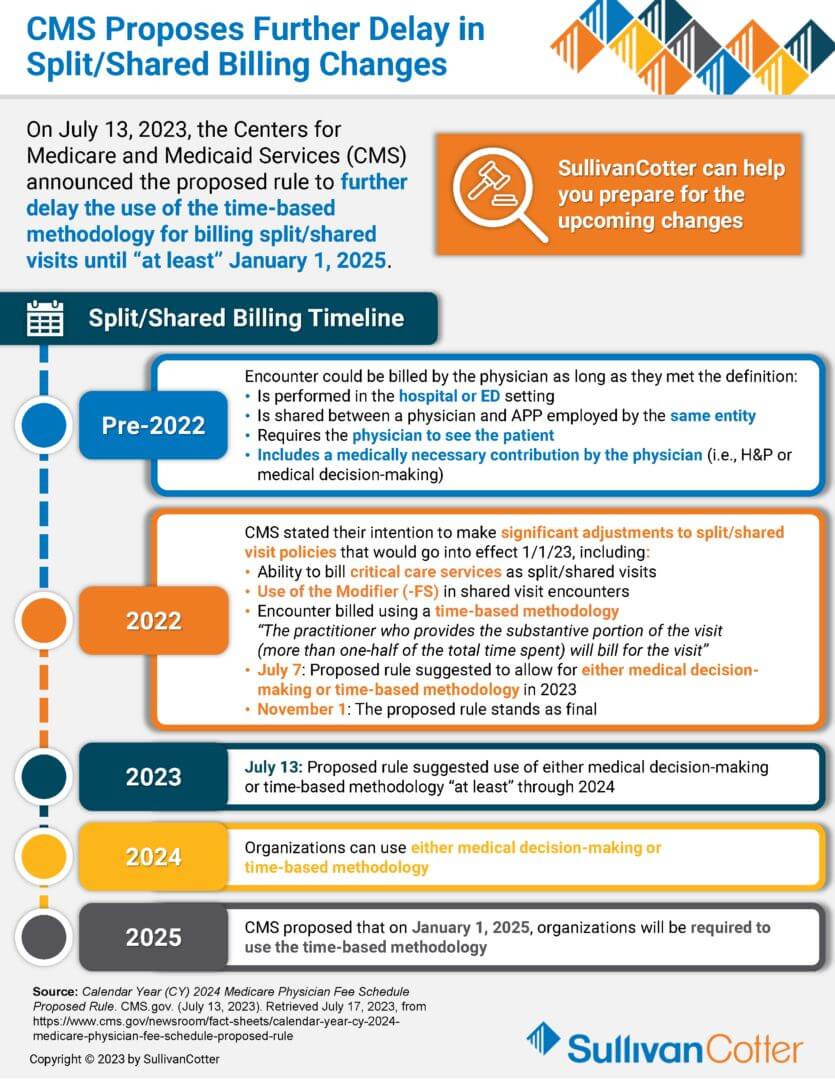
INFOGRAPHIC | CMS Proposes Further Delay in Split/Shared Billing Changes
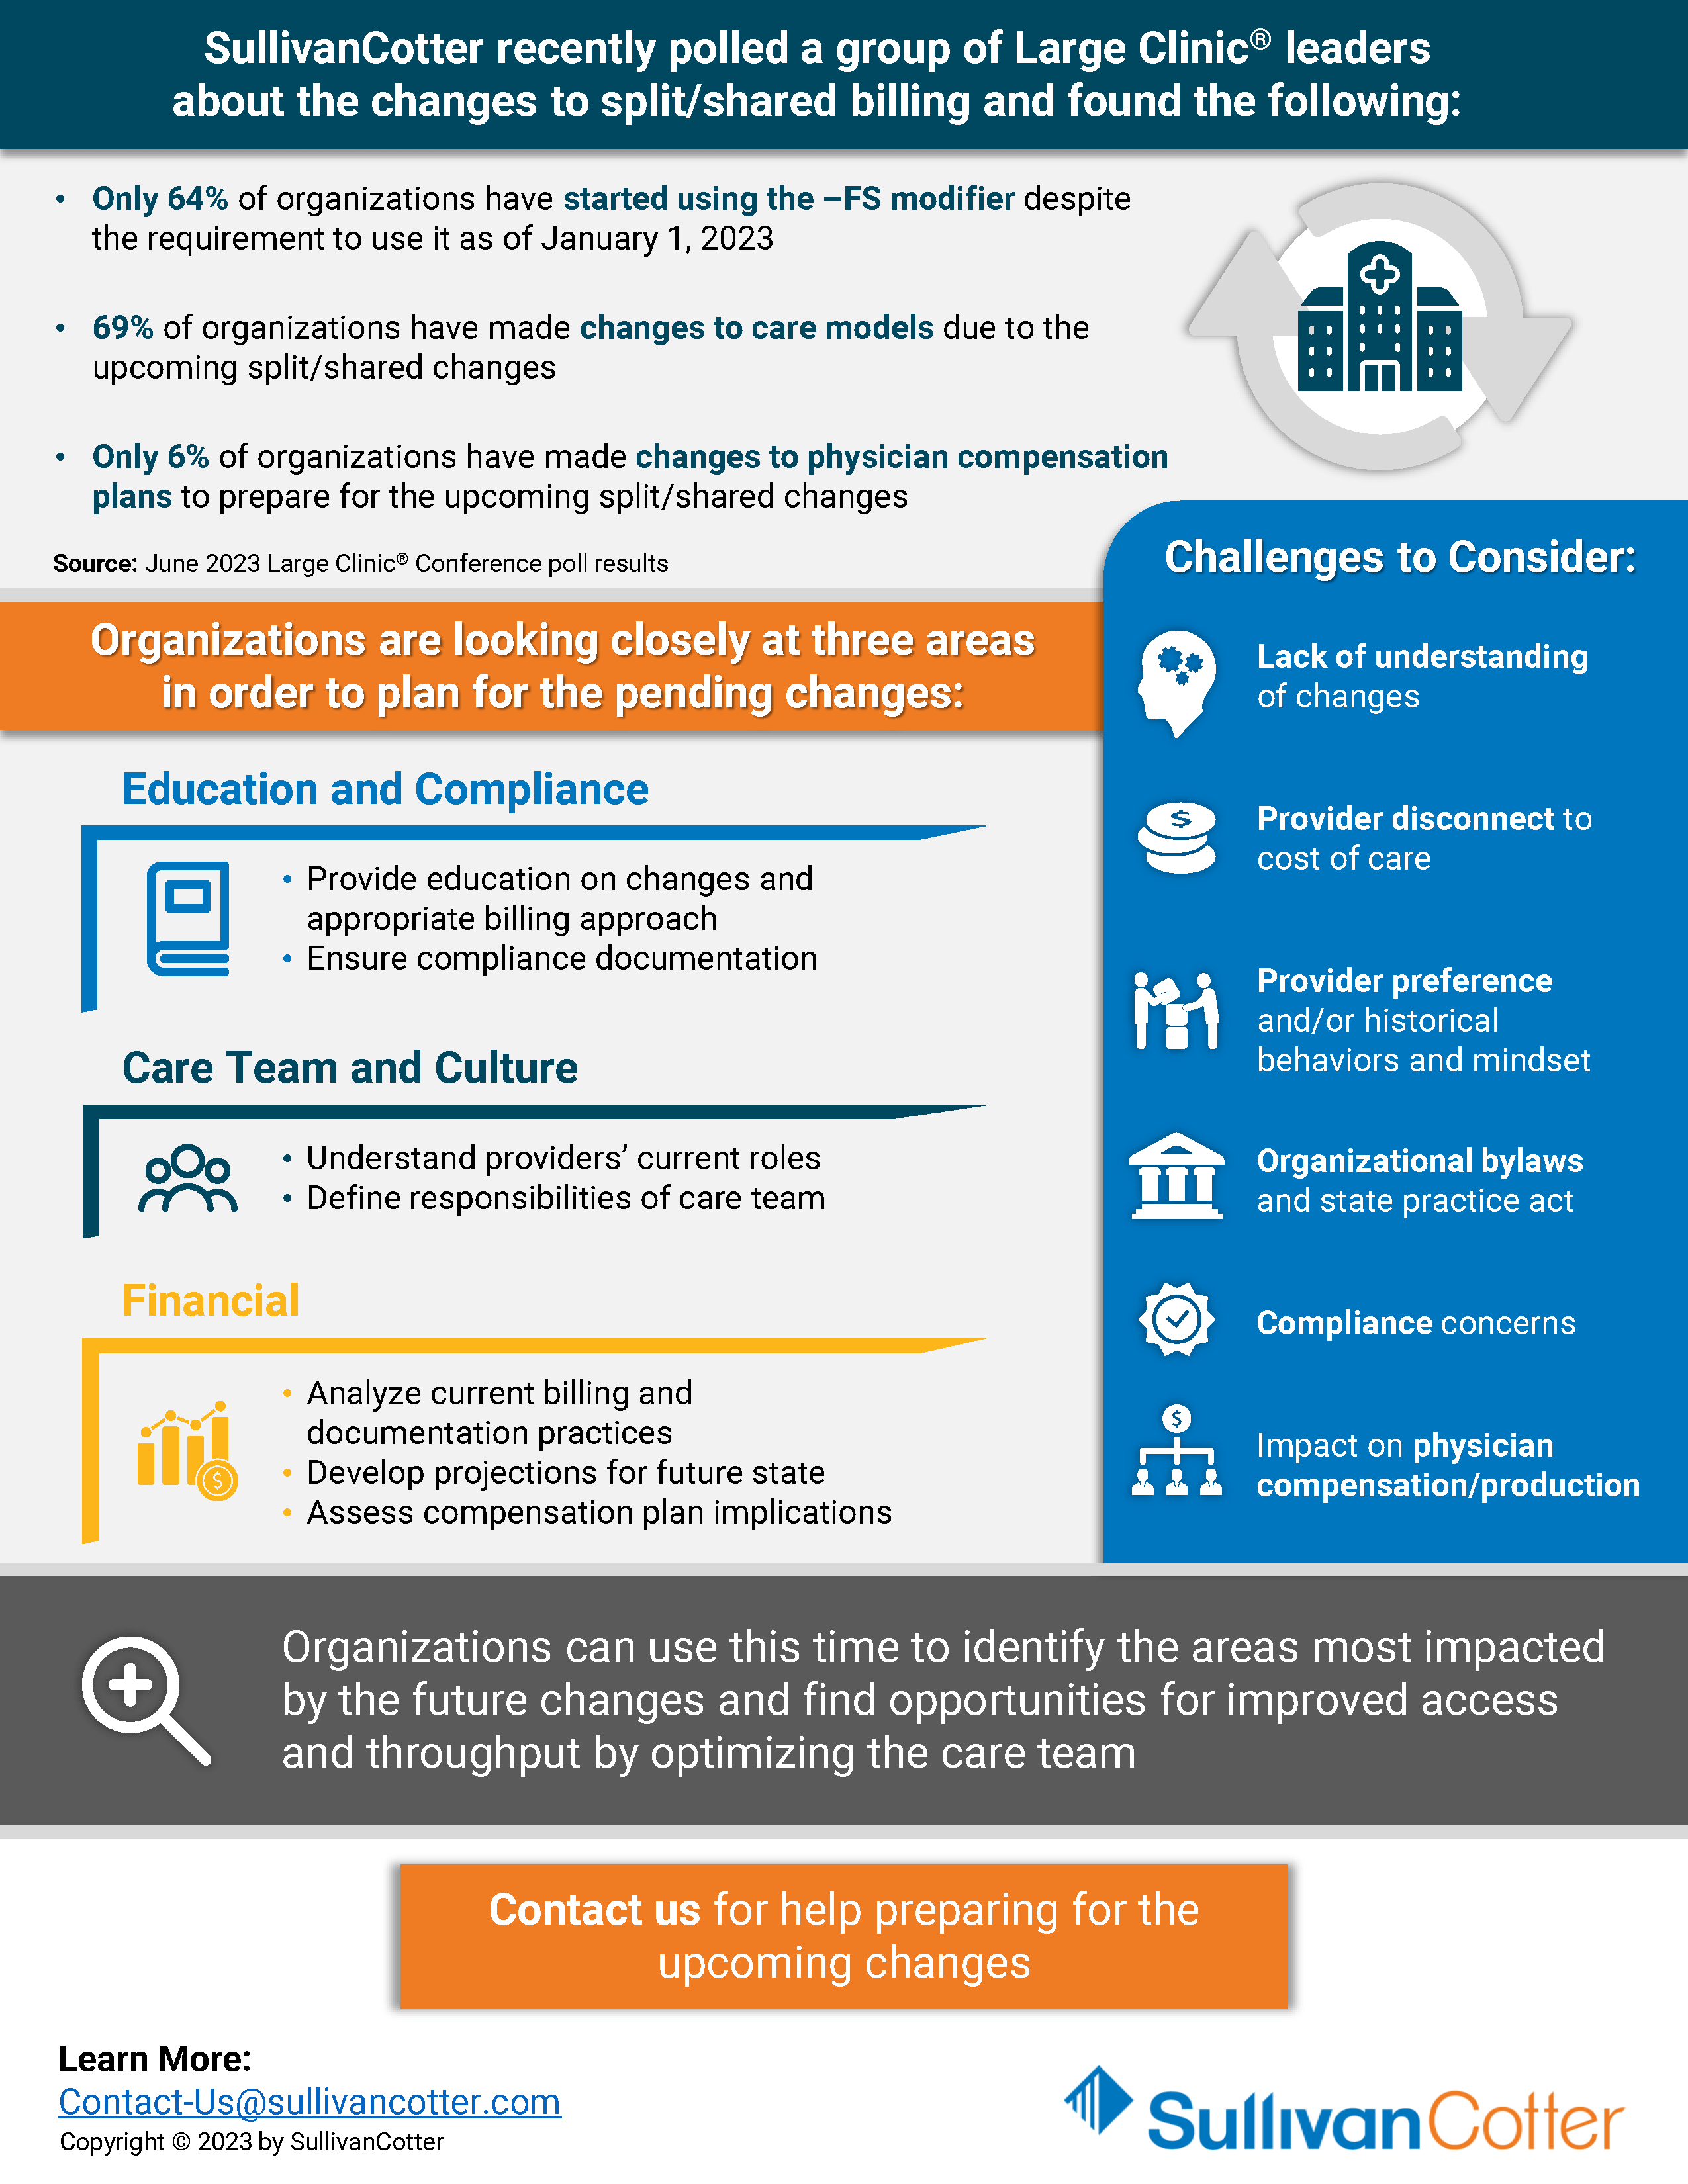
On July 13, 2023, the Centers for Medical and Medicaid Services (CMS) announced the proposed rule to further delay the use of the time-based methodology for billing split/shared visits until “at least” January 1, 2025. Organizations can use this time to identify the areas most impacted by future changes and find opportunities for improved access and throughput by optimizing the care team.
This insightful infographic provides an overview of the split/shared billing timeline. It also highlights three main focus areas that organizations are looking closely at in order to plan for the pending changes, as well as what challenges should be considered.
The 2023 survey is now open for submission! Register to participate in this year’s survey to gain access to critical compensation market data, information on key employee workforce practices, and insight into emerging industry trends.
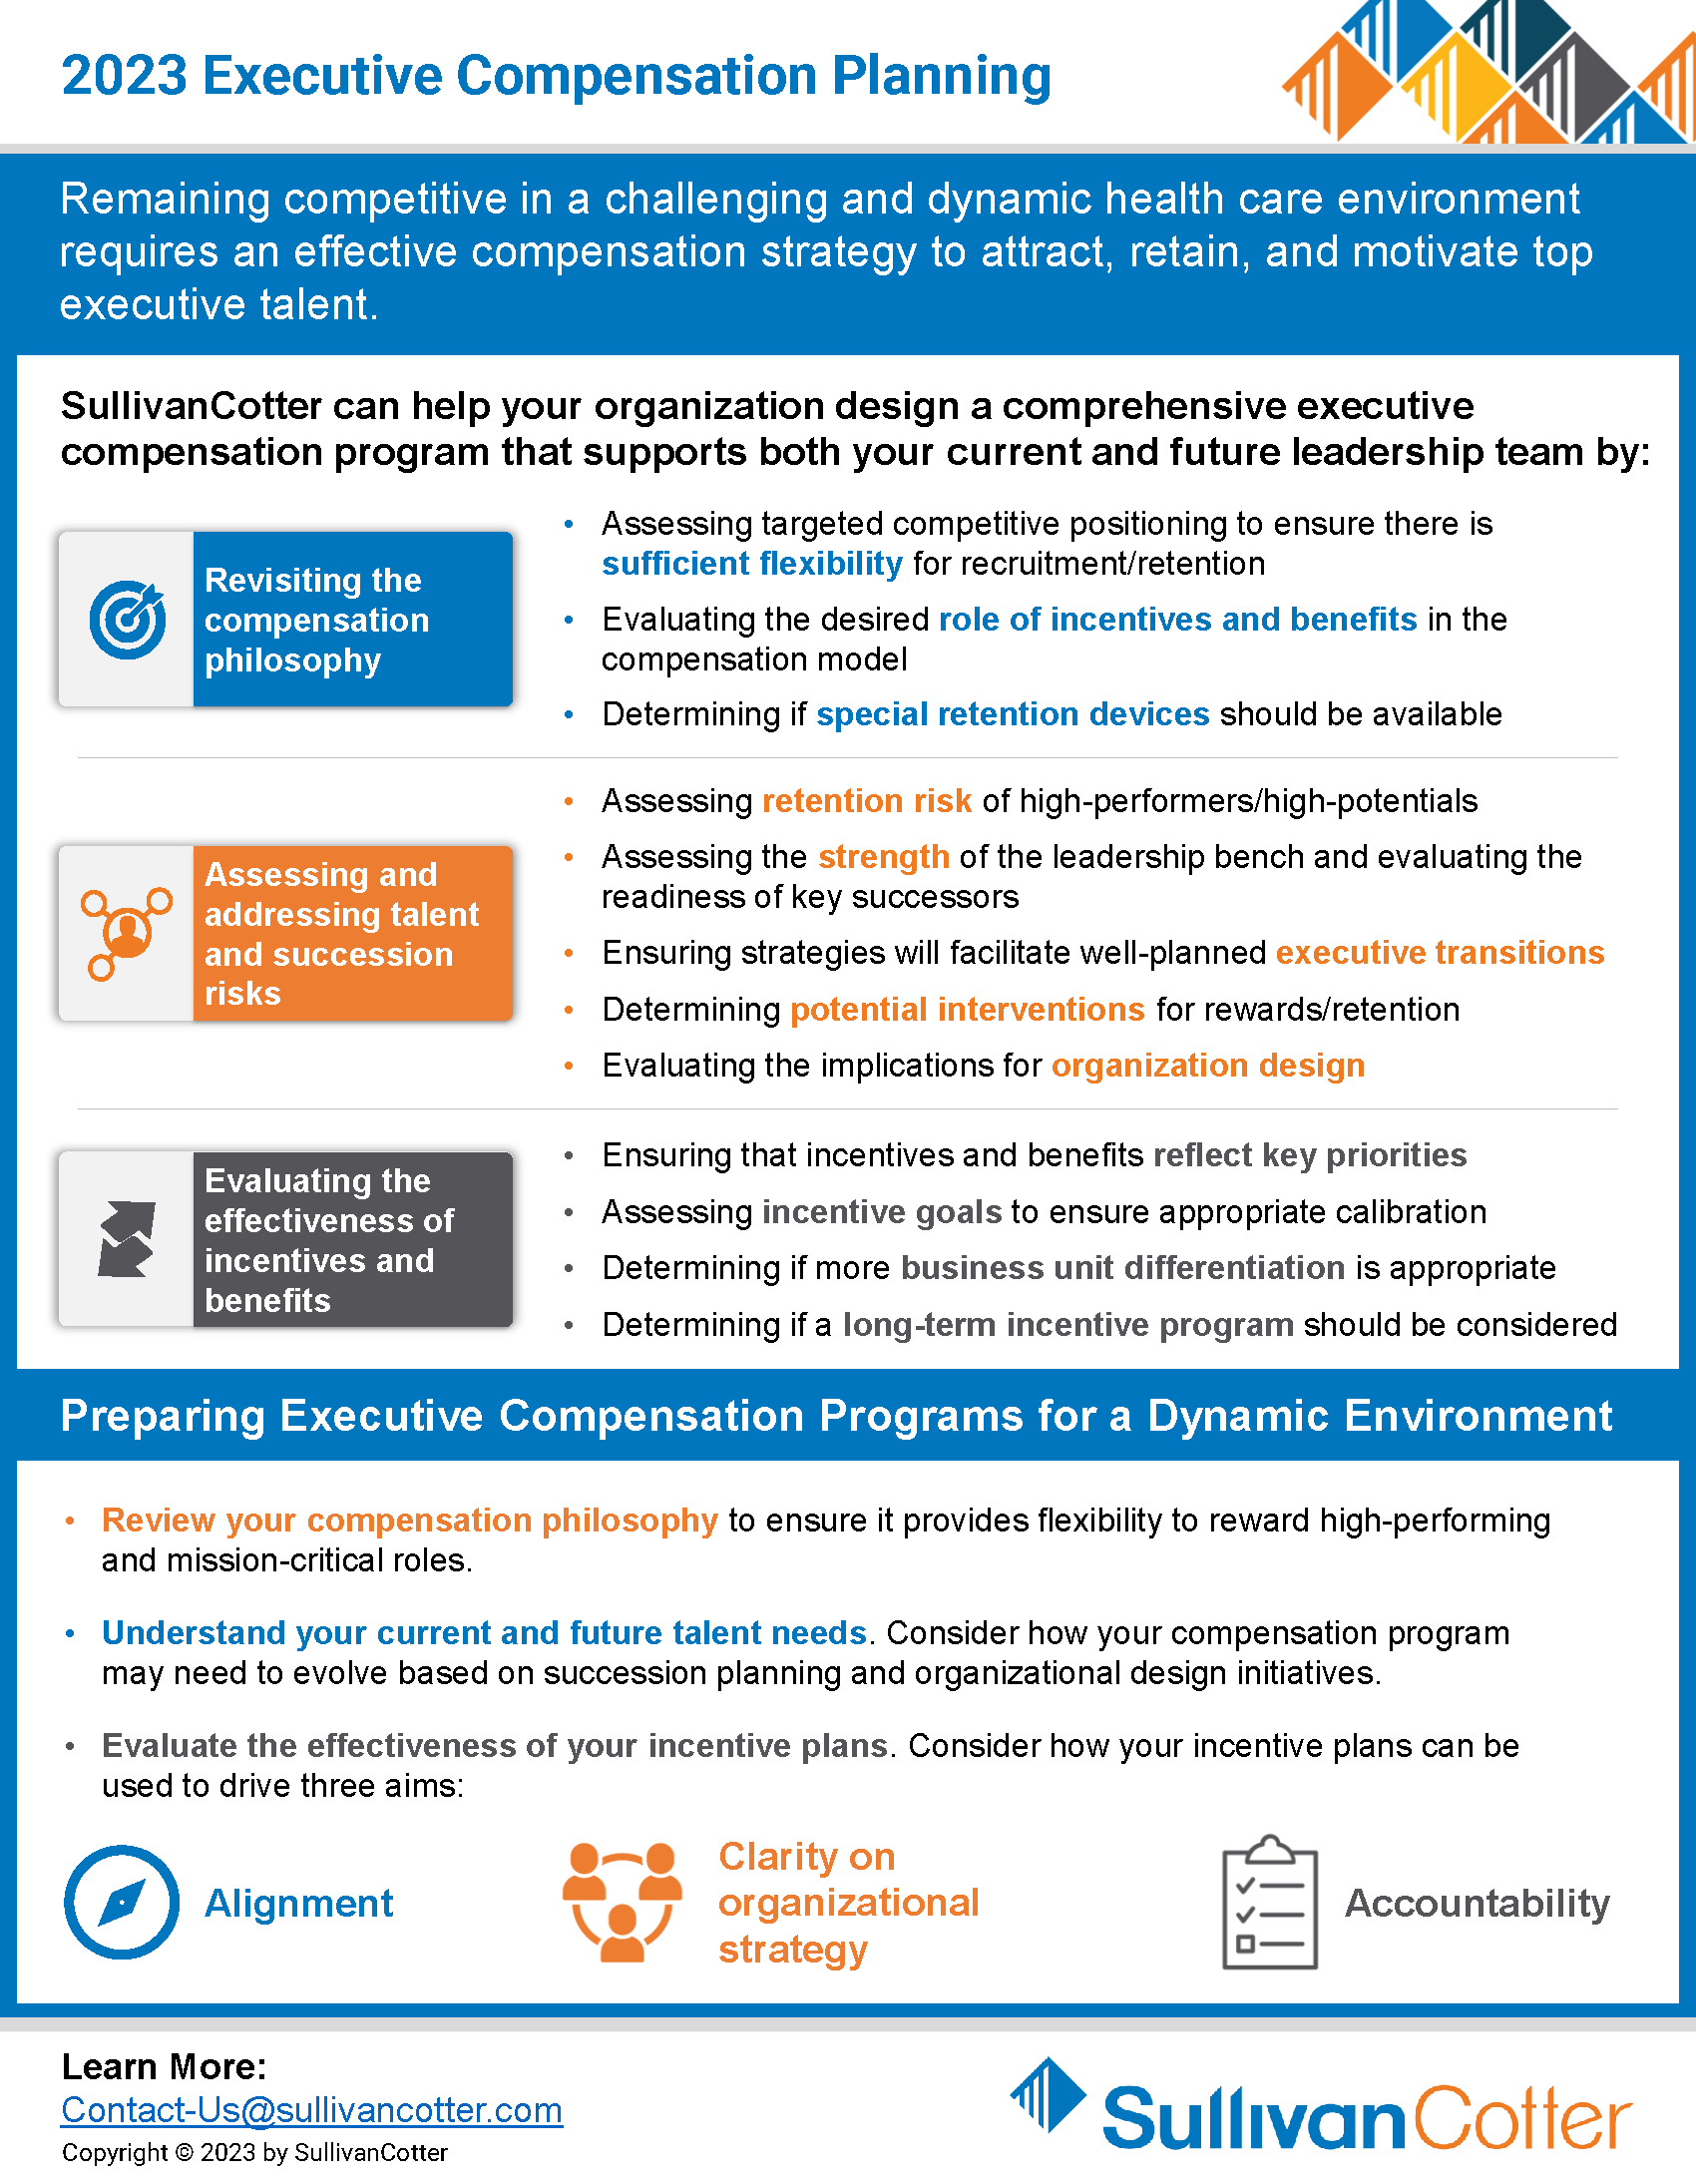
INFOGRAPHIC | 2023 Executive Compensation Planning
SullivanCotter can help your organization design a comprehensive executive compensation program.
Remaining competitive in a challenging and dynamic healthcare environment requires an effective compensation strategy to attract, retain, and motivate top executive talent. Designing a comprehensive executive compensation program can support both your current and future leadership team by:
- Revisiting the compensation philosophy
- Assessing and addressing talent and succession risks
- Evaluating the effectiveness of incentives and benefits
Interested in learning more?
VIEW INFOGRAPHIC
Executive Compensation and Governance Considerations for Health Systems
Priorities for health systems and compensation committees for 2023 and beyond
READ FULL ARTICLE
Faced with increasing financial pressure, growing demand for executive talent, rising pay levels, and intense scrutiny of executive compensation within not-for-profit health systems, compensation committees are delicately balancing financial, operational, talent, and governance risks in their executive compensation programs in this difficult environment.
Featured in The Governance Institute’s July E-briefings, Bruce Greenblatt, Managing Director, SullivanCotter discusses four key priorities compensation committees should consider to ensure their recruitment, retention and rewards objectives are met.
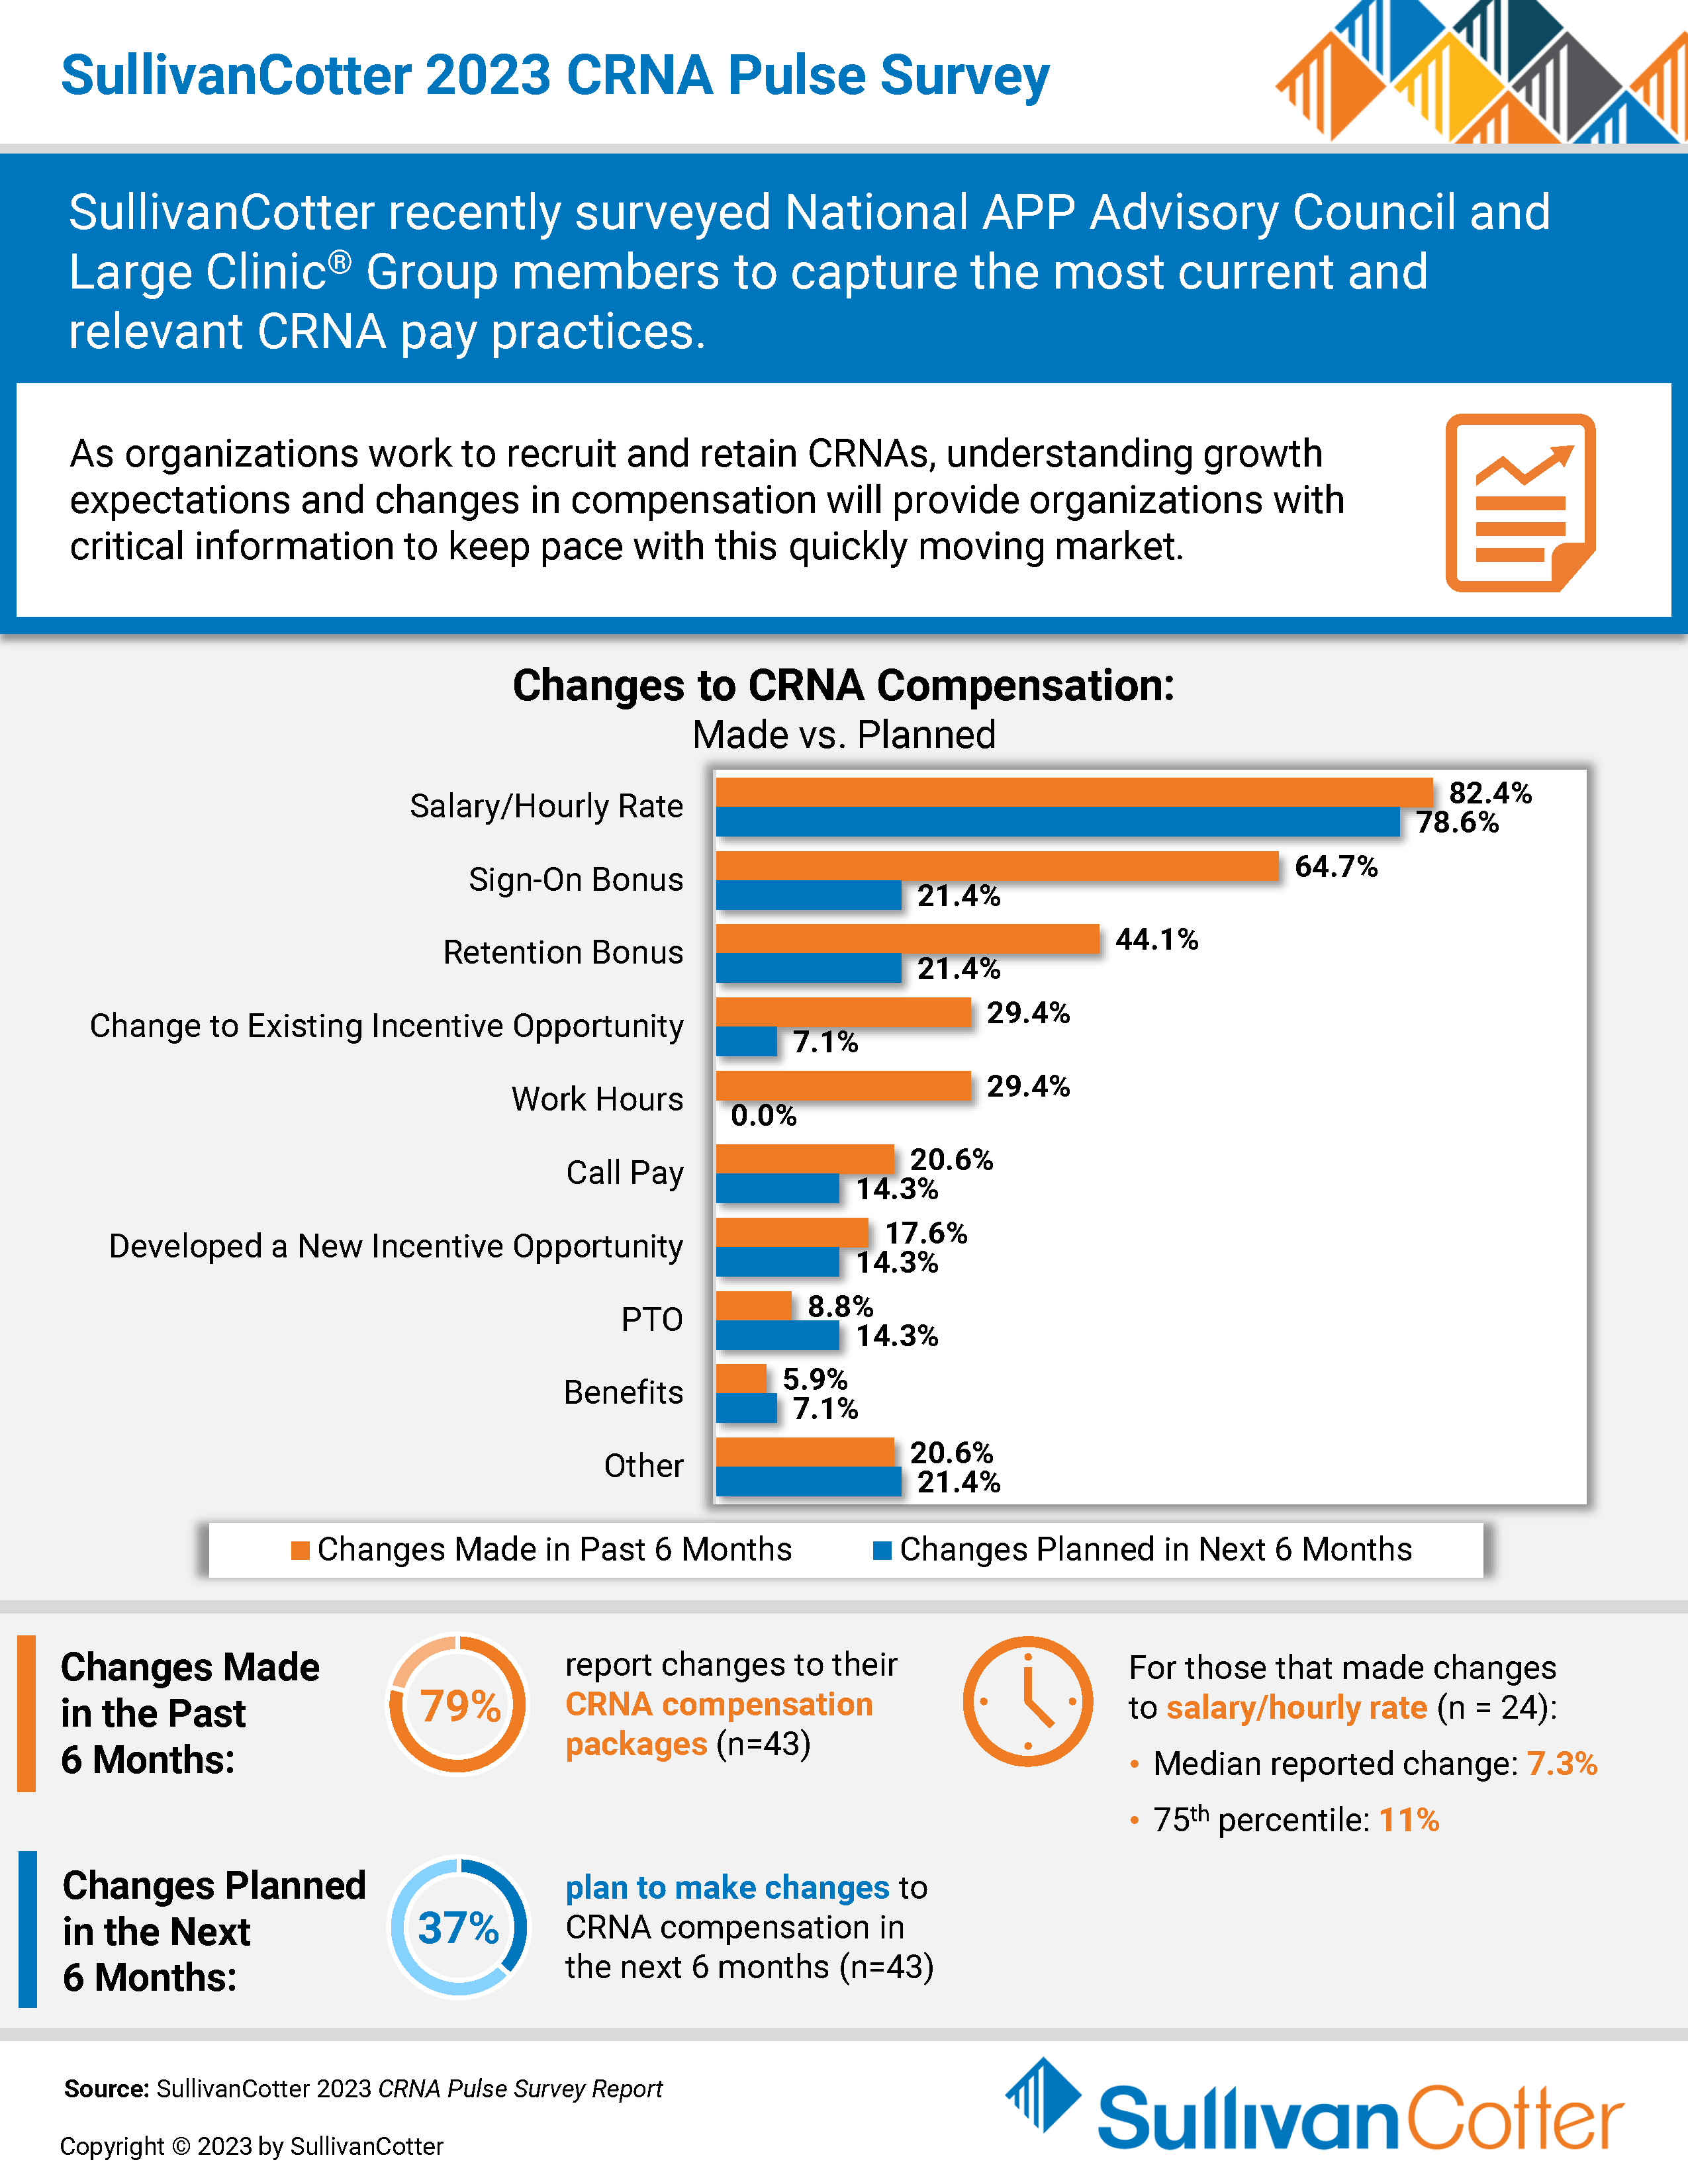
INFOGRAPHIC | 2023 CRNA Pulse Survey
SullivanCotter recently surveyed National APP Advisory Council and Large Clinic® Group members to capture the most current and relevant CRNA pay practices.
As organizations work to recruit and retain CRNAs, understanding growth expectations and changes in compensation will provide organizations with critical information to keep pace with this quickly moving market.
VIEW INFOGRAPHIC
Modern Healthcare | The Latest Trends in Executive Compensation
SullivanCotter featured in Modern Healthcare’s annual executive compensation issue
READ FULL ARTICLE
As hospitals and health systems continue to navigate a constricted labor market and challenging economic environment, they must also focus on recruiting and retaining executive-level leaders with the right mix of skills to oversee increasingly complex organizations.
Featuring data and insights from SullivanCotter, Modern Healthcare's annual executive compensation article explores the latest trends that healthcare organizations should consider.
Market Drivers for Value-Based Primary Care Physician Compensation Models
As featured by the American Association of Provider Compensation Professionals (AAPCP)
READ FULL ARTICLE
To support the achievement of the Triple Aim goals, The Centers for Medicare and Medicaid Services (CMS) set forth a plan to shift Medicare’s reimbursement methodology from a volume-based system to a value-based system. Given evolving CMS reimbursement methodologies and innovation programs, along with the growing adoption of Medicare Advantage plans and local market opportunities for commercial payer APMs, healthcare organizations are increasingly implementing provider compensation plans that support the behaviors needed to perform well under value-based reimbursement methodologies. As such, incorporating team-based methodologies and the consideration of panel management is a growing trend.
In this article, published by the American Association of Provider Compensation Professionals (AAPCP), SullivanCotter highlights a case study that includes:
- Defining the Team in Team-Based Care
- Anticipating the conversion from fee-for-service to risk-based primary care services in a large community-based health care system with a significant commercial payer relationship
- Evolving their primary care delivery model from a physician-centric approach to a team-based approach to achieve organizational value-based care delivery goals
- Assessing the regulatory requirements and Fair Market Value (FMV) implications for these compensation arrangements
Originally published by the American Association of Provider Compensation Professionals
SullivanCotter Provider Needs Assessment Services Help Match Clinical Resources with Localized Demand
Interactive cloud-based application provides health care organizations with data-driven insights to develop effective physician and Advanced Practice Provider workforce plans
June 28, 2023 – CHICAGO – SullivanCotter, the nation’s leading independent consulting firm in the assessment and development of rewards programs and workforce solutions for the healthcare industry and not-for-profit sector, has made adjustments and enhancements to its Provider Needs Assessment (PNA) services to better help hospitals and health systems as they build strategic workforce plans to support service line expansions, care team development, and population health initiatives while managing for optimal cost and efficiency.
PNA includes three distinct service offerings: PNA Base, PNA Pro, and PNA Enterprise, which provide access to market-specific provider supply and demand data to inform strategic growth planning. For example, zip code-level data can indicate a growing need for specific health services based on aggregated localized claims data, helping health organizations identify opportunities to grow and better serve communities.
Recent enhancements to SullivanCotter’s dynamic PNA application include:
- Incorporating Advanced Practice Provider (APP) supply and demand information with physician data
- Refining and expanding the PNA provider specialties, aligned with SullivanCotter benchmarks
- Updating population demographics and demand utilization with the latest 2020 U.S. Census data projections
- Applying additional rigor to the study of underlying claims data for a more precise demand calculation
- Integrating a provider mapping tool to visualize FTE provider counts by specific location
- Introducing a report generation tool that publishes and archives assessment results
- Combining the quantitative studies with qualitative assessments and SullivanCotter consulting support to develop provider workforce plans
To meet the needs of all health care organizations, SullivanCotter now offers three distinct levels of services:
PNA Base is structured for an individual hospital and uses an advanced supply and demand methodology to determine net physician needs for client-defined service areas.
PNA Pro supports multiple hospitals with large or shared geographies. It includes additional provider supply research and allows for the incorporation of client-provided provider rosters. The supply data is call-verified for increased accuracy and to provide a comprehensive review of physicians and primary care APPs to determine net need.
PNA Enterprise is the most comprehensive PNA service available to hospitals and health systems. It includes a researched and call-verified supply of providers, comprising an expanded set of APP specialties. It incorporates both the determination of the quantitative net need for custom geographies as well as qualitative analyses to better understand the dynamics of each market, service line, and specialty. PNA Enterprise offers workforce planning insights by tiering recruitment priorities through a series of interviews, studies, and facilitated planning sessions. This culminates in the delivery of a well-defined provider workforce plan.
“Amid an ongoing health care workforce crisis, access to detailed market-specific physician and APP supply and demand data and custom analyses is crucial as leaders optimize clinical resources. Our enhanced PNA services allow organizations to segment provider team needs, enabling them to identify the right numbers and types of providers required to deliver high-quality, affordable, and accessible care that more closely meets their market needs,” said Mark Ryberg, Managing Principal and Physician Workforce Practice Leader, SullivanCotter.
How SullivanCotter Can Help
Along with PNA services, SullivanCotter helps clients improve their physician and APP planning process with PNA application support, subject matter insights, data review guidance, application training, and use case scenarios. SullivanCotter’s PNA services combine data-driven technology, industry-leading benchmark data, and years of physician and APP workforce consulting experience to provide organizations with the information and insights they need to inform key service lines, practice, and payer strategies in an evolving health care environment.
To learn more, request a demo, or view a full list of features and functionality, visit sullivancotter.com/PNA or call 888.739.7039
About SullivanCotter
SullivanCotter partners with healthcare and other not-for-profit organizations to understand what drives performance and improve outcomes through the development and implementation of integrated workforce strategies. Using our time-tested methodologies and industry-leading research and information, we provide data-driven insights and expertise to help organizations align business strategy and performance objectives – enabling our clients to deliver on their mission, vision, and values.
Measure, Assess and Improve Medical Group Performance
Performance improvement and optimization efforts will remain an ongoing focus for many organizations
READ FULL ARTICLE
Last year, hospitals and health systems experienced some of the most significant financial challenges since the start of the pandemic. Hospital margins are still tracking low into 2023 and, with declining reimbursement and lower patient volumes, this is likely to continue for the foreseeable future. As a result, many organizations are considering how to effectively evaluate performance across all of their assets and especially within the medical group.
Medical group performance can greatly influence the success of a hospital or health system and is critical to maintaining financial sustainability as market pressures continue to mount. In this article, published by the American Association of Provider Compensation Professionals (AAPCP), SullivanCotter highlights:
- The key characteristics of a successful medical group
- Best practices in measuring, assessing, and improving performance across the care continuum
- How compensation serves as an important component of this process
Originally published by the American Association of Provider Compensation Professionals
The Governance Institute | Academic Health Focus
Navigating Provider Compensation in a Competitive Landscape
READ FULL ARTICLE
Recruiting and retaining both physician faculty and advanced practice providers (APPs) has emerged as a significant challenge for academic medical centers (AMCs) across the United States. The convergence of labor markets and care delivery models require more frequent updates to the principles and philosophies guiding physician faculty and APP compensation. AMCs are adopting a more strategic approach to physician faculty and APP compensation that supports recruitment and retention, enhances the AMC’s tripartite mission, and supports long-term sustainability.
In an article written for The Governance Institute, SullivanCotter’s Jason Tackett, Managing Principal, and Zachary Hartsell, Principal, discusses the transformational strategies needed for a more proactive and sustainable approach to physician and APP compensation


