Quantifying the Cost of Advanced Practice Provider Turnover
Assessing the Financial Implications
Zachary Hartsell, DHA, PA-C, Principal, SullivanCotter
Amy Noecker, M.Ed., Principal, SullivanCotter
DOWNLOAD FULL ARTICLE
The United States Department of Labor recently cited an unemployment rate of 3.7%, further noting that jobs in health care have increased by 403,000 over the past 12 months.1 This surge in health care jobs combined with historically low unemployment rates has made retaining workers more challenging. According to NSI Nursing Solutions’ 2019 National Health Care Retention & RN Staffing Report, the current hospital turnover rate across all jobs in the industry is at 19.1%.2 While turnover is the natural order of business in any industry, its impact on an organization – in cost, morale and work disruption – can be significant.
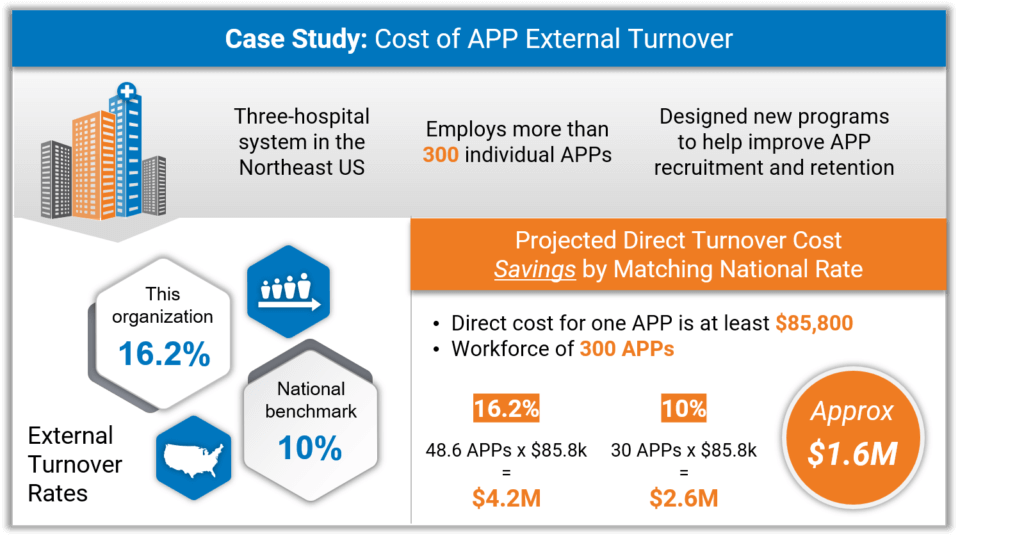
Turnover of physician and nursing staff has been studied extensively in both academic and commercial settings, resulting in a better understanding of their associated costs (see end of article for a list of additional resources). Turnover of advanced practice providers (APPs), however, lacks similar scrutiny. SullivanCotter’s 2019 Advanced Practice Provider Compensation and Pay Practices Survey Report cites an average external turnover rate of 10%, which is down from 12% in 2017.5 While a good amount of historical data exists for actual turnover rates, the cost of turnover has been difficult to report given a multitude of factors that must be considered.
To better understand the cost of turnover, SullivanCotter reviewed several organizational factors impacting turnover and developed a methodology for assessing the related costs. By providing organizations with a framework to perform their own APP turnover cost assessment, we hope this will help to improve the reporting of turnover costs in the future.
This white paper uses data compiled from the National APP Advisory Council’s (NAAC) Workgroup on Turnover as well as well as the following surveys from SullivanCotter:
- Advanced Practice Provider Compensation and Pay Practices Survey Report
- Advanced Practice Provider Individual Survey Report
- Advanced Practice Provider Organizational Practices Survey Report
BACKGROUND ON APP TURNOVER
APP turnover can have a profound impact on patient care and provider satisfaction, and understanding both the causes and costs are imperative. While certain programs have proven effective in reducing turnover, such as formal onboarding programs, mentoring programs, and opportunities for advancement/career development, they often come with costs of their own.3,4
The ability to calculate the return on any such investment is essential in determining whether or not to invest in these programs. In order to be consistent, SullivanCotter recommends using a three-step process to evaluate the financial implications of APP turnover. This includes 1) examining the organizational factors that impact turnover, 2) assessing the related costs and 3) performing an APP turnover cost assessment.
TURNOVER: DEFINED AND CALCULATED
There are two kinds of APP turnover: external and internal.
External turnover occurs when an APP voluntarily leaves an organization. This is often to go to a competitor and may be preventable. Internal turnover occurs when an APP transfers to another service line or specialty within the same organization. This is more common for APPs than physicians given the structure of their certification and licensure.


While this article focuses on the cost of external APP turnover, internal turnover can also significantly impact an organization. While some degree of internal APP turnover is expected and can represent a retention strategy through the ability to offer career growth while staying at the organization, excessive internal turnover can suggest equity issues related to compensation, benefits or culture. A careful review of internal turnover, including interviews
with incumbents, can help to uncover what is driving the situation.
FACTORS THAT DRIVE EXTERNAL TURNOVER
There are several factors that drive external APP turnover. A commonly cited cause is compensation that is not aligned with the market. However, compensation is rarely the sole driver of APP dissatisfaction or turnover.
According to SullivanCotter’s research, there are several additional factors that impact APP engagement and turnover:
LEADERSHIP
- Organizations that have a top APP leader with responsibilities such as developing overall APP
strategy and infrastructure, managing budgets and serving as the expert on the APP workforce
have 2% lower turnover than organizations who do not.5- Data from 180 organizations with 28,158 APPs.
- APPs who report to an APP leader are about 8% less likely to consider leaving the organization in
the next 12 months than those who do not report to an APP leader.6- Data from 6 organizations with 800 APPs.
UTILIZATION
- APPs who feel maximally or significantly utilized are 22% less likely to consider leaving the organization in the next 12 months than those perceived to be underutilized.6
- Data from 7 organizations with 891 APPs.
- APPs who feel maximally or significantly utilized are more likely to recommend the organization
as a good place to work than those perceived to be underutilized.6- Data from 7 organizations with 894 APPs.
PROFESSIONAL STATUS
- APPs who have dedicated time for non-clinical activities, such as committee work, community outreach, leadership or administration, process/quality improvement work, research, and student education/faculty member, are about 17% less likely to consider leaving their organization in the next 12 months than those who do not have dedicated time for non-clinical activities.6
- Data from 7 organizations with 496 APPs.
COMPENSATION
- APPs who believe their compensation is fair or higher than peers are about 33% less likely to consider leaving the organization in the next 12 months than those who feel their compensation is not fair or lower than peers.6
- Data from 5 organizations with 300 APPs.
- APPs who believe their compensation is fair or higher than peers are more likely to recommend their organization as a good place to work than those who feel their compensation is not fair or lower than peers.6
- Data from 5 organizations with 563 APPs.
METHODOLOGY FOR ASSESSING COSTS
To assess the cost of APP turnover, it is important to focus on known and measurable factors with a direct cost and attributable dollar amount (e.g., recruitment, sign-on bonuses, training, etc.). Indirect costs, such as provider dissatisfaction, burnout and lost patient revenue, can vary widely by organization and are difficult to capture and calculate.
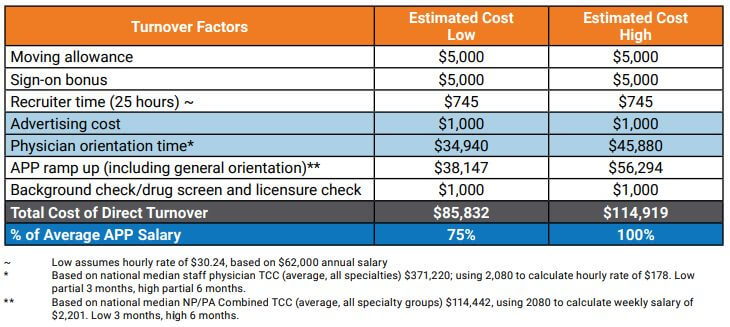
The elements below have direct costs related to APP turnover: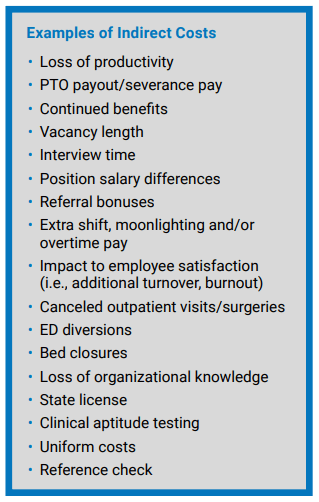
- Moving allowance
- Sign-on bonus
- Recruiter time (e.g. hours spent per APP recruited)
- Advertising
- Physician time for orientation and onboarding with a new APP (e.g. hours spent per APP oriented that took time away from patient care)
- APP time for orientation and onboarding (e.g. hours spent in non-billable orientation time)
- Background check/drug screen and licensure verification
Based on SullivanCotter’s survey research and industry insights, the total direct turnover cost for a single APP ranges between $85,832 and $114,919.5,7 This estimate is consistent with data from both physician and nursing turnover research.8,9,10 Similar to research on physician and nursing turnover costs, the indirect costs associated with APP turnover are likely significantly higher than the direct costs. These indirect costs are often difficult to calculate given the different variables within each calculation.
Although the costs noted above are objective and quantifiable, the cost of APP turnover may differ from one organization to another. As a result, organizations should perform an individual assessment. When performing an assessment, the elements of turnover should be easily extracted or estimated and agreed upon in advance by executive stakeholders and the group charged with calculating the costs of APP turnover. To properly perform an assessment of the total cost of APP turnover, organizations must have the following information available:
- Number of APPs working in your organization
- External turnover rate
- Headcount of the turnover rate (total number of APPs multiplied by the turnover rate)
- Factors driving turnover (consider exit interviews and/or engagement surveys)
CONCLUSION
Understanding the related costs and their drivers is only part of the solution to reducing APP turnover. While the direct cost of turnover is calculated to be between $85,832 – $114,919, this is under-representing the full cost of turnover once indirect costs are included. Assessing how to address APP turnover, once drivers have been identified and costs have been calculated, can be even more challenging. This process requires determining what programs are apt to reduce turnover and, equally significant, the costs of those programs. Proposed programs such as postgraduate clinical training (fellowships), protected professional development, career ladders and onboarding should be evaluated for effectiveness and return on investment prior to widespread implementation. Additionally, APP leadership structures should be assessed because the presence of an APP leader has been shown to help reduce turnover.
There is an important cultural aspect to developing and implementing solutions that reduce turnover. It is essential to obtain feedback and buy-in from clinical leadership and additional stakeholder groups such as practicing physicians, practicing APPs, finance, human resources and operational leadership in order to implement long-term, sustainable solutions. Holistic current-state assessments are a good way to bring together key stakeholders and provide both quantitative and qualitative data to inform decision-making.
Additional Contributors:
- Brenda Madura, MS, APRN, CNM-BC, Director of Advanced Practice Clinicians, Advocate Health Care
- Cynthia Flores, PA-C, Senior Director, Advanced Providers, Vituity
- Rhonda Hoyer, RN, MS, ANP-C, Director of Advanced Practice, UW Health
- Surani Hayre-Kwan, DNP, MBA, FNP-BC, FACHE, FAANP, Director, Professional Practice and Nursing Excellence
Sutter Health
SOURCES
1. Bureau of Labor Statistics. (2019). Current Employment Statistics Highlights. Retrieved from https://www.bls.gov/web/empsit/ceshighlights.pdf
2. NSI Nursing Solutions, Inc. (2019). 2019 NSI National Health Care Retention & RN Staffing Report. Retrieved from https://nsinursingsolutions.com/Documents/Library/NSI_National_Health_Care_Retention_Report.pdf
3. Kurnat-Thoma, E., Ganger, M., Peterson K. & Channell, L. (2017). Reducing Annual Hospital and Registered Nurse Staff Turnover: A 10-Element Onboarding Program Intervention. Sage Open Nursing, 3, 1-13. Retrieved from https://doi.org/10.1177/2377960817697712
4. Fibuch, E., & Ahmed, A. (2015). Physician Turnover: A Costly Problem. Physician Leadership Journal, 2(3), 22-25.
5. SullivanCotter 2019 Advanced Practice Provider Compensation and Pay Practices Survey Report
6. SullivanCotter 2019 Advanced Practice Provider Individual Survey Report
7. SullivanCotter 2019 Advanced Practice Provider Organizational Practices Survey Report
8. Misra-Herbert, A.D., Kay, R., & Stoller, J.K. (2004). A Review of Physician Turnover: Rates, Causes and Consequences. American Journal of Medical Quality, 19(2), 56-66. doi: 10.1177/106286060401900203
9. Schutte, L. (2012). What You Don’t Know Can Cost You: Building a Business Case for Recruitment and Retention Best Practices. The Journal of the Association of Staff Physician Recruiters, 19(3). Retrieved from https://member.aappr.org/general/custom.asp?page=696
10. Shanafelt, T., Goh, J., & Sinsky, C. (2017). The Business Case for Investing in Physician Well-being. The Journal of the American Medical Association– Internal Medicine. 177(12), 1826-1832. doi:10.1001/jamainternmed.2017.4340