
WEBINAR | 2023 Clinical Workforce Trends
View SullivanCotter’s on-demand webinar, revealing the latest health care industry trends, informed by our recent employee workforce surveys. During this webinar, we explored today’s labor challenges impacting the clinical workforce and how organizations are adapting clinical care models to ensure continuity of care. We discussed the latest trends in compensation for nurses and APPs, including base pay, salary increases, compensation design and more.
This webinar covers:
- Relevant market trends and insights on how organizations address labor shortages and retention issues through strategic compensation practices
- Organizational responses to increased nursing union participation and union/non-union compensation
- Typical nursing reporting structures and spans of control
- Trends in nursing compensation, including geographic differentials, compensation design, and salary increase planning
- Trends in APP compensation, including emerging compensation designs
Fill out the form below to access the full webinar.

INFOGRAPHIC | A Data-Driven Approach to Clinical Workforce Planning
SullivanCotter’s Provider Needs Assessment (PNA) provided Sentara Health with insight into
the current and projected clinical workforce needed to best serve patients across diverse markets.
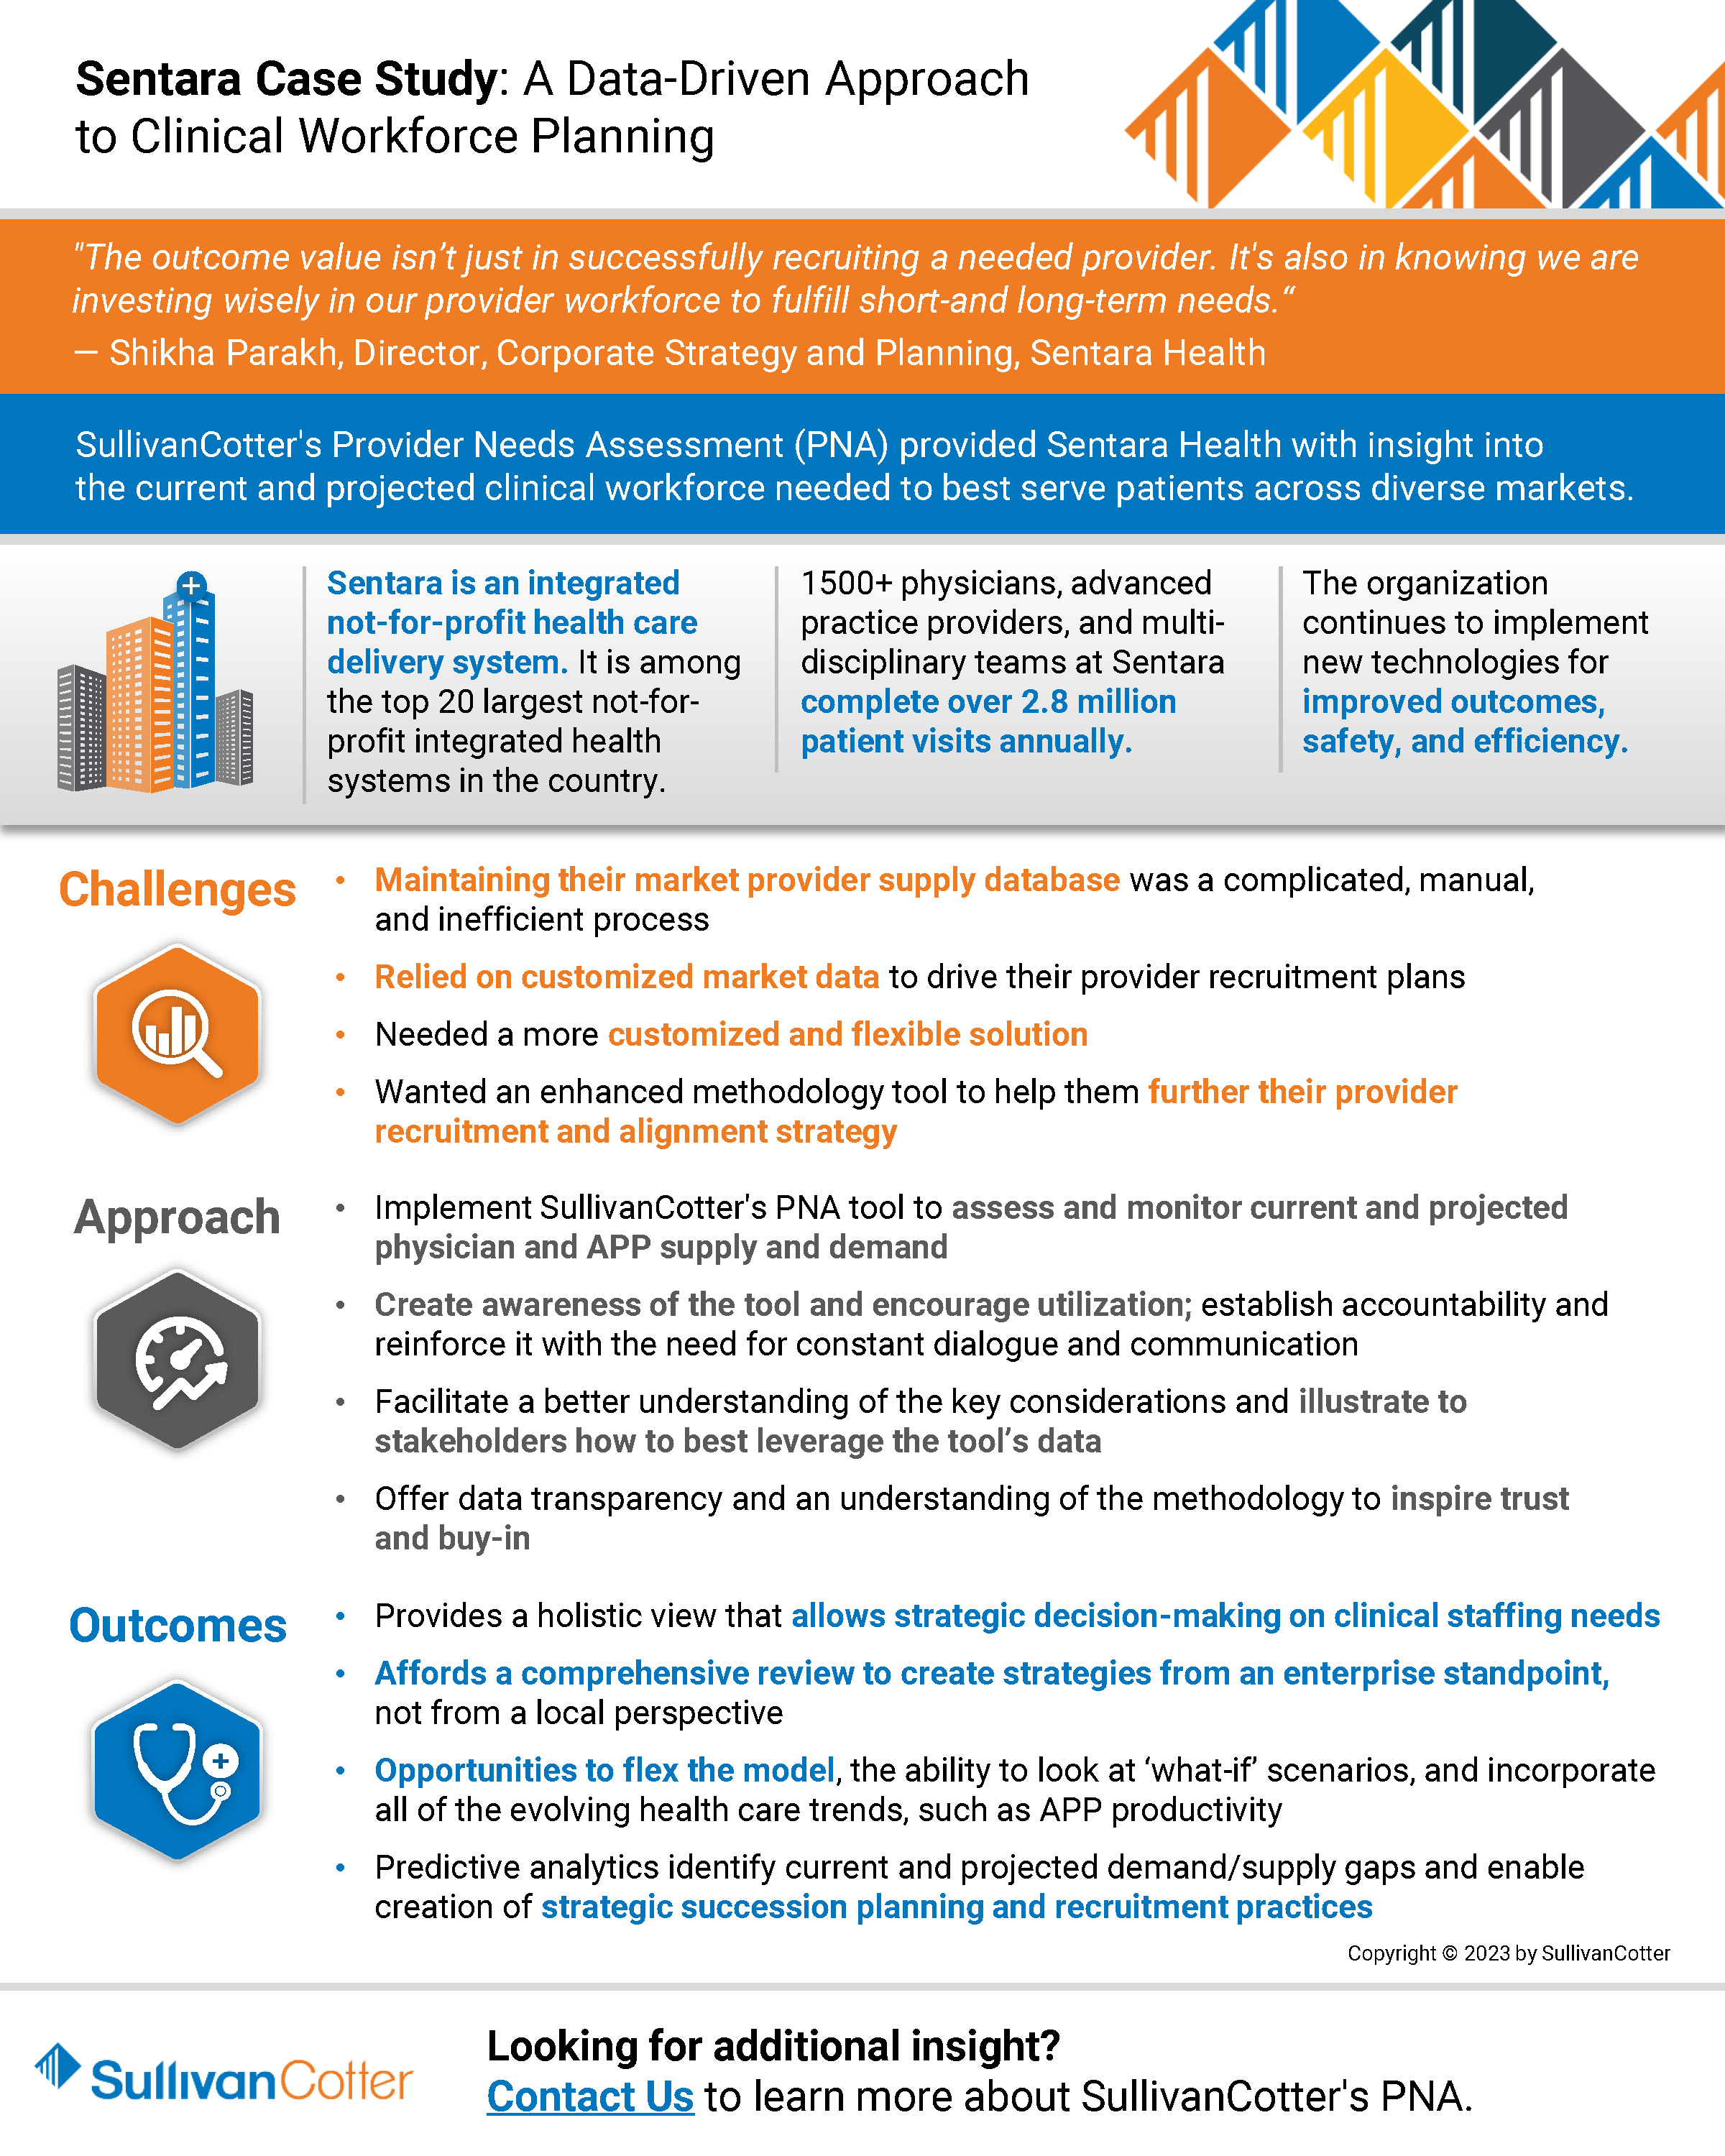

Sentara Health: A Data-Driven Approach to Clinical Workforce Planning
Sentara Health is a prominent health system in the U.S. Mid-Atlantic and Southeast regions. It ranks among the country’s top 20 largest not-for-profit integrated health systems. With a workforce of 30,000 dedicated employees, Sentara encompasses 12 hospitals in Virginia and northeastern North Carolina. In addition, the Sentara Health Plans division effectively manages the healthcare needs of over 1.2 million members in Virginia and Florida. Nationally recognized for its commitment to clinical quality and safety, Sentara remains steadfastly focused on innovation and delivering an exceptional healthcare experience to its patients and members. The Sentara Medical Group (SMG), comprising more than 1,500 physicians, advanced practice providers, and multi-disciplinary teams, completes over 2.8 million patient visits annually. The organization has a strong commitment to innovation and continues to implement new technologies for improved outcomes, safety, and efficiency.
The Challenge
Though a forward-thinking organization in the healthcare industry, Sentara faced significant challenges in clinical workforce staffing, recruiting, and planning across urban and rural settings. As a growing health system with the need for an efficient, flexible solution, Sentara sought a partner to provide an enhanced methodology to further develop and complete its provider recruitment strategy and provider needs assessment.
While delivering quality care to a large and diverse population is one of Sentara’s key missions, tracking a fluctuating number of care providers had become challenging. Maintaining a roster of the organization’s physicians required frequent and manual updates. Amid an ongoing health care workforce crisis, Sentara recognized the need for an innovative workforce strategy to balance the operational post-COVID realities, align with organizational and cultural needs, and meet their transformation goals.
A key priority for the solution was a self-service and comprehensive workforce planning platform that would provide their team easy access to real-time data.
The Approach
After a comprehensive search, Sentara chose SullivanCotter’s Provider Needs Assessment (PNA) tool. PNA is an interactive cloud-based application that delivers accurate and actionable data-driven insights to help organizations identify, monitor and respond to changing service needs and provider staffing requirements.
“We began the RFP process in search of a predictive model that could adjust to population-specific criteria, be calibrated based on area-specific consideration, and incorporate all of the evolving health care trends, such as APP productivity,” noted Shikha Parakh, Director, Corporate Strategy and Planning at Sentara Health. “SullivanCotter’s PNA tool stood out because of the opportunities to flex the model, the ability to look at ‘what-if’ scenarios, and also have the provision of a best-in-class solution. They were the clear winner,” added Parakh.
Strategy Implementation
Sentara utilized fundamental change management principles at the beginning of the PNA implementation process, including creating awareness, establishing accountability, and reinforcing the need for constant dialogue and communication. As part of the related communications toolkit, Sentara provided over 80+ leaders access to data including regional provider needs assessments, service area reports, and specific reports by service line.
Collaborating with SullivanCotter, Sentara created an FAQ document to ensure team members weren’t reviewing reports in a bubble. “We wanted to facilitate a better understanding of the key considerations and illustrate to stakeholders how to leverage the tool’s data best,” said Parakh. “Providing data transparency and an understanding of the methodology inspired a greater amount of trust and buy-in,” Parakh noted.
SullivanCotter’s PNA allowed for robust analysis and straightforward reporting – creating custom reports with only a few clicks. Sentara established a community needs assessment council, including members from the legal and strategy teams, to review and approve all provider recruitment plans.
The Results
PNA gave Sentara the ability to measure demand for specific services in their markets, helping them estimate the number of providers needed in those areas. This information proved invaluable for recruitment, enabling them to develop service line strategies, identify growth opportunities, and determine surplus/deficit areas to plan for the next budget year.
Sentara quickly benefitted from using SullivanCotter’s PNA, particularly noting the ease of downloading data, the visual appeal of the maps, the ability to clearly identify surplus/deficit, and the predictive modeling capability as far as five years out. PNA also provided Sentara with a more strategic view of local market needs by factoring in provider supply in the adjacent geographic areas. Often, collaborating with adjacent market service providers allowed them to fulfill the market need without adding more FTEs. In addition, the predictive modeling allowed Sentara to analyze demographic information to help assess potential retirements and know where succession planning was needed.
Sentara quickly realized numerous benefits, including:
- Financial and operational efficiencies
- Improved decision-making and strategic recruitment
- Effective succession planning
- Increased synchronization between provider teams, strategy teams, and local market operators
“A key aspect of the tool is that the data can be modified, and we can apply qualitative insight to the mathematical model. We aren’t limited to just using the tool to flesh out the information. The provider roster can be updated to keep up with what is happening in each local market, and all of the insights that come with that,” stated Parakh.
PNA’s ability to create robust, custom reports with only a few clicks, makes the analysis and reporting process significantly easier. The ability to measure the demand for services in their markets supports Sentara in efficiently meeting the needs of their communities, resulting in improved patient access. “Using the tool to create strategies, specifically in our rural markets where geographic location is a barrier to care, has resulted in a new service pattern,” shared Parakh.
Post-launch Challenges and Resolution
Despite the overall success of PNA’s launch, Sentara did face a few challenges. As expected, internal adoption and use of a new tool can often be difficult. Sentara realized that additional education was required for the organization to leverage its insights, understand the methodology, and ensure data transparency. To tackle these challenges, Sentara provided ongoing education workshops on compliance regulations and collaborated closely with SullivanCotter for guidance and support.
Key Takeaways for Businesses
The successful launch of SullivanCotter’s PNA tool at Sentara Health offers valuable insights for health care organizations considering a new product launch:
- Employ Change Management Principles: Engage stakeholders through awareness, accountability, and constant communication while introducing the new product.
- Collaboration is Key: Partner with the product creator to allow for greater understanding and ensure use of the product to its full potential.
- Focus on Data-driven Insights: Combine quantitative and qualitative data to drive better decision-making and strategy development.
- Ongoing Education and Support: Ensure all stakeholders can access resources and support throughout the adoption and post-launch stages.
“PNA affords us an overall holistic review, which is critical due to the unique nature of our markets. This enables us to create strategies from both an enterprise standpoint, and a local perspective. Working together through the team site ensures collaboration between the provider team, strategy team, and local market operators to meet market needs effectively and strategically,” noted Parakh.
Sentara Health’s experience highlights the importance of a flexible, data-driven, and innovative approach to successfully completing a robust provider needs assessment and clinical workforce planning process. By leveraging SullivanCotter’s PNA tool, Sentara tackled the challenges of workforce staffing, recruiting, and planning. This enabled them to efficiently adapt their healthcare services to meet the needs of an ever-changing landscape.
“Implementing the SullivanCotter PNA has provided Sentara with the tools and data to understand the supply and demand in our market. The outcome value isn’t just in successfully recruiting a needed provider. It’s also in knowing we are investing wisely in our provider workforce to fulfill short-and long-term needs. This is the first time we’ve had that kind of insight – it is very exciting and has convinced us that this is the future,” remarked Parakh.

Pay Equity: More than an Annual Analysis
There are several statistical methods used to examine pay equity between select groups. However, all attempt to achieve the same ends of controlling for differences between groups when analyzing the compensation between those groups. Thus, if the groups are equivalent in all relevant respects, would they (e.g., men and women) be paid the same?
However, even when a pay equity analysis comes back citing no statistical differences between groups, organizations still must pause to consider if these results reflect a true state of affairs or if inequities are buried deeper within their organizations that an analysis of compensation alone does not reveal. Other fundamental questions need to be asked and answered before the results of a pay equity analysis can be fully embraced as true. We discuss 5 of these questions below, using gender as our example group.
Do men and women separate from the organization at different rates?
If lower-paid women, or those who receive lower counter-offers than men when pursued by competing organizations, exit organizations at a higher rate, then the remaining organizational sample is biased. The sample for the pay equity analysis includes only higher-paid women who have stayed with the organization. Those who have felt unfairly treated have left.
Solution: Test for group differences in organizational exits, examining if compensation is a factor in separations.
Do men and women perform at the same levels?
Equity suggests that those who contribute more should be paid more and vice versa. Thus, for example, a woman who performs at a lower level (e.g., is less productive) should be paid less than a man who performs at a higher level and is paid more. The results of a pay equity study will conclude that is okay. However, if women's performances are lower than men's, we must ask, "Why?" Perhaps performance ratings are biased against women or their true performances are negatively affected by actions that impair performance. For example, women may be provided with fewer resources, developmental opportunities, or mentors.
Solution: Assess performance differences between groups and, where they exist, the reasons for those differences.
Do women get financially penalized for part-time work?
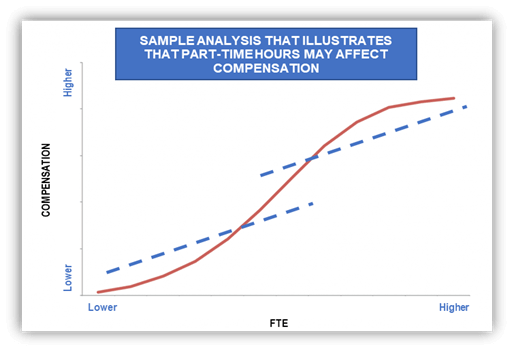
Many more women than men work part-time (or do not work at all) because they remain the family’s primary caretaker for home and children. These facts are reflected in a recent report from the Center for American Progress (The State of Women in the Labor Market in 2023) that shows employment rates of women are 40% lower than that of men when children under the age of 5 are at home. This gap narrows to 5% when no minors are at home. Additionally, the report indicates that women are 5 to 8 times more likely to have their employment prospects disrupted by caregiver responsibilities through reduced hours or by dropping out of the workforce altogether.
The decision to work part-time, in itself, may unduly undermine women’s performance and career prospects. For example, part-time workers may be excluded from training opportunities, important meetings and committees, have less access to critical information and resources, be allotted the most disadvantageous work times, and are often forced to contend with the stigma that they are not serious about their professional lives. Taken together, women who work part-time may be at a profound disadvantage, placing their performance and careers at risk for the good of the family.
Solution: Examine the relative incidence of part-time work by group and whether part-time work adversely affects performance and compensation.
Are men and women promoted at the same rates?
In many organizations, the typical financial progression is upward through salary levels. However, that path may be more difficult and time-consuming for women. In this case, women who have faced long periods of stagnation within a job level may receive incremental pay increases that gradually move them higher and higher within their salary ranges, and consequently appear to be well compensated for their work. The pay of women, therefore, may aptly reflect their extended tenures by being paid highly within their ranges, but this obscures the fact that many women may have been passed over for well-deserved promotions and really should be at a higher job level and receiving greater compensation.
Solution: Investigate time to promotion by group.
Is the market biased against women?
Occupations differentially populated by women sometimes do not get the market recognition these positions are owed: the value of the job to organizations is greater than the market gives credit for. And, yet, pay equity studies in the United States are conducted as if the market perfectly assesses value. For example, one job that is immensely complex and central to the operational excellence in healthcare is the Chief Nursing Officer (85% female ). There has been ample speculation that the market does not fully recognize the import of this position to organizations. Thus, women who are paid to market may be getting less than their true value to the organization, requiring a pay equity analysis that evaluates the worth of jobs independently of the market.
Solution: In addition to the customary benchmarking of positions, evaluate positions independently of the market using standard job criteria and relate those values to current compensation.
These are a few of the more common questions we suggest that organizations ask and answer. The relief experienced when a pay equity study returns favorable outcomes should only offer partial comfort. A deeper, more inquisitive analysis is required to understand if true equity exists and, if it does not, to make meaningful changes so that it can.Download PDF >

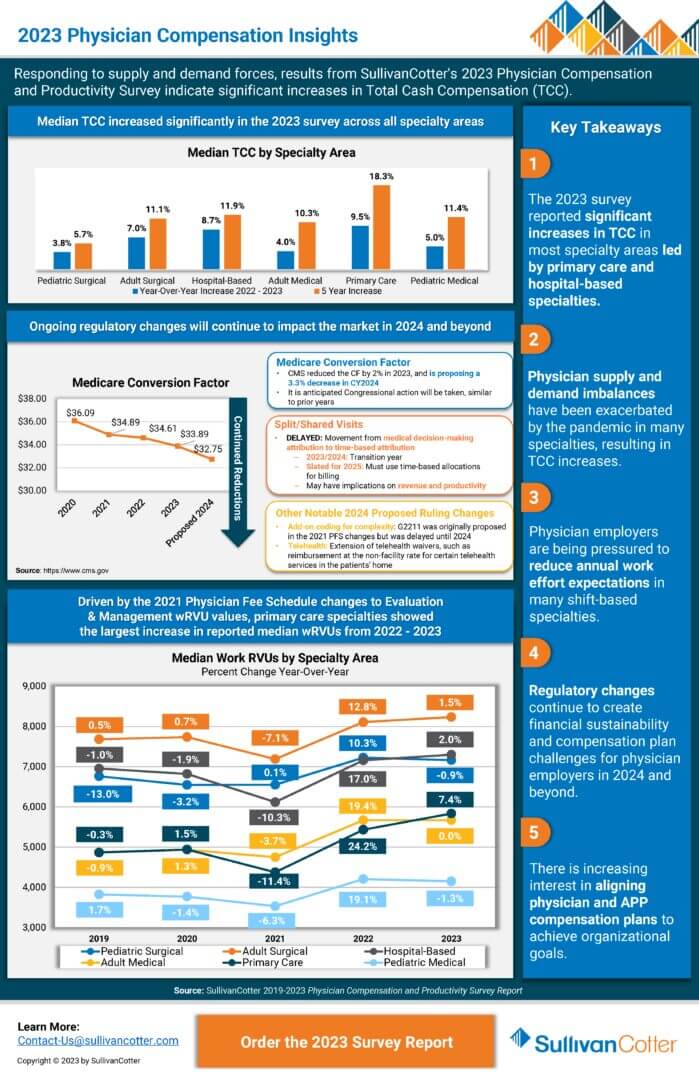
PRESS RELEASE | 2023 Physician Compensation and Productivity Survey
Responding to supply and demand forces, SullivanCotter’s 2023 Physician Compensation and Productivity Survey results indicate significant increases in Total Cash Compensation (TCC).
—
CHICAGO–(BUSINESS WIRE)–SullivanCotter, the nation’s leading independent consulting firm in the assessment and development of total rewards programs, workforce solutions, and data products for health care and not-for-profits, has released its 2023 Physician Compensation and Productivity Survey report.
The report reveals the most significant median total cash compensation (TCC) increases for Primary Care (9.5%) and Hospital-Based (8.7%) specialties, and finds increases across most specialty areas in 2023. With the anticipated shortage of primary care physicians (survey respondents reported the highest percentage turnover in primary care at 8.4%) projected to increase, healthcare organization leaders will confront sustained upward pressure on compensation for these roles moving forward.
SullivanCotter’s data represent the largest and most comprehensive physician compensation resource for health systems and hospitals, with findings reported on more than 306,765 physicians, APPs and PhDs.
Numerous market forces continue to influence health systems’ strategic and operational focus for 2023, many of which are directly impacting the provider workforce. Clinical workforce demand continues to outpace supply, which has been exacerbated by increased turnover and physician burnout and has created upward pressure on compensation. Regulatory changes, including a proposed reduction in the Medicare conversion factor for 2024 and changes to split/shared billing for 2025, continue to create financial sustainability and compensation plan challenges. Finally, in part due to physician supply and demand imbalances, more health care organizations are working to better align physician and advanced practice provider (APP) care delivery models and eliminate potential compensation barriers to team-based care delivery.
“For primary care specialties, the Physician Fee Schedule transition is still impacting physician compensation as compared to last year’s survey results. As for the hospital-based specialties, many of the physician specialties with the most significant reported TCC increases in the 2023 survey were on the front lines in the pandemic, including hospitalists, intensivists, and emergency medicine,” said Dave Hesselink, Managing Principal, SullivanCotter.
The survey also reported that primary care had the largest increase (7.4%) in reported median wRVU productivity from 2022 to 2023. “As primary care patient volumes have rebounded post-pandemic and wRVU values have shifted due to the Physician Fee Schedule changes, this jump in reported wRVU productivity is expected,” Hesselink added. Across all specialty categories, TCC per wRVU rates saw moderate increases over 2022 survey levels with a spike in pediatric surgical rates (8.8%).
The 2023 report showed that base salary and wRVU components continue to be prevalent in primary care, medical, and surgical specialty compensation plans. About 70% of survey participants report using those plan components in their compensation plans, which is consistent with the 2022 survey results. Value-based or quality incentives are used by about 50% of organizations and payments range from 6-8% of TCC for specialists, and 8-9% for primary care, reflecting a slight increase over 2022 survey results which reported ranges of 5-6% and 6-8%, respectively.
Additionally, the prevalence of team-based incentive compensation continued to trend. Similar to the 2022 survey results, approximately one-quarter of organizations (23%) indicated they used team-based incentives in their compensation plans. Of those with team-based incentive compensation, the incentive accounted for 11% of physician TCC, which has been trending upward since 2020 when it was reported at approximately 8%. Just over half of organizations (52%) defined a “team” as including both physicians and advanced practice providers (APPs).
“Increased use of team-based incentive compensation correlates with the growing focus our clients have on population health, care coordination, and positioning APPs to practice at top of license. Now, more than ever, we see organizations evaluating how APPs can most effectively partner with physicians and care teams to deliver high-quality patient care,” said Mark Ryberg, Managing Director and SullivanCotter’s Physician Workforce Practice Leader.
About SullivanCotter
SullivanCotter partners with health care and other not-for-profit organizations to understand what drives performance and improves outcomes through the development and implementation of integrated workforce strategies. Using our time-tested methodologies and industry-leading research and information, we provide data-driven insights, expertise, and data products to help organizations align business strategy and performance objectives – enabling our clients to deliver on their mission, vision, and values.
For more information on SullivanCotter’s surveys, please visit our website at www.sullivancotter.com, or contact us via email or by phone at 888.739.7039.
Note to media: Additional data and interviews are available on request.

INFOGRAPHIC | 2023 Physician Compensation Insights
According to SullivanCotter’s 2023 Physician Compensation and Productivity Survey report, physician supply and demand imbalances have resulted in total cash compensation increases as well as increased pressure on physician employers to reduce annual work effort expectations in many shift-based specialties. Gain additional insights and view key takeaways.
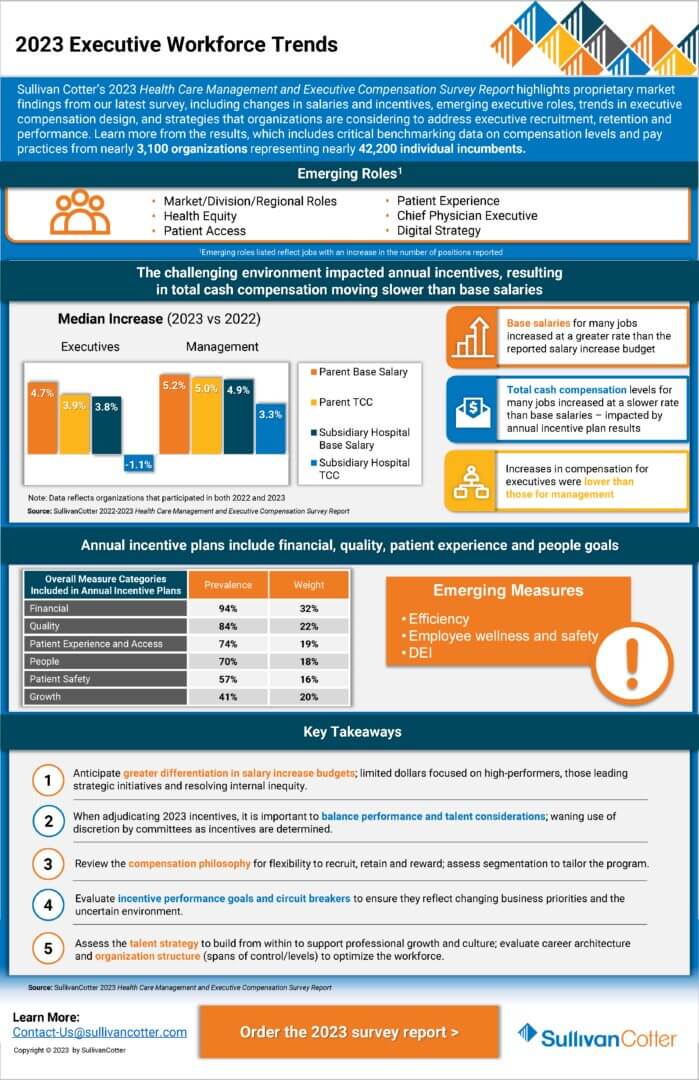
PRESS RELEASE | 2023 Executive Compensation Survey
Health care organizations and boards should continue to balance competitive talent markets with an uncertain performance environment.
—
October 12, 2023 – CHICAGO – SullivanCotter, the nation’s leading independent consulting firm in the assessment and development of total rewards programs, workforce solutions and data products for health care and not-for-profits, has released its 2023 Health Care Management and Executive Compensation Survey report.
Base Salaries
The report details year-over-year changes in median base salaries for healthcare leaders (i.e., salary, merit, across-the-board, market adjustments). This year’s 4.1% increase for all healthcare executives is slightly lower than the 2022 increase (4.3%). The findings represent the largest and most comprehensive resource for hospitals and health systems, surveying more than 3,000 organizations representing roughly 42,160 individual incumbents.
“Health systems have been under pressure to ensure that leaders have the skills needed to address a complex operating environment, including workforce shortages, increased labor, supplies and borrowing costs, and ongoing revenue shortfalls due to service mix changes, access limitations and low volumes,” said Bruce Greenblatt, Executive Workforce Practice Leader, SullivanCotter.
As a result, base salary levels are trending up, as health systems seek to attract, retain and motivate the right leaders in a competitive market. And compensation committees are working to balance the financial, operational, and talent risks as they oversee the executive compensation program.
Incentive Awards
While 2023 salaries increased, incentive awards moderated. Incentive plan payouts were lower for 2022 performance compared to 2021, reflecting a more challenging operating environment and sustained financial headwinds. As a result, the year-over-year increase in 2023 total cash compensation (TCC, equal to base salaries plus annual incentive awards) was lower than the increase in base salaries. While health system executives’ base salaries increased by 4.8%, median TCC levels increased by 3.5%. Median annual incentive payouts for 2022 were moderately below target, compared to payouts that were moderately above target last year. The data showed no significant shifts in annual incentive plan prevalence or award opportunity levels.
“The year-over-year change in TCC was more modest due to a dip in incentive plan payouts in 2022, which reflected more pressures and variability in performance,” said Tom Pavlik, Managing Principal, SullivanCotter. “Incentive plans are working as designed, given the challenges in meeting performance goals.”
Differentiation in Salary Adjustments for Select Roles
Given the increasing complexity of health systems and the focus on integration, health system executive salary increases (4.8% at median) outpaced subsidiary hospital executive salary increases (3.9% at median), continuing a trend observed over the past several years.
Health system positions that noted higher increases in pay (roles with median base salary increases of 5.0% or higher) tended to be those focusing on strategy/planning, technology, financial sustainability and risk, integration, and workforce strategy:
- Top Leadership Roles: Chief Executive Officer, Chief Operating Officer, Chief Financial Officer
- Technology Roles: Chief Information Officer, Top Information Security Executive
- Business/Operating Roles: Top Planning Executive, Top Risk Management Executive, Top Internal Audit Executive
- Workforce Leadership Roles: Chief Human Resources Officer, Diversity, Equity, and Inclusion Officer
Planning for 2024 and Beyond
Health care organizations and their boards should ensure that executive compensation programs and governance are able to adapt to today’s challenging environment. As it relates to compensation and talent strategy, organizations should consider the following:
- Anticipate base salary increase budgets for FY2024 that include both core merit increases (estimated to be 3.0% at median) and market adjustments to retain key contributors and address pay equity issues.
- Focus incentive plan measures and goals on key operating and strategic priorities, including quality of care, efficiency, growth, access, and employee wellness/engagement.
- Differentiate rewards so limited dollars are directed to address retention/recruitment needs and reward high performers critical to the organization’s short and long-term leadership plans; ensure that the compensation philosophy allows for flexibility to differentiate rewards and programs.
- Conduct a risk assessment to determine where there may be potential retention concerns for critical roles; develop an intervention plan to mitigate risks, considering compensation, professional development, and other tactics.
- Focus on internal leadership development and talent-building to help retain and grow the current leadership team – such an approach reinforces the organization’s desired culture and may potentially reduce costs related to external recruitment.
- Regularly review and refine succession plans; memorialize professional development plans; ensure a strong talent pipeline; determine gaps or emerging skills where external hires may be necessary.
- Review the leadership organization structure, to assess if the executive headcount, distribution, and spans of control are optimal; consider if executive leveling criteria should be evaluated to support integration and talent strategy.
- Ensure adequate flexibility to support recruitment, retention, and performance, including using a range of peer groups, tailored competitive positioning based on criticality and performance, and individualized compensation arrangements (including tailored incentives and multi-year retention awards for select individuals).
About SullivanCotter
SullivanCotter partners with health care and other not-for-profit organizations to understand what drives performance and improve outcomes through the development and implementation of integrated workforce strategies. Using our time-tested methodologies and industry-leading research and information, we provide data-driven insights, expertise, and data products to help organizations align business strategy and performance objectives – enabling our clients to deliver on their mission, vision, and values.
For more information on SullivanCotter’s surveys, please visit our website at www.sullivancotter.com or contact us via email or by phone at 888.739.7039.
Note to media: Additional data and interviews are available on request.
FOR IMMEDIATE RELEASE
Contact: Becky Lorentz, SullivanCotter
beckylorentz@sullivancotter.com
314.414.3719
Amy Fisher, Padilla
amy.fisher@padillaco.com
612.805.5707

INFOGRAPHIC | 2023 Executive Workforce Trends
Sullivan Cotter’s 2023 Health Care Management and Executive Compensation Survey Report highlights proprietary market findings from our latest survey, including changes in salaries and incentives, emerging executive roles, trends in executive compensation design, and strategies that organizations are considering to address executive recruitment, retention and performance. Learn more from the results, which include critical benchmarking data on compensation levels and pay practices from nearly 3,100 organizations representing nearly 42,200 individual incumbents.
The 2023 survey report is now available for purchase.

Bridging the Union vs. Non-Union Compensation Gap
Short and Long-term Strategies to Attract and Retain Clinical Talent
Organizations increasingly recognize the need to pay non-union nurses competitively to compete against union members and the broader market. Although this is critical to bridging the gap, flexibility and balance are also important considerations in delivering innovative solutions that meet workforce needs.
In our recent article, “The Presence and Impact of Labor Unions among Health Care Workers,” Cathy Loose, Managing Principal and Employee Workforce Practice Leader at SullivanCotter, offers some short and long-term approaches to creating a competitive rewards program to attract and retain clinical talent.
Fill out the form below to download the full article.

PRESS RELEASE | SullivanCotter Co-Sourcing Services Help Health Care Providers Address Labor Shortage, Add Critical Skills and Optimize HR Resources
September 14, 2023 – MINNEAPOLIS – SullivanCotter, the nation’s leading independent consulting firm in the assessment and development of total rewards programs, workforce solutions, and data products for health care and not-for-profits, has announced its new co-sourcing services, designed to address the health care labor shortage and maintain critical skills needed to keep providers running at peak performance.
This offering allows SullivanCotter clients to access the expert resources of SullivanCotter as an extended version of their internal teams without the associated costs of insourcing. Unlike traditional outsourcing, co-sourcing combines the skills of both internal and external professionals, giving teams external resources that build on and enhance existing internal capabilities.
“Co-sourcing services allow organizations to access expertise as needed in areas we’ve consulted in every day. Our highly flexible services can be customized to meet each client’s unique needs, maximizing the value of their investment,” said Ted Chien, President and CEO of SullivanCotter. “Our goal is to deliver efficient and sustainable solutions that enable our clients to reach their highest potential.”
Health systems nationwide struggle to meet staffing requirements and establish a sustainable pipeline of future talent. Persistently high turnover rates, escalating burnout levels, and an overwhelming demand for patient care that surpasses the available supply are all factors.
“These ongoing challenges impose a substantial burden on HR teams but also open the door to a flexible co-sourcing approach. A lack of proper staffing can result in a lack of focus on critical operational needs, so the importance of finding effective solutions and ensuring consistency and quality in the service delivery cannot be understated,” emphasized Cathy Loose, Practice Leader of Employee Workforce Solutions at SullivanCotter.
Co-sourcing/interim services offered by SullivanCotter include:
Compensation Planning: Review salary structure and model costs, identify areas for improvement and recommend compensation adjustments.
Survey Operations: Facilitate annual benchmarking by managing employee survey submissions, mapping client jobs to appropriate survey matches, auditing/peer reviewing facts, maintaining market-standard compliance and more.
Portfolio Management: Track and administer ongoing changes to survey job profiles, coordinate with survey vendors to ensure successful implementation, and effectively manage multiple survey platforms on the client’s behalf.
Market Analysis: Conduct competitive analysis and compare organizational practices to market benchmarks – including access to SullivanCotter’s proprietary Benchmarks360™ workforce compensation and performance insights platform.
Market Insights: Provide strategic insight on market trends, including annual pay structure movement and merit adjustments.
Job Descriptions: Support documentation needs associated with creating new roles or revisions to existing roles, aiming to market price and evaluate roles upon completion.
Interim Support: Provide strategic support via a dedicated SullivanCotter Consultant to deliver ad-hoc advisory services, train new hires, and provide various operational and tactical compensation services.
SullivanCotter offers additional specialized services tailored to meet client needs through co-sourcing, including essential initiatives such as Pay Equity and developing and maintaining governance structures.
For more information about SullivanCotter co-sourcing, please visit www.sullivancotter.com, or contact us via email or phone at 888.739.7039.
About SullivanCotter
SullivanCotter partners with healthcare and other not-for-profit organizations to understand what drives performance and improve outcomes through the development and implementation of integrated workforce strategies. Using our time-tested methodologies and industry-leading research and information, we provide data-driven insights, expertise, and data products to help organizations align business strategy and performance objectives – enabling our clients to deliver on their mission, vision and values.

Modern Healthcare | 2023 Annual Physician Compensation Article
SullivanCotter featured in Modern Healthcare’s annual physician compensation issue
The latest trends in physician compensation
Physician compensation is on the rise as provider organizations try to attract more doctors in a tight labor environment. The industry is still responding to post-COVID-19 pandemic market dynamics, according to companies that responded to Modern Healthcare’s 2023 Physician Compensation Survey, which analyzes data from nine staffing and consulting firms. As patients return for deferred procedures, burned-out doctors are taking a step back from work and students are rethinking career options, creating supply-demand mismatches.
To recruit more physicians, providers are turning to higher base salaries, in addition to sweetening the deal with signing bonuses or educational opportunities. Productivity remains the largest factor in calculating total compensation, but employers are also incorporating quality metrics, recruiting and consulting.
Featuring data and insights from both SullivanCotter’s 2023 Physician Compensation and Productivity Survey and 2023 Medical Group Compensation and Productivity Survey, Modern Healthcare discusses five trends that emerged from this year’s Physician Compensation Survey.
Looking for additional data and benchmarks?
SullivanCotter recently released its annual Physician Compensation and Productivity Survey Report. For more than 30 years, this survey has been and continues to be the largest and most comprehensive physician compensation survey published. With data reported on over 306,765 physicians, APPs and PhDs, this survey continues to lead the market in all areas – sample sizes, contemporary and emerging pay practices and the number of specialties and position levels surveyed.
Fill out the form below to download full article.

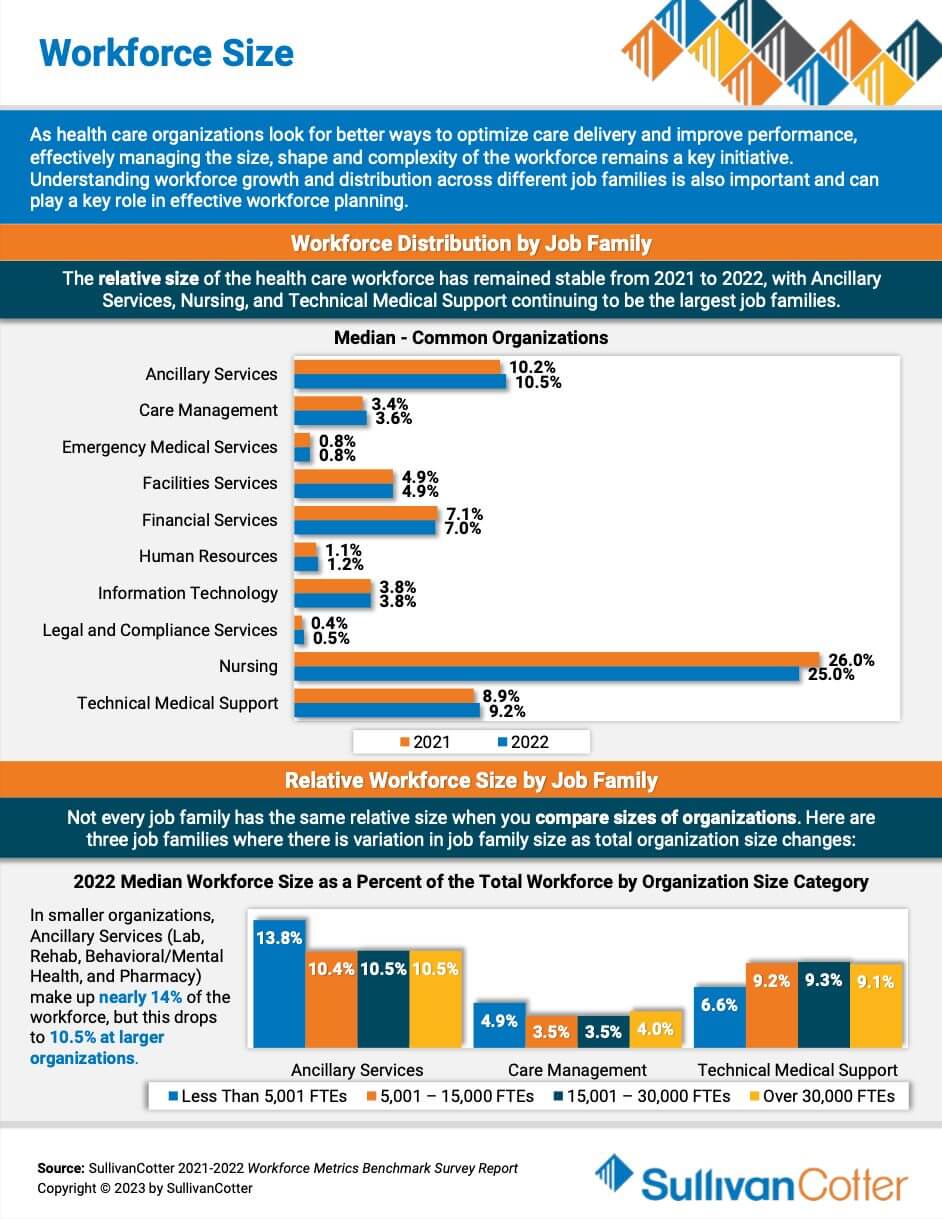
INFOGRAPHIC | Workforce Size
As healthcare organizations look for better ways to optimize care delivery and improve performance, effectively managing the size, shape and complexity of the workforce remains a key initiative. Understanding workforce growth and distribution across different job families is also important and can play a key role in effective workforce planning. Featuring data from SullivanCotter’s Workforce Metrics Benchmark Survey Report, this infographic features insights on workforce size to help your organization navigate healthcare workforce staffing challenges.

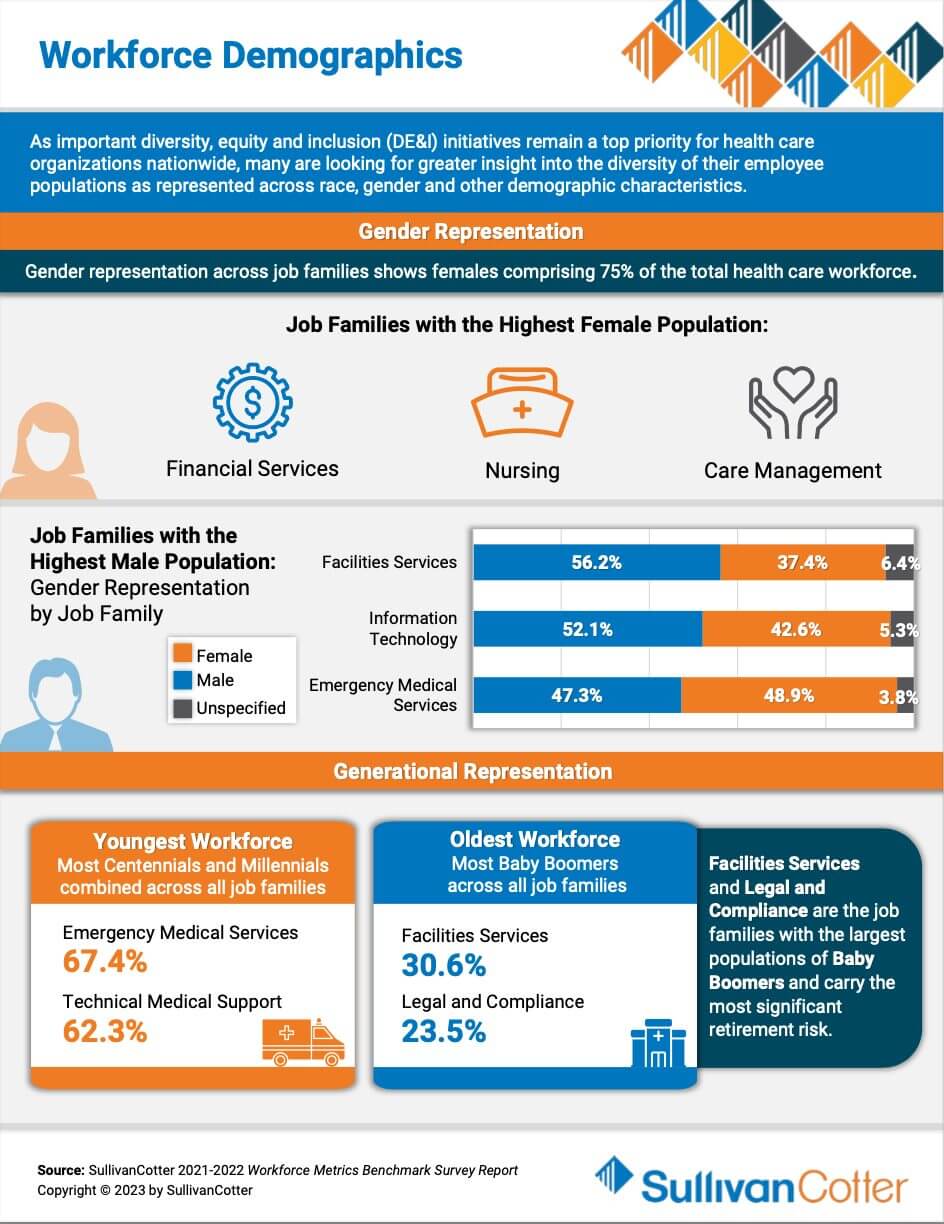
INFOGRAPHIC | Workforce Demographics
As important inclusion and belonging initiatives remain a top priority for healthcare organizations nationwide, many are looking for greater insight into the diversity of their employee populations as represented across race, gender and other demographic characteristics. Featuring data from SullivanCotter’s Workforce Metrics Benchmark Survey Report, this infographic features demographic insights to help your organization navigate healthcare workforce staffing challenges.

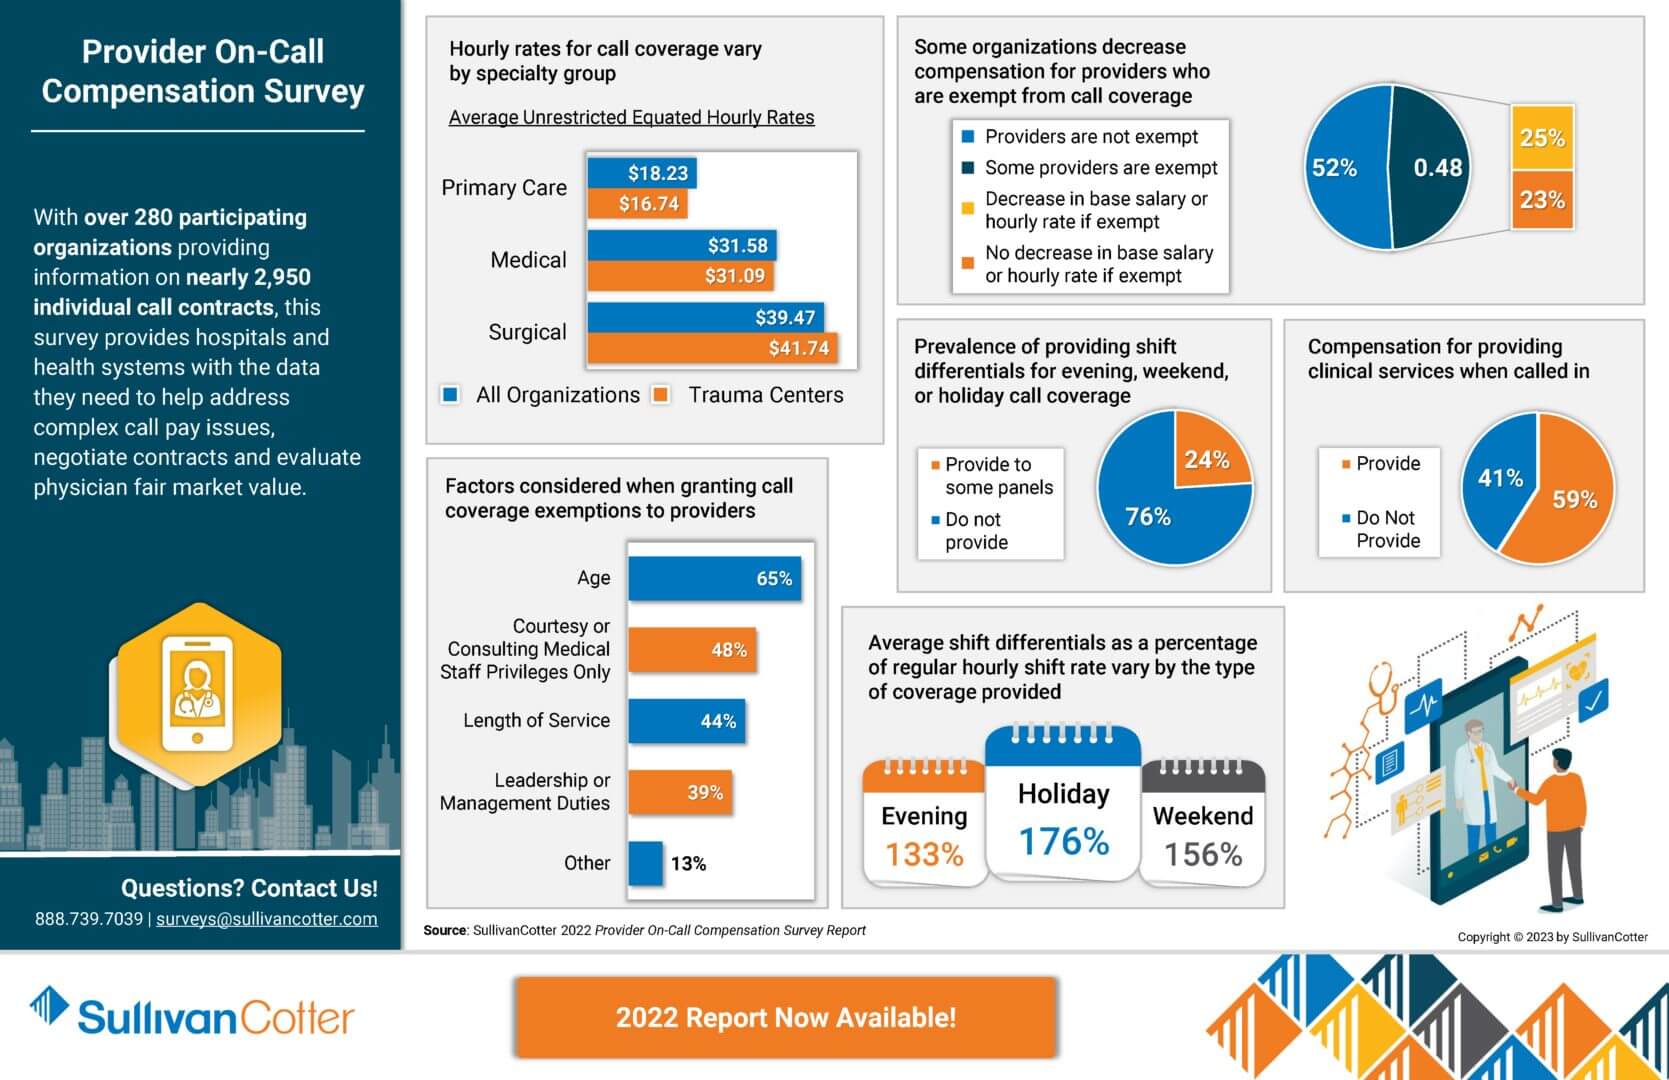
INFOGRAPHIC | 2022 Physician and APP On-Call Compensation Survey
As clinical care settings and practices continue to change in a rapidly evolving health care environment, many organizations are expanding or evaluating their provider on-call programs. Designing effective arrangements to support this demand is critical and starts with gaining access to the right data.
With over 280 participating organizations providing information on nearly 2,950 individual call contracts, the 2022 Provider On-Call Compensation Survey provides hospitals and health systems with the data they need to help address complex call pay issues, negotiate contracts and evaluate physician fair market value.
View highlights from the 2022 results to learn more!
Looking to again access to the latest benchmarks? The 2024 survey is now open for participation!
VIEW INFOGRAPHIC

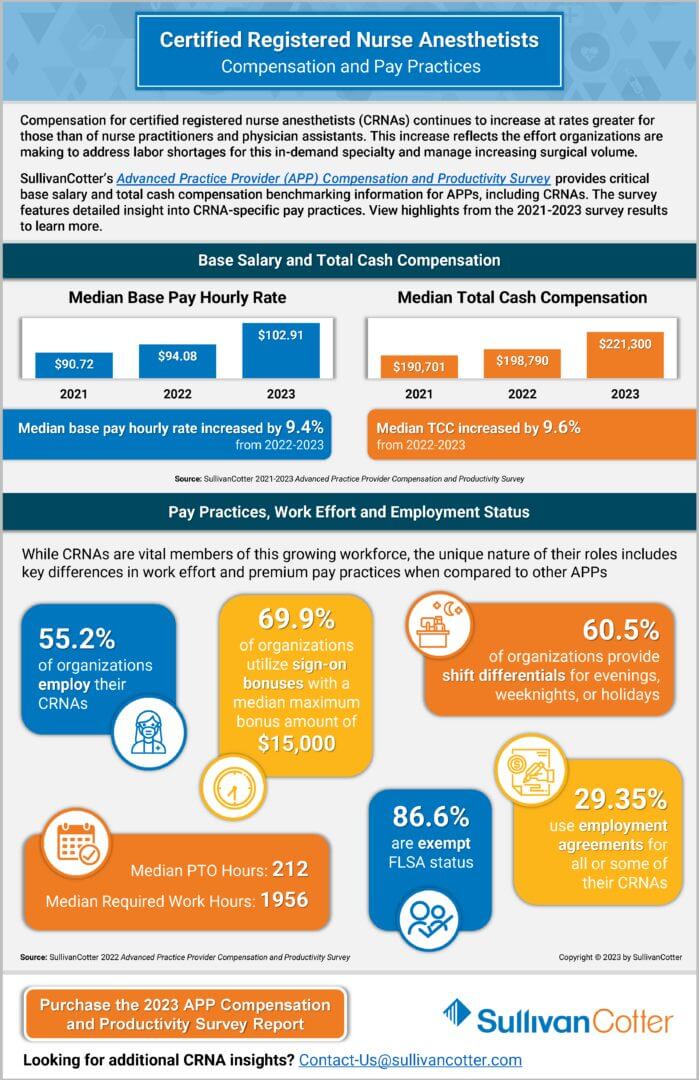
INFOGRAPHIC | 2023 CRNA Compensation and Pay Practices
Compensation for certified registered nurse anesthetists (CRNAs) continues to increase at rates greater for those than of nurse practitioners and physician assistants. This increase reflects the effort organizations are making to address labor shortages for this in-demand specialty and manage increasing surgical volume.
SullivanCotter’s Advanced Practice Provider (APP) Compensation and Productivity Survey provides critical base salary and total cash compensation benchmarking information for APPs, including CRNAs. The survey features detailed insight into CRNA-specific pay practices. View highlights from the 2021-2023 survey results to learn more.
VIEW INFOGRAPHIC

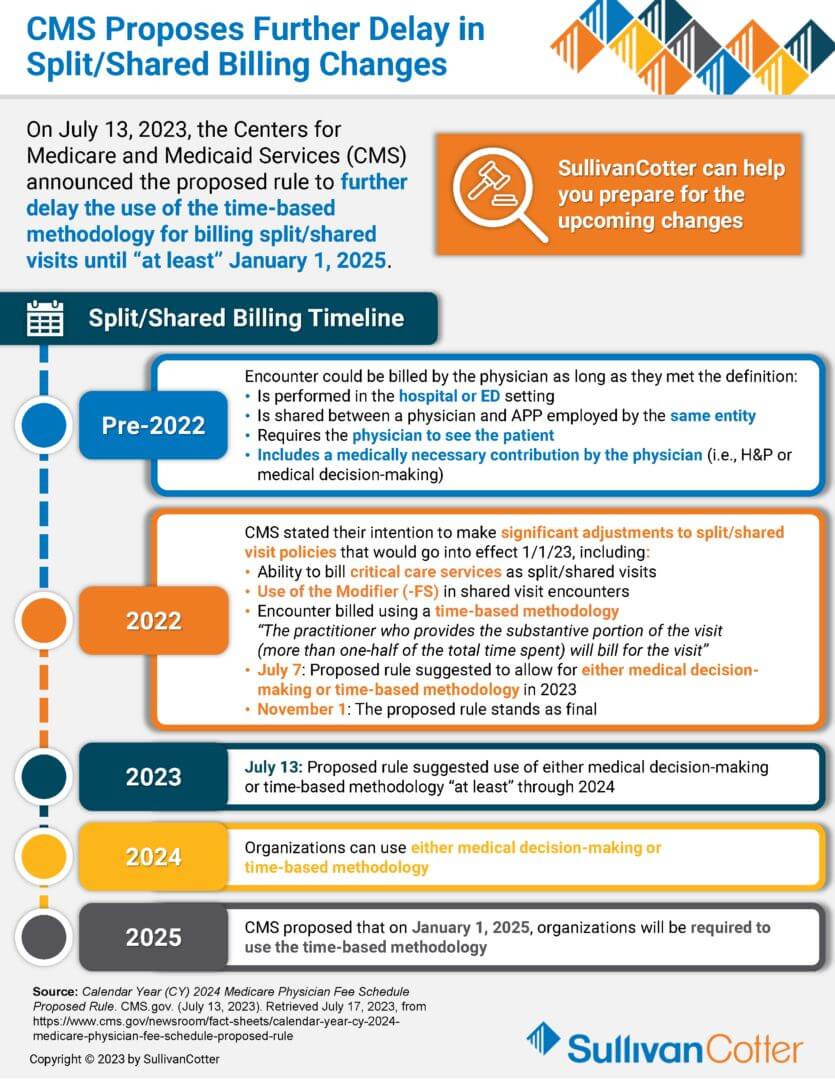
INFOGRAPHIC | CMS Proposes Further Delay in Split/Shared Billing Changes
On July 13, 2023, the Centers for Medical and Medicaid Services (CMS) announced the proposed rule to further delay the use of the time-based methodology for billing split/shared visits until “at least” January 1, 2025. Organizations can use this time to identify the areas most impacted by future changes and find opportunities for improved access and throughput by optimizing the care team.
This insightful infographic provides an overview of the split/shared billing timeline. It also highlights three main focus areas that organizations are looking closely at in order to plan for the pending changes, as well as what challenges should be considered.
The 2023 survey is now open for submission! Register to participate in this year’s survey to gain access to critical compensation market data, information on key employee workforce practices, and insight into emerging industry trends.
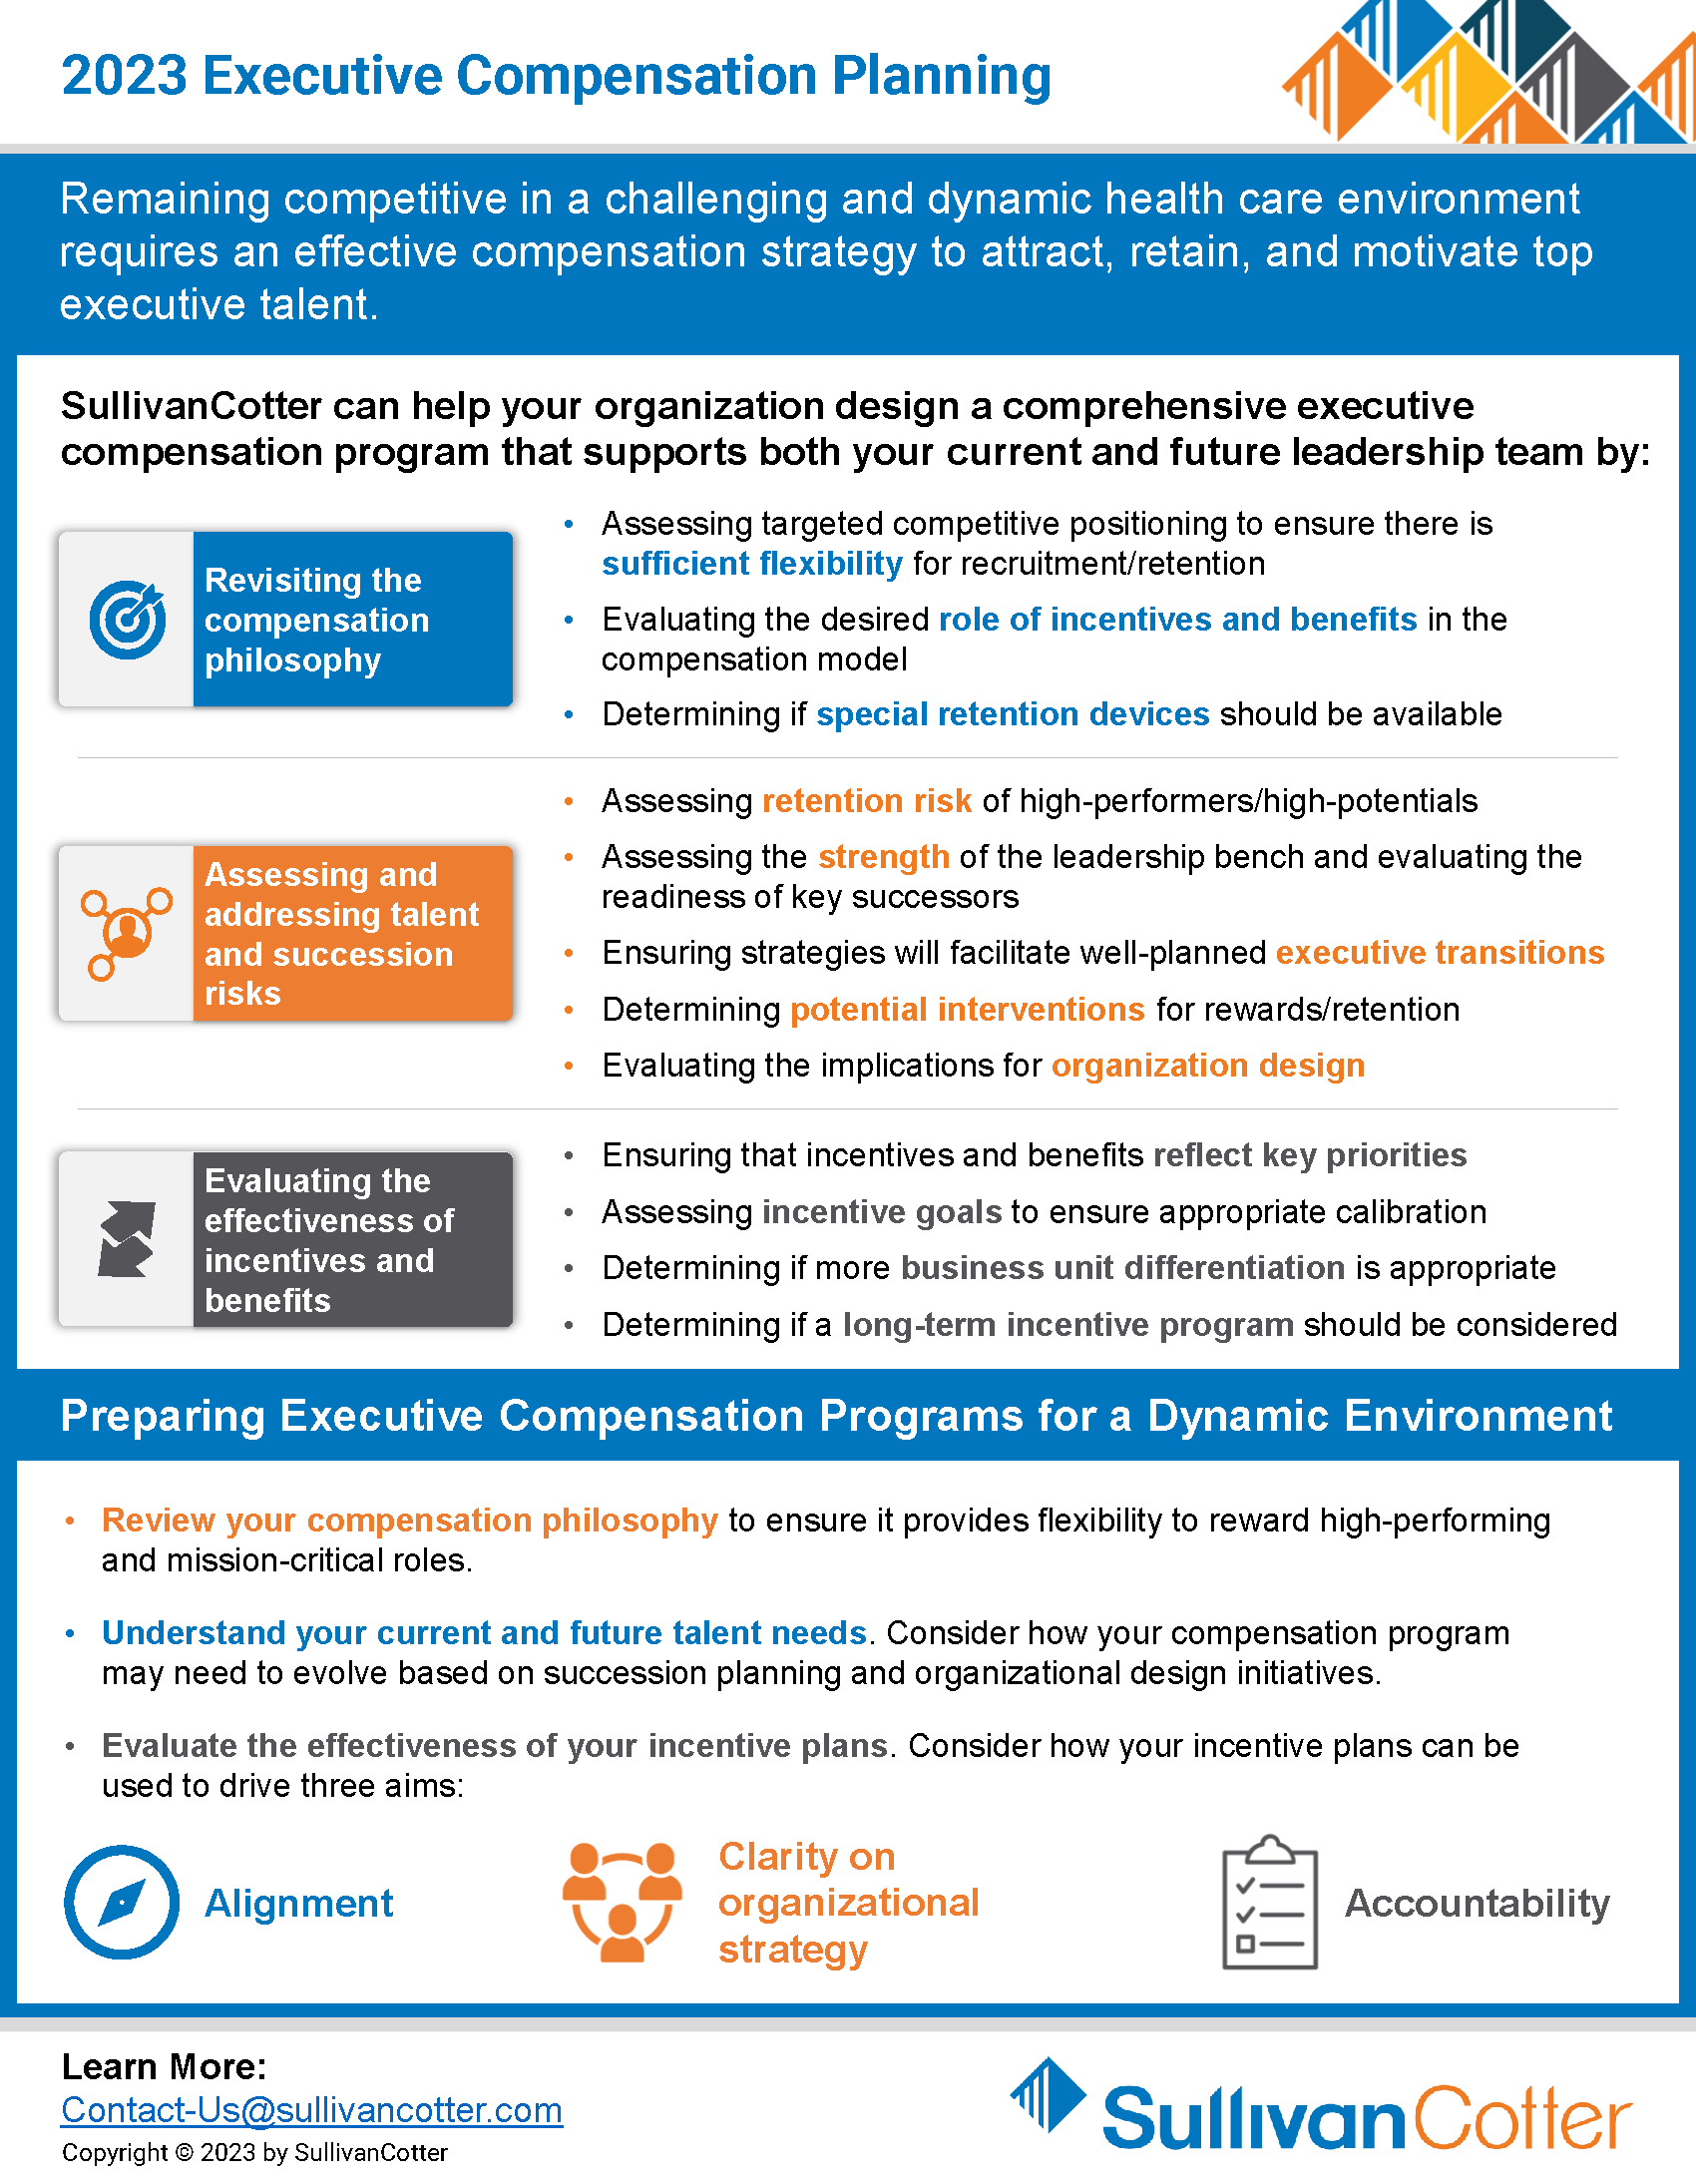
INFOGRAPHIC | 2023 Executive Compensation Planning
SullivanCotter can help your organization design a comprehensive executive compensation program.
Remaining competitive in a challenging and dynamic healthcare environment requires an effective compensation strategy to attract, retain, and motivate top executive talent. Designing a comprehensive executive compensation program can support both your current and future leadership team by:
- Revisiting the compensation philosophy
- Assessing and addressing talent and succession risks
- Evaluating the effectiveness of incentives and benefits
Interested in learning more?
VIEW INFOGRAPHIC

Executive Compensation and Governance Considerations for Health Systems
Priorities for health systems and compensation committees for 2023 and beyond
READ FULL ARTICLE
Faced with increasing financial pressure, growing demand for executive talent, rising pay levels, and intense scrutiny of executive compensation within not-for-profit health systems, compensation committees are delicately balancing financial, operational, talent, and governance risks in their executive compensation programs in this difficult environment.
Featured in The Governance Institute’s July E-briefings, Bruce Greenblatt, Managing Director, SullivanCotter discusses four key priorities compensation committees should consider to ensure their recruitment, retention and rewards objectives are met.
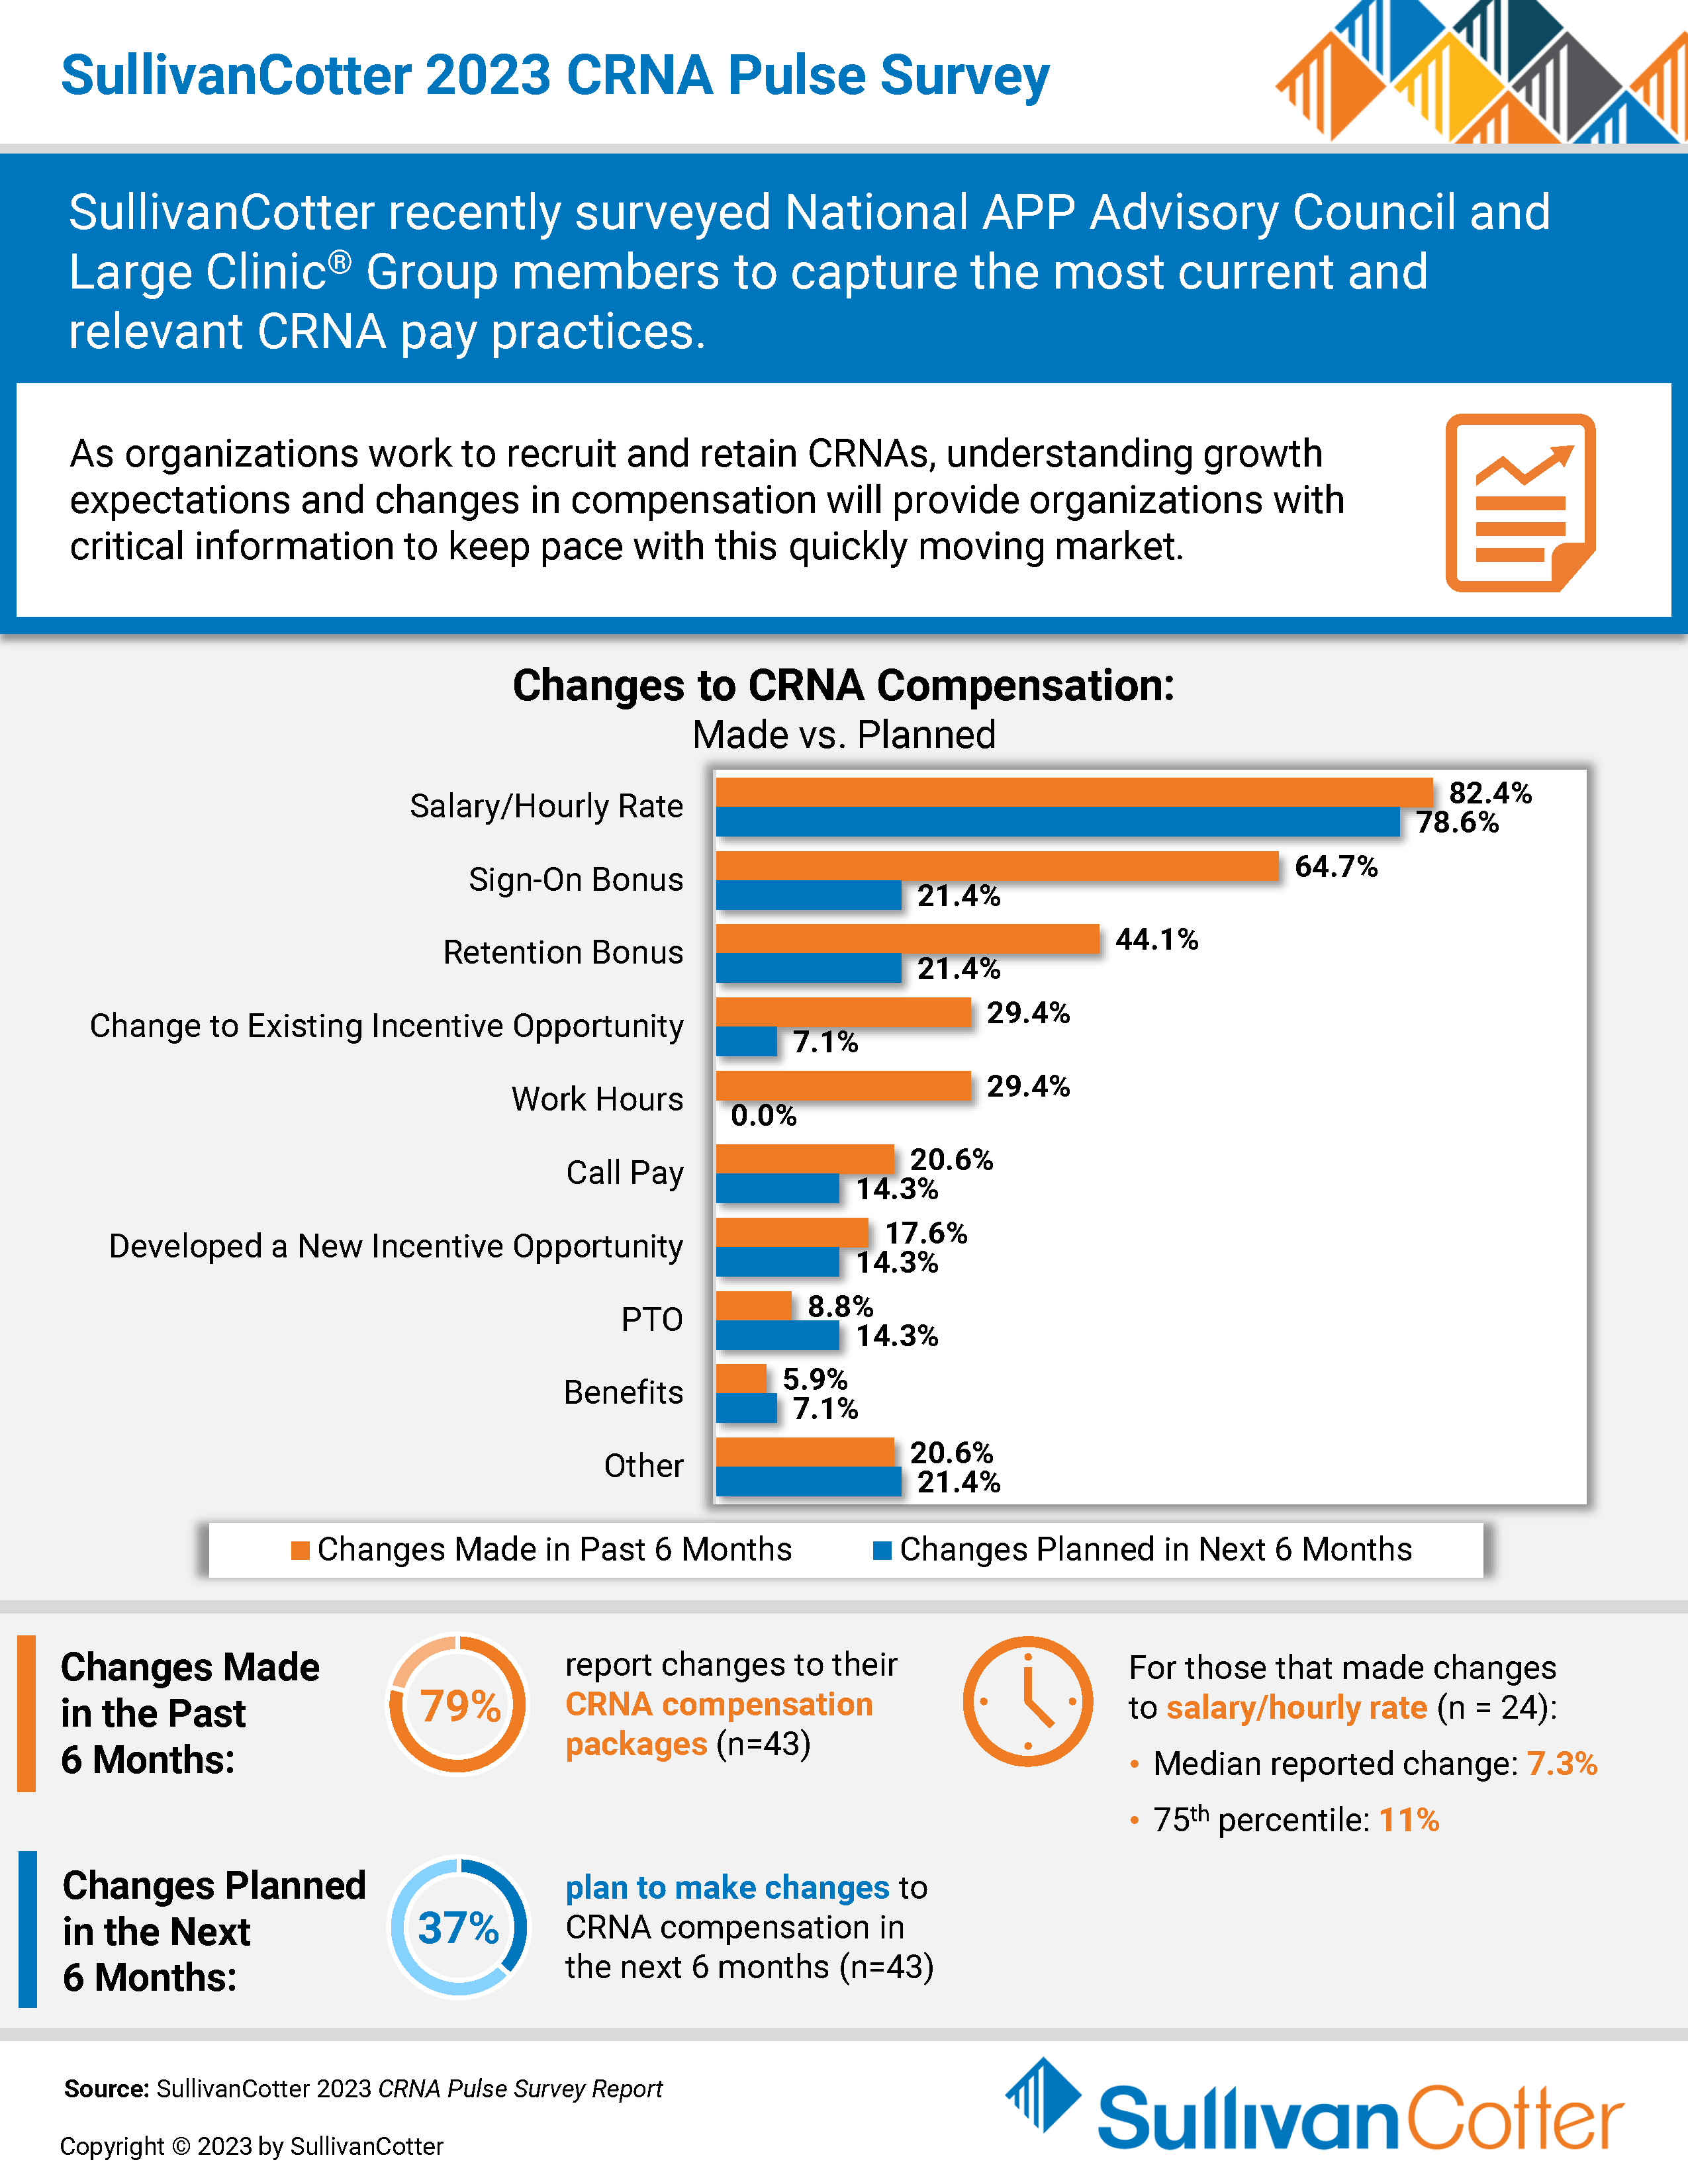
INFOGRAPHIC | 2023 CRNA Pulse Survey
SullivanCotter recently surveyed National APP Advisory Council and Large Clinic® Group members to capture the most current and relevant CRNA pay practices.
As organizations work to recruit and retain CRNAs, understanding growth expectations and changes in compensation will provide organizations with critical information to keep pace with this quickly moving market.
VIEW INFOGRAPHIC

Modern Healthcare | The Latest Trends in Executive Compensation
SullivanCotter featured in Modern Healthcare’s annual executive compensation issue
READ FULL ARTICLE
As hospitals and health systems continue to navigate a constricted labor market and challenging economic environment, they must also focus on recruiting and retaining executive-level leaders with the right mix of skills to oversee increasingly complex organizations.
Featuring data and insights from SullivanCotter, Modern Healthcare's annual executive compensation article explores the latest trends that healthcare organizations should consider.