
INFOGRAPHIC | 2024 Health Care Staff Compensation Survey
The data is in!
Dive deeper into the latest survey results.
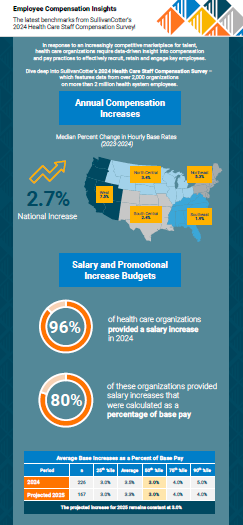
In response to an increasingly competitive marketplace for talent, health care organizations require data-driven insight into compensation and pay practices to effectively recruit, retain, and engage key employees.
Equip your health care organization with the latest insight into employee compensation and pay practices! SullivanCotter’s Health Care Staff Compensation Survey includes data from over 2,000 organizations on more than 2 million employees.
Results show that median percent changes in base hourly rates for all employees increase by 2.7%. This varies by region with growth highest in the West (7.5%) and Northeast (5.3%) and lowest in the Southeast (1.9%).
Download our infographic – which features highlights from the latest survey report – to learn more about annual compensation increases, salary increase budgets, salary structure adjustments, and projections as organizations move into 2025.
Looking for more? Purchase the 2024 report for deeper insight!

Press Release | Unprecedented competition for APPs driving increases in compensation
Median total cash compensation for advanced practice providers continues to increase across all specialty categories
October 23, 2024 – CHICAGO – SullivanCotter, the nation’s leading independent consulting firm in the assessment and development of total rewards programs, workforce solutions, and data products for health care and not-for-profits, has released its 2024 Advanced Practice Provider Compensation and Productivity Survey Report.
With the advanced practice provider (APP) workforce in high demand, median total cash compensation (TCC) continues to grow across all specialty categories. The 2024 results show the highest year-over-year increases for Surgical specialties at 6.0%. While Primary Care (5.7%) and Medical specialties (5.5%) follow closely behind, the report indicates more modest growth for Hospital-Based specialties at 3.7%. Base hourly rates for each category have followed a similar and steady growth trajectory.
When looking back even further, the data reflects ongoing competition for APPs in a tight market for talent. From 2021-2024, median TCC for nurse practitioners and physician assistants combined has risen a sizable 17% for Primary Care, 15% for Surgical, and 14% for both Medical and Hospital-Based specialties. TCC has grown even more rapidly for CRNAs and CAAs and has increased by approximately 22% in the past three years.
“For most health systems, the demand for care is at an all-time high while the industry is simultaneously facing labor shortages. The competition for APP talent is unprecedented and is placing upward pressure on compensation as organizations look to bridge the gap between higher patient volumes and limited access to care,” said Zachary Hartsell, APP Workforce Practice Leader, SullivanCotter.
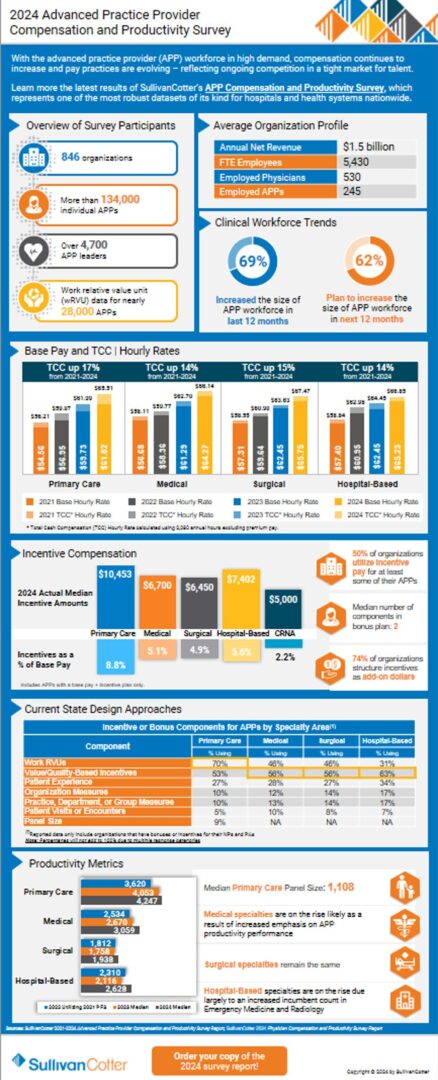
In addition to higher salaries, organizations are also utilizing bonuses to aid in APP recruitment and retention as they move forward in a post-pandemic environment. Since 2022, the prevalence of sign-on bonuses has increased from 74% to 82% while the prevalence of retention bonuses has increased from 44% to 50%. Incentive compensation is evolving as well – especially in Primary Care settings. The 2024 survey reports that 50% of organizations utilize incentive pay for at least some of their APPs, with 74% of these organizations structuring incentives as add-on dollars rather than at-risk compensation.
As in prior years, many health care organizations remain focused on addressing turnover and burnout as an additional way to stabilize their APP workforce. This often includes a re-evaluation of work effort, scheduling burden, and premium pay practices. In 2024, average external (11%) and internal (6%) turnover rates were both down 1% from 2023. “With the direct cost of turnover estimated to exceed $120,000 per person, a reduction in turnover can have a significant financial impact on an organization – especially one with a sizable APP workforce,” added Hartsell.
Additionally, many organizations are looking to have greater consistency in APP leadership leveling, compensation, and administrative time. SullivanCotter reported four levels of APP leader compensation data including clinical-level, management-level, head of advanced practice, and top APP executive. SullivanCotter research has shown that the presence of an APP leader is associated with 2% less turnover and a positive but not statistically significant increase in APP productivity.
SullivanCotter’s 2024 Advanced Practice Provider Compensation and Productivity Survey provides critical benchmarking data on compensation levels and pay practices. As one of the most comprehensive resources of its kind for hospitals and health systems nationwide, the survey includes information from nearly 850 organizations representing more than 134,000 individual APPs and over 4,700 APP leaders.
About SullivanCotter
SullivanCotter partners with health care and other not-for-profit organizations to understand what drives performance and improves outcomes through the development and implementation of integrated workforce strategies. Using our time-tested methodologies and industry-leading research and information, we provide data-driven insights, expertise, and data products to help organizations align business strategy and performance objectives – enabling our clients to deliver on their mission, vision, and values.
For more information on SullivanCotter’s surveys, please visit our website at www.sullivancotter.com, or contact us via email or by phone at 888.739.7039.

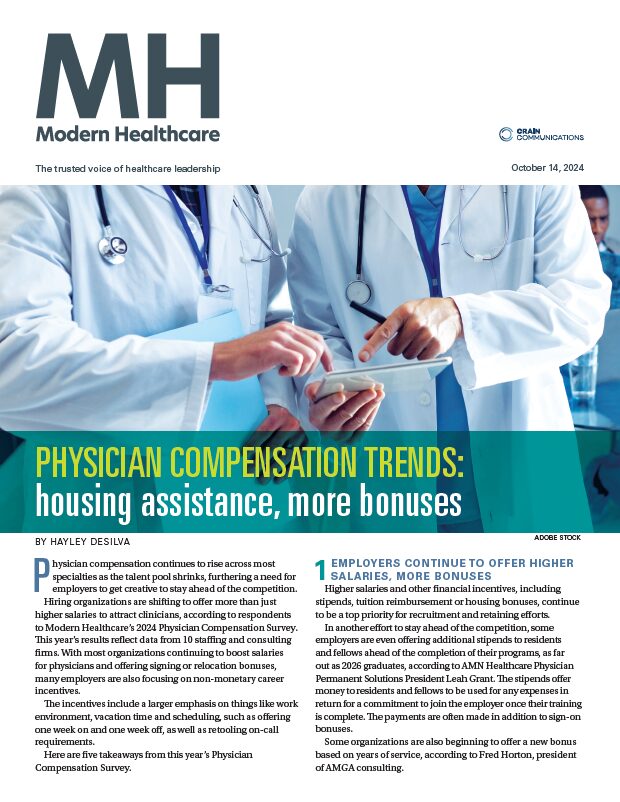
Modern Healthcare | Physician Compensation Trends: Housing Assistance, More Bonuses
Featuring data and insights from our 2024 Physician Compensation and Productivity Survey.
Health care organizations are getting creative as physician compensation increases amidst ongoing staffing shortages.
SullivanCotter’s Dave Hesselink recently sat down with Modern Healthcare to discuss how hospitals and health systems are addressing recruitment and retention challenges. Beyond increasing base salary, many are offering sign-on or relocation bonuses as well as focusing on other non-monetary incentives such as reduced workloads, less call burden, remote work options in some settings, and more.
Modern Healthcare dives deep into the data from 10 staffing and consulting firms to outline the top 5 trends in physician compensation:
- Employers continue to offer higher salaries, more bonuses
- But money isn’t everything…
- Physicians shift away from practice ownership as private equity grows
- Challenges in recruiting specialists continue
- Pushback grows against pay scales based on productivity

Press Release | Health Care Executive Pay Increases Reflect Competitive Talent Market
Year-over-year increases in median total cash compensation outpaced growth in base salaries
October 17, 2024 – CHICAGO – SullivanCotter, the nation’s leading independent consulting firm in the assessment and development of total rewards programs, workforce solutions, and data products for health care and not-for-profits, has released the results from its 2024 Health Care Management and Executive Compensation Survey. This includes data from nearly 3,300 organizations representing more than 45,000 incumbent managers and executives – making it one of the industry’s most comprehensive compensation benchmarking resources for this workforce.
Base Salaries
The report details year-over-year changes in median base salaries – including across-the-board, merit, and market adjustments – for health care leaders. This year’s 4.6% increase for all executives is on par with the 4.4% growth seen in 2023. As has been the case for the past several years due to the increasing complexity of operations, organization size, and scope of responsibility, median increases for executives at the system level (5.2%) continue to outpace those for executives at subsidiary hospitals (3.5%).
“The industry is experiencing a critical gap in expertise as operations grow more complex and leaders retire or continue to step away. The pool of qualified executive talent is increasingly limited, and this is placing upward pressure on total compensation – particularly via higher base salaries,” said Bruce Greenblatt, Executive Workforce Practice Leader, SullivanCotter.
Health system positions with median base salary increases of 5.0% or greater tend to be those focusing on business strategy, information technology and security, integration, care delivery excellence and legal/regulatory compliance:
-
- Top Leadership Roles: Chief Executive Officer, Chief Administrative Officer
- Information/Digital Technology and Strategy Roles: Top Information Security Executive, Chief Strategy Officer, Top Population Health Executive, Top Managed Care Executive
- Business/Operating Roles: Top Professional Services Executive, Top Quality Executive (Non-MD)
- Regulatory/Compliance Roles: Top Legal Services Executive, Top Compliance Executive, Top Internal Audit Executive
Despite some improvements in operating margin performance, health systems continue to confront several challenges. Pressures such as ever-increasing labor costs combined with a tight market for talent, high inflation, and threats to cybersecurity are ongoing. The demand for skilled executive talent remains high given the complexity of managing care in the current climate, and the heightened scrutiny and regulatory activity surrounding executive compensation is affecting how compensation committees achieve balance across financial, operational and talent risks.
Incentive Awards
Incentive awards were greater for 2023 performance as compared with 2022, reflecting an overall improvement in the operating environment. As a result, total cash compensation (TCC, equal to base salary + annual incentives) increased at a higher rate than base salaries in 2024. Median TCC for system-level executives increased by 8.3% while their base salaries rose by 5.2%. This trend is the same for subsidiary hospital executives as incentive awards were achieved at or near target levels.
Median annual incentive payouts for 2023 performance were closer to target than those provided for 2022 performance, when they were moderately below target. Given that there were no shifts in annual incentive plan prevalence or award opportunity levels, year-over-year changes in TCC can be attributed to higher levels of performance.
“Although performance is improving year-over-year and payouts approximate target, we still saw about half of organizations change their annual incentive plans for the 2024 fiscal year. This included a refined approach to goal calibration and increased weighting of financial and system-wide performance metrics – highlighting the need to focus on financial sustainability, integration, and refined care delivery models to move forward in a post-COVID environment,” said Tom Pavlik, Managing Principal, SullivanCotter.
Planning for 2025 and Beyond
While cautiously optimistic, each organization is managing circumstances unique to their region, market segment, operating model and current stage of post-pandemic recovery. Health systems and their boards should consider the following as they weigh future actions:
-
- Prepare for a competitive talent market by anticipating the need to provide more robust compensation offers for external recruits and market adjustments to current leaders who are critical and in demand.
- Review and update executive compensation programs to meet evolving needs by differentiating competitive pay positioning based on role criticality, impact, and performance and ensuring peer groups represent the most relevant talent markets (even those outside of health care). For incentive compensation, it’s important to assess these plans in the context of the organization’s near and long-term strategy when setting performance metrics and objectives to ensure ongoing effectiveness.
- Prioritize the talent strategy by defining a clear process for assessing and developing leadership and ensuring that action plans (including compensation adjustments where needed) are in place to retain high-risk executives.
- Optimize the leadership structure and career architecture by evaluating headcount, distribution, span of control, and more to enhance overall efficiency. Refining executive job titles and leveling guidelines enables organizations to align leadership positions with the appropriate rewards structure, performance management programs, and career progression pathways.
About SullivanCotter
SullivanCotter partners with health care and other not-for-profit organizations to understand what drives performance and improves outcomes through the development and implementation of integrated workforce strategies. Using our time-tested methodologies and industry-leading research and information, we provide data-driven insights, expertise, and data products to help organizations align business strategy and performance objectives – enabling our clients to deliver on their mission, vision, and values.
For more information on SullivanCotter’s surveys, please visit our website at www.sullivancotter.com or contact us via email or by phone at 888.739.7039.
Note to media: Additional data and interviews are available on request.

INFOGRAPHIC | 2024 APP Compensation and Productivity Survey
Dive deeper into the latest survey results!
The competition for APP talent is unprecedented and is placing upward pressure on compensation as organizations look to bridge the gap between higher patient volumes and limited access to care.
With the advanced practice provider (APP) workforce in high demand, compensation continues to increase and pay practices are evolving – reflecting ongoing competition in a tight market for talent.
Learn more from the latest results of SullivanCotter’s Advanced Practice Provider Compensation and Productivity Survey, which represents one of the most robust datasets of its kind for hospitals and health systems nationwide. This year’s report includes data from nearly 850 organizations on more than 134,000 individual APPs and 4,700 APP leaders.
Median total cash compensation continues to grow across all major specialty categories. The 2024 results show the highest year-over-year increases for Surgical specialties at 6.0%. While Primary Care (5.7%) and Medical specialties (5.5%) follow closely behind, the report indicates more modest growth for Hospital-Based specialties at 3.7%. Base hourly rates for each category have followed a similar and steady growth trajectory.
Download our infographic – which features highlights from the latest survey report – to learn more about annual changes in compensation, wRVU productivity, incentive compensation and more.
Looking for more?
- Purchase the 2024 report for deeper insight
- Register to participate in the 2025 survey to receive exclusive pricing and benefits

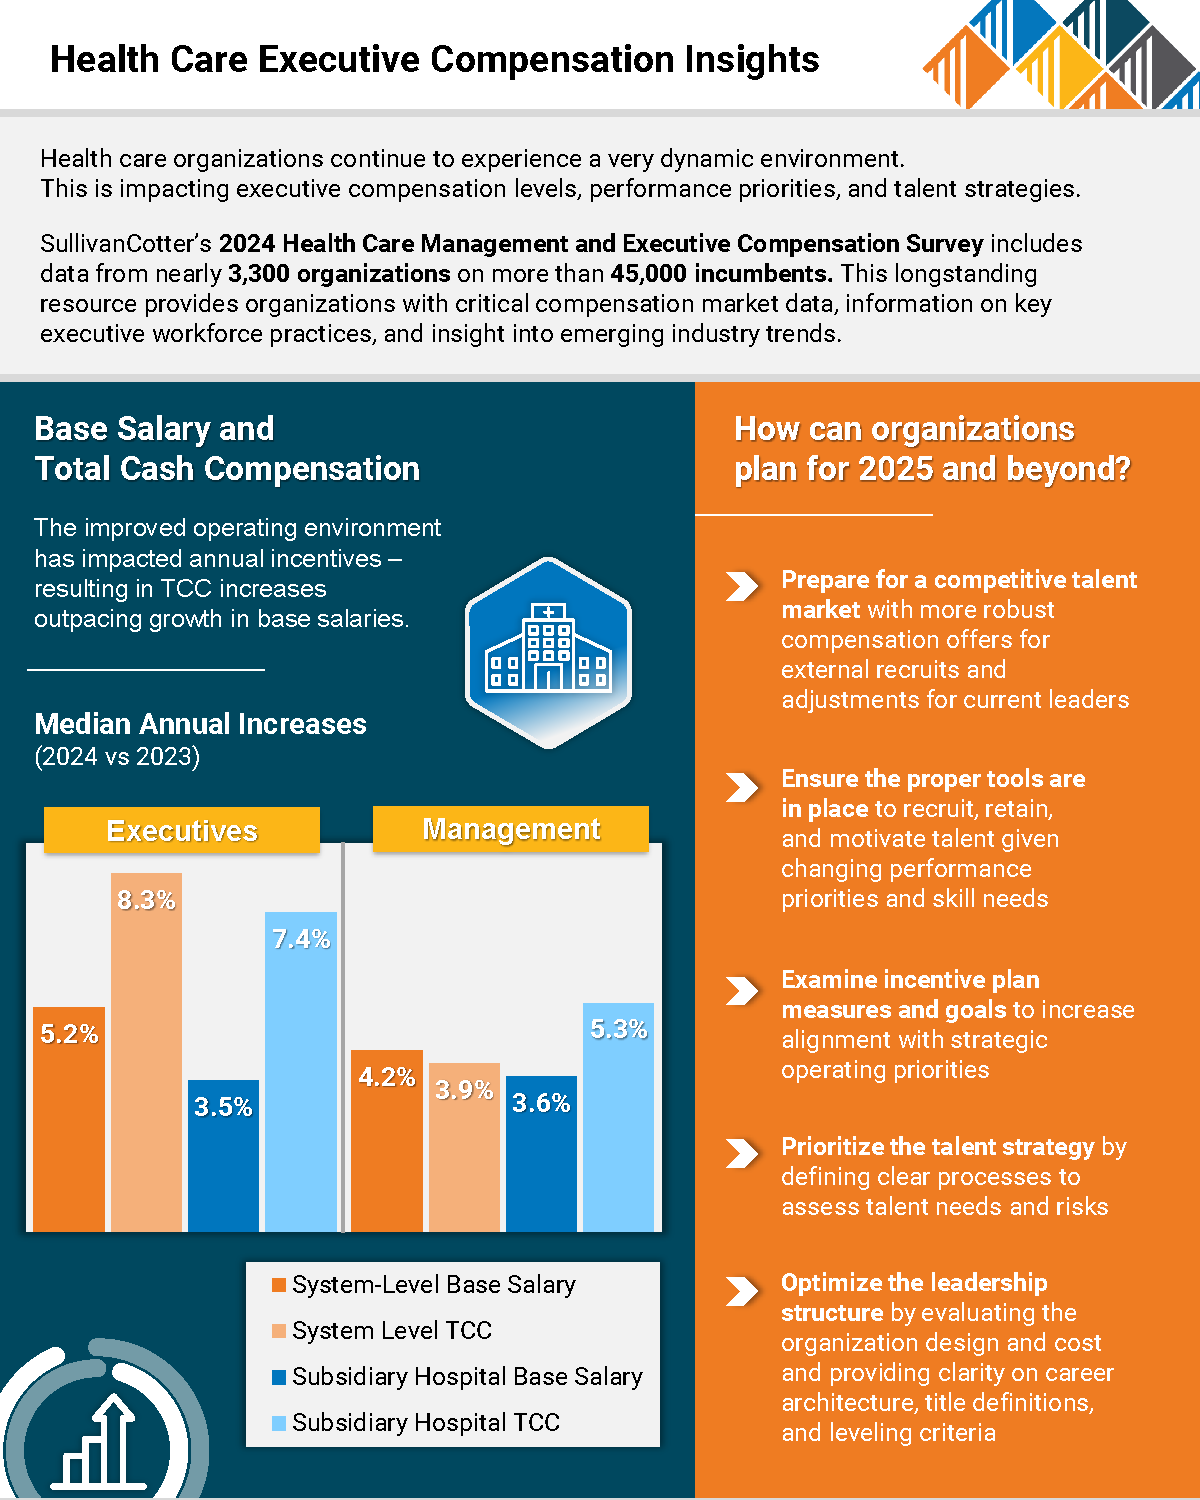
INFOGRAPHIC | 2024 Health Care Management and Executive Compensation Survey
Brand new data and benchmarks!
In 2024, year-over-year changes in total cash compensation have outpaced increases in base salaries.
Health care organizations continue to experience a very dynamic environment. This is impacting executive compensation levels, performance priorities, and talent strategies. Pressures such as ever-increasing labor costs, a tight talent market, high inflation, and cybersecurity threats are ongoing. Paired with a limited pool of qualified executive talent, these obstacles are placing upward pressure on compensation.
SullivanCotter’s 2024 Health Care Management and Executive Compensation Survey includes data from nearly 3,300 organizations on more than 45,000 incumbents. This longstanding resource provides organizations with critical compensation market data, information on key executive workforce practices, and insight into emerging industry trends.
Results show that median total cash compensation for system-level executives increased by 8.3% while base salaries grew by 5.2%. This trend is the same for subsidiary hospital executives and can be attributed to higher levels of incentive plan performance.
Download our infographic – which features highlights from the latest survey report – to learn more about annual changes in compensation, incentive plan provisions, and emerging or in-demand roles!
Looking for more? Purchase the 2024 report for deeper insight!
Press Release | Increases in Physician Compensation Return to Historical Annual Growth Levels
SullivanCotter’s latest survey report highlights how annual changes in physician total cash compensation were largely driven by increases in productivity
October 10, 2024 – CHICAGO – SullivanCotter, the nation’s leading independent consulting firm in the assessment and development of total rewards programs, workforce solutions, and data products for health care and not-for-profits, has released new data and benchmarks from the 2024 Physician Compensation and Productivity Survey.
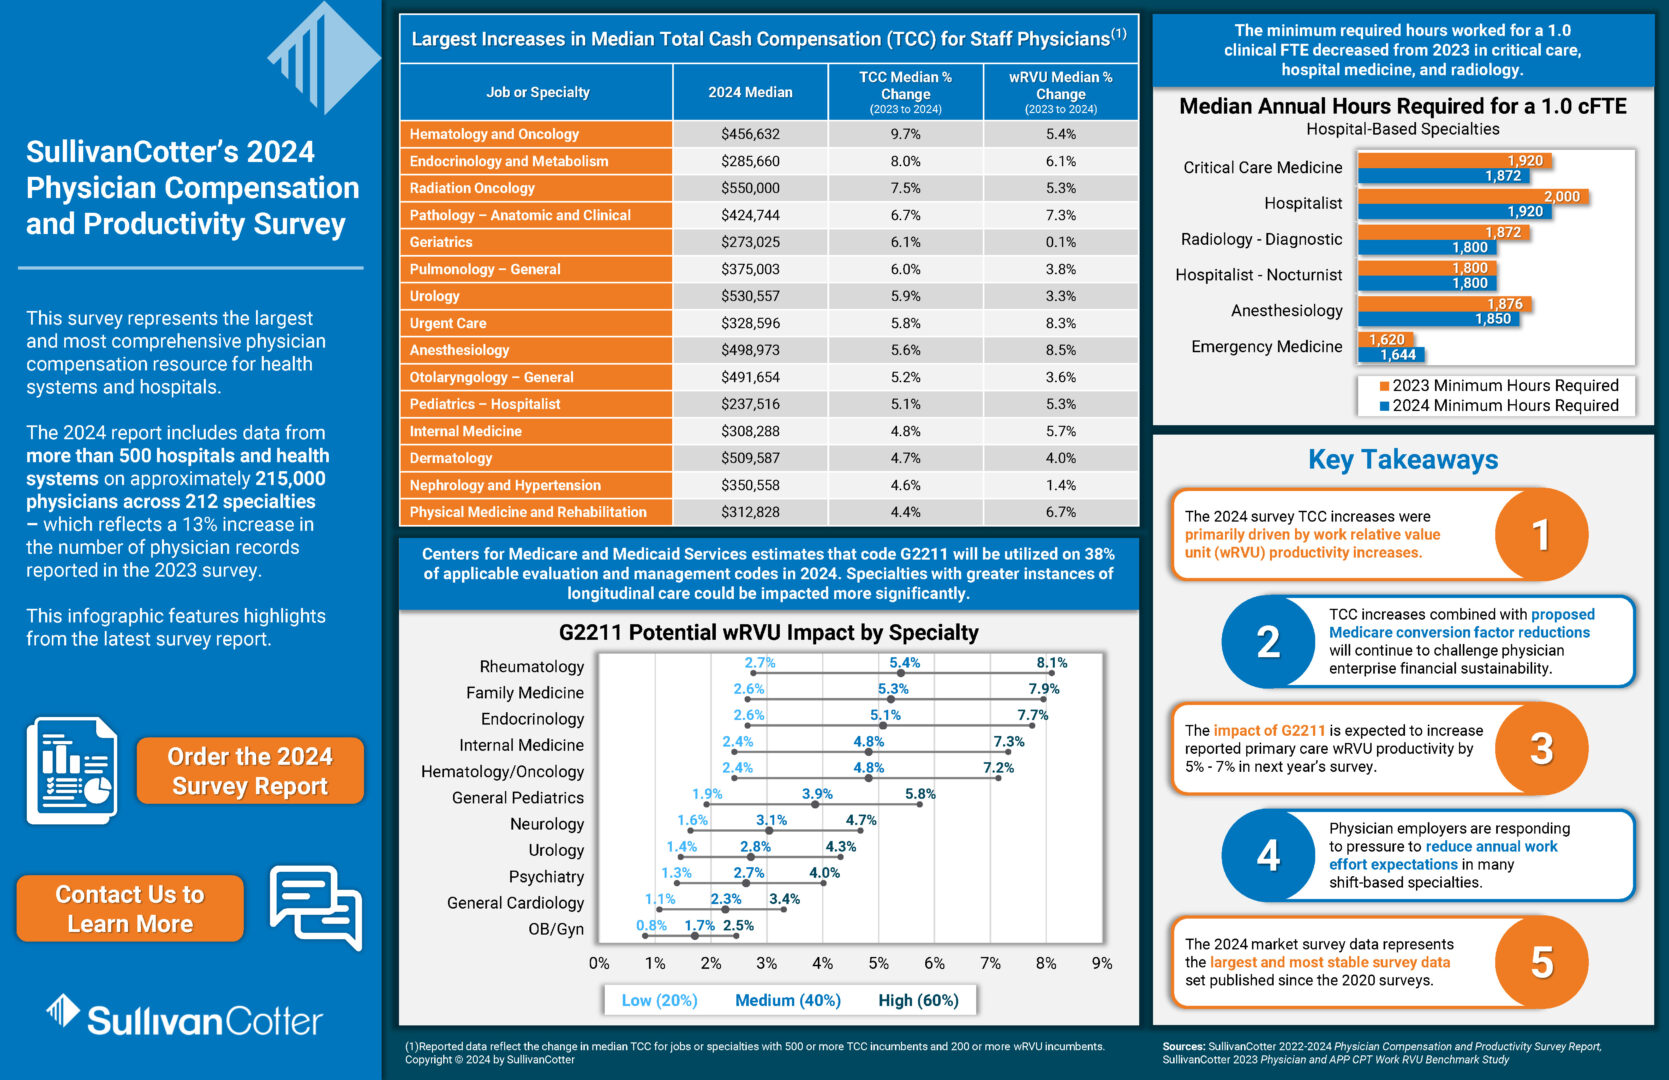
Although median total cash compensation (TCC) continues to increase year-over-year across all major specialty categories, it has returned to historical average growth of 3.5% following significant increases in 2023. This year, the Adult Medical and Pediatric Surgical specialty categories saw the greatest increases at 4.5% and 4.4% respectively. However, over the last five years encompassing the COVID-19 pandemic and significant changes to the Medicare Physician Fee Schedule (MPFS) in 2021 and 2023, primary care physicians have seen significantly larger compensation increases than other specialty categories at 16.5% since 2020. This increase aligns with the intent of the 2021 MPFS changes which significantly increased Medicare reimbursement for office-based Evaluation and Management (E&M) CPT codes.
SullivanCotter’s data represents the largest and most comprehensive physician compensation resource for health systems and hospitals. This year’s report includes data from more than 500 hospitals and health systems on approximately 215,000 physicians across 212 specialties. This reflects a 13% increase in the number of physician records reported in the 2023 survey.
Several market forces continue to influence physician compensation in 2024. Perhaps the most significant and long-lasting trend is changing physician workforce expectations. “The pandemic exacerbated workforce expectations for a more sustainable work life. We see this manifested as reduced or eliminated call expectations, additional paid time off, fewer annual expected work hours, and more interest in compensation plans with a higher proportion of fixed compensation and a lower proportion of compensation at risk,” said Dave Hesselink, Managing Principal, SullivanCotter. The 2024 survey documented decreases in annual expected work hours in Critical Care, Hospital Medicine, and Radiology.
This year’s survey report shows increases in TCC were primarily driven by productivity increases. From 2023 to 2024, reported median work relative value unit (wRVU) productivity for the Adult Medical, Primary Care, and Pediatric Medical specialty categories saw increases of 4-6%. “This is likely due to ongoing recovery from the pandemic in 2023 as well as reported wRVU increases from the remaining organizations adopting the 2021 MPFS changes,” said Hesselink. Increases to the wRVU values associated with hospital-based E&M CPT codes drove reported median wRVU increases in hospital-based specialties such as Hospitalist – Family Medicine (9.1%), Emergency Medicine (8.6%), and Hospitalist – Internal Medicine (8.3%).
Additionally, the 2024 report shows that base salary and wRVU productivity continue to be prevalent compensation plan components in Primary Care, Medical, and Surgical specialty compensation plans. Prevalence for these components ranges from 65-75%, which is consistent with last year’s results. Value-based or quality incentives are used by approximately 50% of organizations with payments averaging 6.8% of TCC for specialists, and 8.6% of TCC for Primary Care.
Although many of the high-level compensation design practices are relatively consistent year-over-year, there is greater variation in the number and type of plans being used. “When it comes to compensation design, the days of a ‘one-size-fits-all’ approach for groups of any size or specialty mix are gone. As the market looks to align compensation more closely with how care is delivered, we’re seeing varying approaches for physicians based on the care delivery model. You’ll see significant differences, for instance, in the mix of compensation components and corresponding proportion of overall pay for a coverage-based specialist as opposed to a primary care physician, and even differentiation within primary care based on the patient population being served,” said Mark Ryberg, Physician Workforce Practice Leader, SullivanCotter.
About SullivanCotter
SullivanCotter partners with health care and other not-for-profit organizations to understand what drives performance and improves outcomes through the development and implementation of integrated workforce strategies. Using our time-tested methodologies and industry-leading research and information, we provide data-driven insights, expertise, and data products to help organizations align business strategy and performance objectives – enabling our clients to deliver on their mission, vision, and values.
For more information on SullivanCotter’s surveys, please visit our website at www.sullivancotter.com, or contact us via email or by phone at 888.739.7039.

INFOGRAPHIC | 2024 Physician Compensation and Productivity Survey
The data is in!
How does your organization’s physician pay practices compare to the latest benchmarks?
SullivanCotter’s longstanding Physician Compensation and Productivity Survey represents the largest and most comprehensive physician compensation resource for health systems and hospitals.
The 2024 report includes data from more than 500 hospitals and health systems on approximately 215,000 physicians across 212 specialties – which reflects a 13% increase in the number of physician records reported in the 2023 survey.
Median physician total cash compensation continues to increase year-over-year across all specialty categories.
Download our infographic – which features highlights from the latest survey report – to learn more about annual changes in compensation and wRVU productivity from 2023 – 2024.
Looking for more? Purchase the 2024 report for deeper insight!

Driving Strategic Imperatives Through Executive Long-Term Incentives
Driving Strategic Imperatives Through Executive Long-Term Incentives
Managing a health system is more complex than ever before.
by Saila B. Srinivasan, Principal – SullivanCotter
Due to ongoing financial, operational, and workforce pressures, managing a health system is more complex than ever before. It requires highly skilled executives who can lead through challenges, manage change, and inspire transformation.
Effective leadership and accountability are necessary for an organization’s long-term success — utilizing the right pay practices and policies to reward and retain key talent is critical. Long-term incentive plans (LTIPs) can serve as an important tool to provide rewards for meeting multi-year objectives. According to SullivanCotter’s Executive Compensation Pulse Survey, released in May 2024, approximately half of health systems sponsor an LTIP. LTIPs are more common among larger organizations (revenue greater than $3B) at 64% prevalence compared to smaller organizations (revenue less than $3B) at 33% prevalence.
While short-term incentive plans ensure progress on operational metrics and annual financial outcomes, LTIPs have evolved to focus on key transformational and strategic objectives that promote resiliency and sustainability. Identifying appropriate long-term objectives that drive progress while also supporting the advancement of short-term priorities can be challenging –especially in light of the uncertain and volatile operating environment. Finding the right balance of incentive plan objectives and timelines for achieving these priorities requires thoughtful planning.
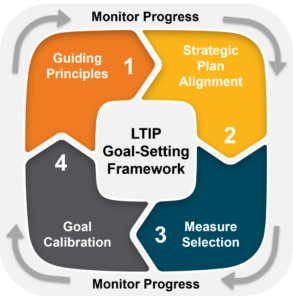
As a guide, SullivanCotter has developed the following framework for organizations to approach LTIP goal setting by identifying key objectives and setting performance levels that drive progress.
STEP 1: LTIP GUIDING PRINCIPLES
External market factors and the overall performance landscape are critical in identifying long-term priorities.
These priorities fall into two main categories:
Tactical – Organizations struggling to meet short-term performance objectives may utilize LTIPs with more tactical goals pursued over multiple years to accelerate performance improvement or recover towards historical performance levels.
- Example: Overall Turnover – This metric is often included in annual incentive plans. However, it is better positioned as a long-term objective if an organization continues to see an increase in overall turnover and requires multi-year efforts that include financial investments, operational changes, and talent sourcing and retention initiatives that require a longer runway to implement.
Strategic – Organizations looking to move beyond short-term operational objectives to achieve longer-range strategic priorities may require a defined process to achieve multi-year outcomes goals
- Example: Health Equity – For organizations early in the health equity journey, an initial step may include identifying key population disparities in selected clinical metrics (e.g., colorectal cancer screening) followed by the identification of a goal that ultimately closes the disparities in the identified populations.
The following principles can be applied to identify and prioritize potential LTIP goals:
- Align with strategic plan or ’stubborn‘ operational challenges
- Limit goals for increased focus
- Minimize overlapping goals among incentive plans
- Utilize metrics with the greatest impact and availability of data
- Add process measures as needed
- Consider meaningful line-of-sight for participants
- Motivate the right behaviors
- Be aware of any unintended consequences
These principles allow organizations to identify realistic and meaningful priorities that help to advance longer-term
objectives.
STEP 2: STRATEGIC PLAN ALIGNMENT AND GAP ANALYSIS
Organizations that frequently review and assess progress toward objectives outlined in the strategic plan are well-positioned to identify key priorities to include in future LTIPs. Organizations that do not regularly review progress may find it difficult to appropriately align priorities and identify key focus areas.
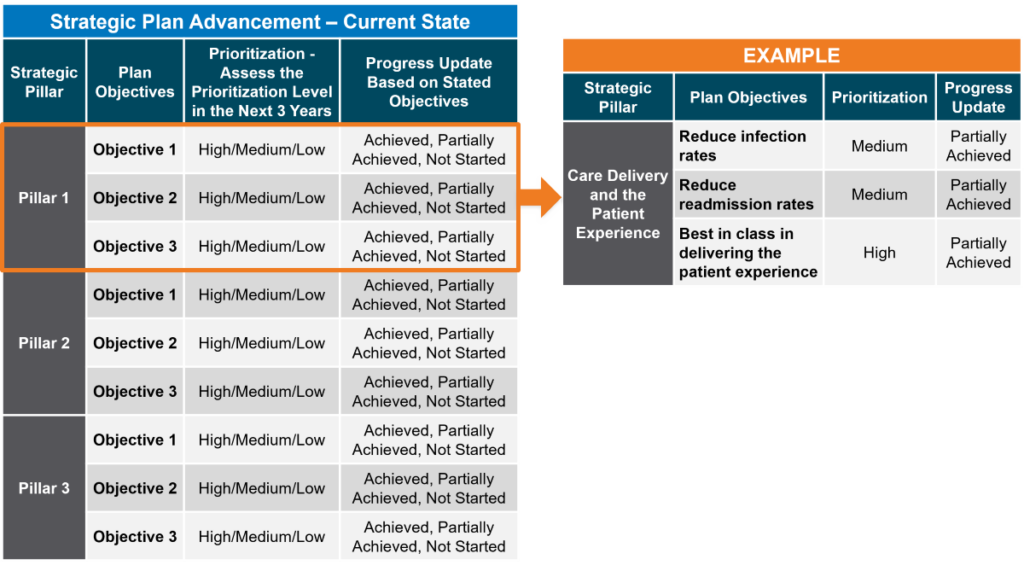
When identifying LTIP goals, start by reviewing the organization’s strategic plan and mapping the plan’s pillars to the goals included in the past and future performance cycles (if known). This will help to identify any gaps in pillar alignment within the LTIP. Next, be sure to assess the prioritization of each pillar over the length of the LTIP cycle (three years being the most prevalent) and indicate the progress on each of the plan objectives.
The figure below provides an example of a current state assessment. This gap analysis shows progress on strategic objectives and helps prioritize key objectives for future LTIP performance cycles.
FIGURE 1.2: STRATEGIC PLAN ADVANCEMENT
STEP 3: MEASURE SELECTION
When determining LTIP priorities, organizations should consider the balance of metrics across incentive plans and the pillars within the organization’s strategic plan. This approach can help to standardize how progress is measured. In addition, it can help to identify if priorities are too narrow or if they position the organization to make progress within the defined performance cycle time frame.
Metrics can include the following:
Outcomes-Based Measures – Outcomes can be measured by an objective metric that reflects progress towards the goal. When considering outcomes, organizations should understand the performance drivers and whether they have the necessary infrastructure, resources, and ability to focus on these objectives appropriately.
- Example: Improve new patient appointment access for identified specialties based on third next appointment availability within seven days. Achievement of this goal may require additional providers, infrastructure enhancements, and implementation of operational processes.
Transformational/Strategic Measures – These measures often include imperatives for which the organization still needs to develop a tactical plan or is in the early stages of exploration. These may be more appropriately aligned with priorities that require disciplined and longer-term incremental progress. Some of these priorities may require the advancement of process steps in the early years.
- Example: Service Line Integration
Year 1: Identify key operational processes that may need to be integrated
Year 2: Develop an integration plan with key milestones that need to be achieved
Year 3: Achievement of defined milestones
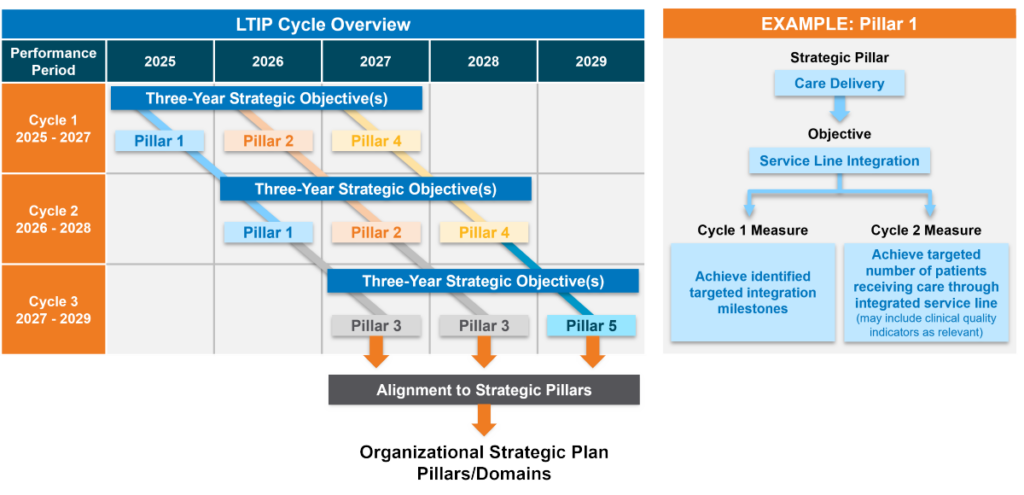
The figure below provides a visualization of how an organization with overlapping LTIP performance cycles can map out LTIP goal priorities across multiple cycles to ensure strategic alignment.
FIGURE 1.3: STRATEGIC PLAN ALIGNMENT
Cycle design also influences measure selection. Given the multiple active measures across performance cycles, overlapping plans may run the risk of diluting focus. However, they can also allow for greater flexibility in goal setting since new priorities are identified more often. This allows the organization to pivot as circumstances change. With different, yet still related, measures, organizations may be more likely to make progress on the overarching objective.
End-to-end plans can include more substantial initiatives since the limited number of goals enables greater leadership focus in a single performance cycle. However, such plans require that leadership have a clear perspective on the critical goals since they are set at the start of the cycle and not revisited until the next cycle begins – typically three years later.
Regardless of the plan design, multi-year foresight into possible LTIP priorities better positions organizations to set goals more closely aligned with system-wide strategy.
STEP 4: GOAL CALIBRATION
The approach to LTIP goal calibration can vary based on the two different goal types:
Outcomes-Based Measures – Historically, LTIPs have largely included objective measures that are based on a specific outcome the health system is targeting to achieve. Organizations often define long-term aspirational
performance levels while considering the resource investments required to achieve the desired progress.
Transformational/Strategic Measures – In recent years, organizations have been using LTIPs as tools to drive accountability for identifying and advancing key transformational and strategic measures. In our experience,
successful LTIPs have a flexible calibration process to recognize that some goals initially require the achievement of milestones. This may include setting up the infrastructure to advance a key strategic measure and then identifying desired target and maximum outcomes measures during the performance cycle. This approach is effective for calibrating highly innovative goals or where the intended outcome may not yet be known.
- Example: Digital Innovation
Year 1: Explore clinical areas where AI technology can be implemented in patient care
Year 2: Implement the AI model(s) in identified care environments and identify relevant outcome metrics (number of patients, dollars saved) via the use of this technology
Year 3: Identify the quantifiable amount saved or number of patients that receive care via the newly implemented technology
Organizations that monitor progress and performance throughout the performance cycle can determine if a shift in focus is required by following a consistent framework for identifying LTIP goal priorities and measurement. Monitoring progress quarterly or bi-annually is more appropriate for LTIP goals, given their multi-year longitudinal focus.
CONCLUSION
Not only are LTIPs an effective way to retain and reward key leadership talent, they also can play a critical role in advancing key strategic objectives that are not captured in the annual performance metrics that support day-to-day operations. LTIPs serve as an important tool to drive performance and system-wide results. Despite current market uncertainty and volatility, using a consistent framework – by applying key guiding principles, assessing strategic alignment, thoughtfully considering measure selection, and calibrating meaningful goals – will help ensure LTIPs focus on meaningful priorities for each performance cycle that will drive long-term success. Using this approach, LTIPs can help the organization focus on transformational efforts that meet the long-range needs of the communities they serve.

Optimizing Clinician Affiliation to Drive Strategy and Performance
Maintain effective relationships and foster greater engagement with clinicians to support long-term health system sustainability.
Rob Moss, Principal, SullivanCotter
Thomas Johnston, JD, Principal, SullivanCotter
Stan Stephen, Principal, SullivanCotter
Originally published by the American Association of Provider Compensation Professionals
The health care industry is no longer in crisis mode. Financial recovery efforts have been underway for the past couple of years, with many health systems stabilizing the core of their enterprises as they entered into 2024. As these improvement efforts continue, organizations should focus on ‘right-sizing’ their service line portfolios to identify underperforming functions, drive select programmatic growth, and diversify revenue streams moving forward.
The clinician workforce is critical to achieving these goals and supporting long-term sustainability.
Maintaining effective relationships and fostering greater engagement can help to ensure clinicians are working in lockstep to amplify strategic service lines and enhance clinical performance. As such, many systems are eager to understand and optimize their investment in clinician affiliation arrangements across their entire physician enterprise.
This includes defining the overall number and type of clinicians needed within the system, understanding the different workforce requirements of both employed non-employed physicians by specialty and location, and instituting programs to help clinicians achieve key system-wide goals.
This article will focus on best practices in driving clinician performance through:
- Supporting strategic workforce alignment of employed and affiliated clinicians
- Selecting the optimal physician-hospital affiliation model within your organization
- Reviewing affiliation arrangements regularly to ensure continued alignment
Supporting Strategic Workforce Alignment
Healthcare systems should assess overall professional service needs in conjunction with the capacity of employed and independent clinicians aligned with core service lines and markets. A comprehensive clinical workforce plan that models the supply and demand – both now and into the future – for physicians and APPs will allow organizations to identify gaps in required coverage and service needs. The objective is to determine how many physicians and APPs are necessary based on geography and the patient population demographics. This assessment will help determine the critical mass of employed and independent clinicians to drive sustainability and select programmatic growth. For example, when a health system is moving into a new market, a workforce plan will help to determine how many clinicians to employ and whether to contract with some physicians to fulfill an unmet need in the community for a particular type of service.
Once gaps in necessary clinical services and coverage are identified, the organization can develop an overall workforce strategy to meet its short- and long-term goals and determine how best to incentivize both employed and affiliated clinicians workforce to meet these objectives.
Designing organizational performance metrics and incentives aligned across the enterprise is critical to achieving and sustaining desired results – and can be managed through incentives written into affiliation arrangements. The enterprise must be interconnected with shared accountability and understanding of how individual and group contributions lead to system-wide success. The addition of unified scorecards creates an opportunity to align performance goals from the leadership level to individual practices and clinicians.
Performance incentives, by nature, are designed to drive the performance of a particular goal – whether quality-related, operational, programmatic, or financial. The objective is to have everyone ‘rowing’ in the same direction. For example, objectives set at the system level should be effectively transferable to the medical group or various service lines and create aligned priorities. Similarly, aligning goals between employed and independent physicians within the same service line is key to promoting efficient care delivery. There must be greater alignment of key performance indicators across both employed and affiliated clinicians to help improve service line delivery and achieve pay-for-performance metrics in payer contracts. As the leadership team and employed physicians have incentives to work toward the same goals, it makes sense for the agreements with independent physicians to do the same.
Selecting the Optimal Physician-Hospital Affiliation Relationship
In order to remain competitive in today’s dynamic environment, health care organizations are seeking to optimize clinical care and enhance performance through a wide range of physician-hospital affiliation relationships and models covering both employed and non-employed physicians. Most health systems rely on a mixture of these models – ranging from low levels of affiliation to full practice integration and employment – which include supportive compensation arrangements and performance requirements aligning with fee-for-service and value-based reimbursements.
There is no one-size-fits-all solution. Organizations should develop a customized approach to managing and strengthening physician relationships based on unique organizational circumstances and affiliation needs. As new partnerships with clinicians are considered, it is important to be intentional in selecting the most appropriate type of arrangement with associated performance metrics and incentives to help drive high levels of performance. Depending on the composition of the system’s existing clinician ecosystem, market forces, competition, and service line objectives, different affiliations might be more effective than others.

Reviewing Affiliation Arrangements to Ensure Continued Alignment
Consistent and structured reviews of clinician affiliation arrangements should be conducted using a standard scoring methodology to support continued alignment with strategic goals and service line performance expectations. This also helps organizations assess if they are getting the services for which they are paying and ensure clinicians are meeting contractual obligations.
Although the criteria used will vary slightly based on type of affiliation arrangement, it is important to evaluate the following requirements:
- Drives service line strategic and financial performance
- Aligns with organizational needs for transition to population health and increased managed care risk-based reimbursement arrangements
- Ensures an adequate number of clinicians to support greater patient access and high quality of care
- Supports timely and effective decision-making on operational and performance-based issues
- Drives intended results through a sustainable financial model
- Enables effective measurement of results and ability to monitor performance across all metrics and incentives.
- Fulfills legal and regulatory requirements such as consistent fair market value (FMV) and commercial reasonableness
- Considers external and strategic market forces such as payer contracts, shifts in community needs, and succession planning
Conclusion
As organizations optimize their portfolios to focus more acutely on improving key service lines and enhancing long-term financial sustainability, it is necessary to ensure that a strong clinical workforce plan with effective affiliation arrangements is at the core of this. This not only includes putting the right clinicians in the right place at the right time, but also effectively engaging them in ongoing performance improvement efforts. A well-considered clinician affiliation strategy – one that is based on the unique goals and circumstances of each organization – will lay the foundation for maintaining effective relationships with both employed and independent physicians, help to align performance metrics and incentive compensation across the enterprise, and support strategic service line delivery and programmatic growth moving forward.
Long-term sustainability requires all hands on deck.
SullivanCotter’s Provider Affiliation and Optimization team partners with organizations to identify, quantify, and optimize physician and advanced practice provider (APP) relationships and performance to improve productivity, engagement, financial results, staffing ratios, and more.

INFOGRAPHIC | Leveling Up: Executive Job Titling
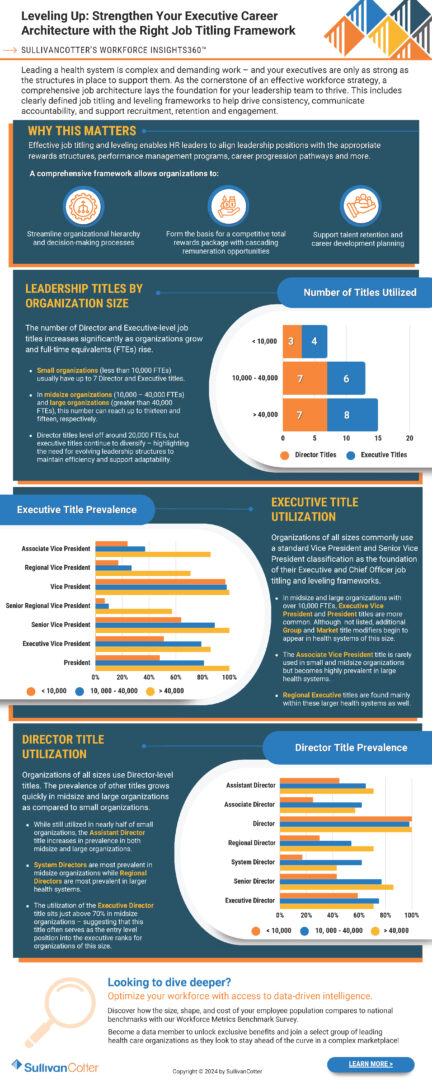
Leveling Up: Strengthen Your Executive Career Architecture with the Right Job Titling Framework
Utilizing SullivanCotter’s Workforce Insights360™
Leading a health system is complex and demanding work – and your executives are only as strong as the structures in place to support them. As the cornerstone of an effective workforce strategy, a comprehensive job architecture lays the foundation for your leadership team to thrive. This includes
clearly defined job titling and leveling frameworks to help drive consistency, communicate accountability, and support recruitment, retention and engagement.
A comprehensive executive career framework allows organizations to:
- Streamline organizational hierarchy and decision-making processes
- Form the basis for a competitive total rewards package with cascading remuneration opportunities
- Support talent retention and career development
Download our infographic to view the latest benchmarks on leadership title by organization side, executive title utilization, and director title utilization.
Looking to dive deeper?
Optimize your workforce with access to data-driven intelligence.
Discover how the size, shape, and cost of your employee population compares to national benchmarks with our Workforce Metrics Benchmark Survey.
Become a data member to unlock exclusive benefits and join a select group of leading health care organizations as they look to stay ahead of the curve in a complex marketplace!

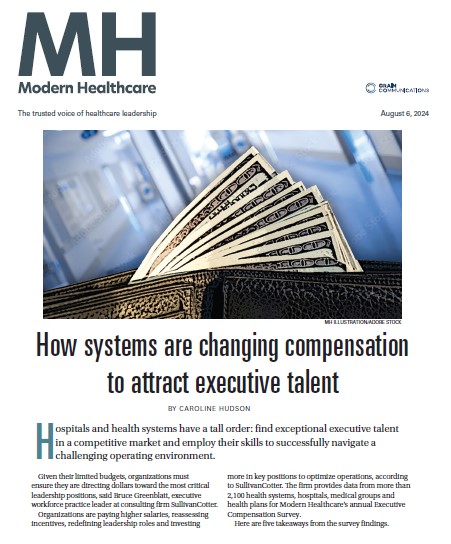
Modern Healthcare | How systems are changing compensation to attract executive talent
Featuring data and insights from SullivanCotter’s 2024 Health Care Management and Executive Compensation Survey
Attracting and retaining executive talent in today’s market is no easy feat.
The industry is experiencing a critical gap in expertise as health care operations grow more complex and the pool of qualified executives – those with the right mix of skills to lead through such challenging times – remains limited. Many organizations are paying higher salaries, reassessing incentives, and investing more in key positions to stay competitive.
Modern Healthcare’s annual deep dive into executive compensation outlines the top five takeaways from this year’s survey findings:
- Rising base salaries reflect ongoing labor challenges
- Systems are realigning incentive packages as performance improves
- Information technology and cybersecurity executives are becoming a necessity
- Organizations are reassessing their structure and redefining leadership roles
- Leaders are going beyond compensation to cultivate internal talent

Executive Span of Control | Identifying the Optimal Structure
Executive span of control, which is generally defined as the number of reports under a leader, should be periodically reviewed to ensure an effective and efficient management structure.
Article has been updated to include the most recent data
In today’s increasingly complex health care environment, executives are responsible for driving performance aligned with a health system’s mission, vision and values. Span of control, which is generally defined as the number of reports under a leader, should be periodically reviewed to ensure an effective and efficient management structure. Health systems strive to attain optimal span of control to ensure their front line staff have the appropriate amount of supervision, communication, training and performance management in place, while also seeking to optimize the cost of their operating model.
At the senior leadership level, span of control is vital and serves as an important measure of accountability for an executive. Having too many reports or lines of business to oversee can dilute strategic focus if executives become mired in day-to-day operations and compromise a manager’s ability to effectively develop and grow talent. Conversely, having too few reports may be an indication of an inefficient management structure with potential duplication of responsibility and approval channels. This can affect the decision-making processes, slow down overall execution, and lead to excess costs.
Note: Span of control is a complex and nuanced management topic. The purpose of this article is to provide a conceptual introduction, share key data and benchmarks from SullivanCotter’s proprietary Workforce Metrics Benchmark database, highlight key strategies and considerations, and summarize the benefits that health systems can achieve from improving span of control. These benchmarks are aggregated across not-for-profit health care organizations with different operating models and strategic imperatives, and therefore should be used as a general point of reference rather than to create specific performance targets.
Finding the optimal mix of management oversight can be challenging.
For this article, SullivanCotter analyzed span of control for more than 4,200 health system executives across different job families and reporting levels in order to identify the typical range of reports and help health systems assess their executive span of control structures.
This analysis is based on data from SullivanCotter’s Workforce Metrics Benchmark database and represents more than 1,700,000 individuals from 92 not-for-profit health systems (comprising more than 1,400 individual/subsidiary hospitals, locations, and other operating entities) with an average net revenue of over $4.5 billion.
Range of Span of Control by Level
SullivanCotter evaluated span of control across five different executive-level roles consisting of Chief Executive Officers (CEOs), Entity CEOs (including Entity Presidents), Executive Vice Presidents, Senior Vice Presidents and Vice Presidents. Definitions of each role are included in the Appendix.
Exhibit 1 below shows the range for the number of direct reports per executive. The green shading indicates the 25th to 75th percentiles, while the red shading indicates the 10th and 90th percentiles.
Range of Span of Control – Number of Direct Reports by Level
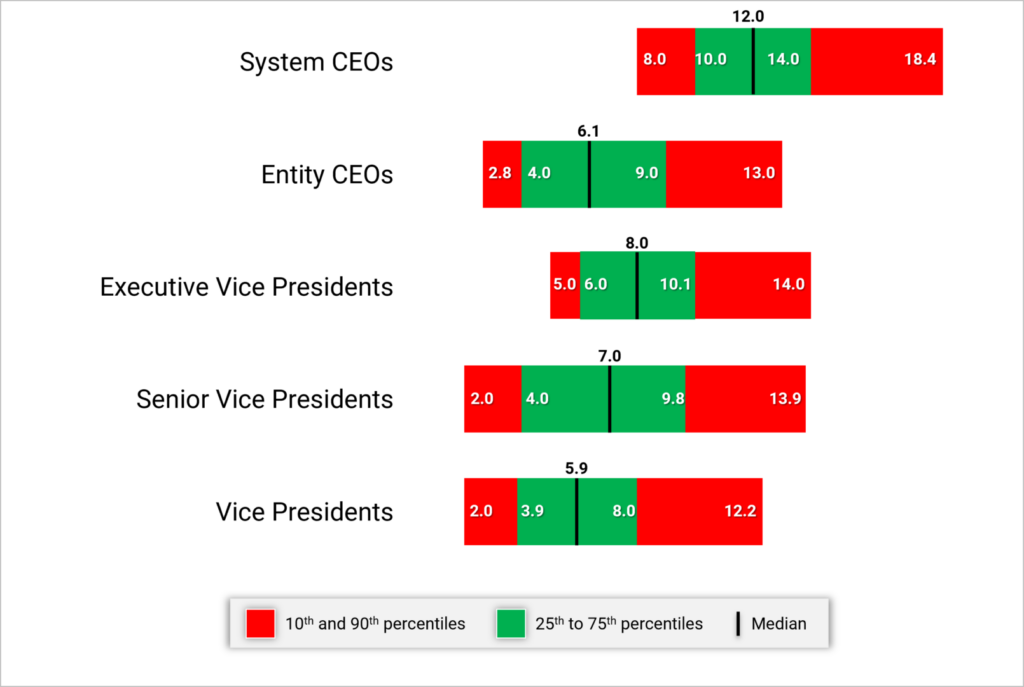
System CEOs and Presidents generally have 10 to 14 direct reports with a median of 12. As we move further down in the Executive levels, this range tends to decrease for any of the Vice President-level positions. Having less than 4 or more than 10 direct reports for this group would suggest it may be appropriate to review the span of control.
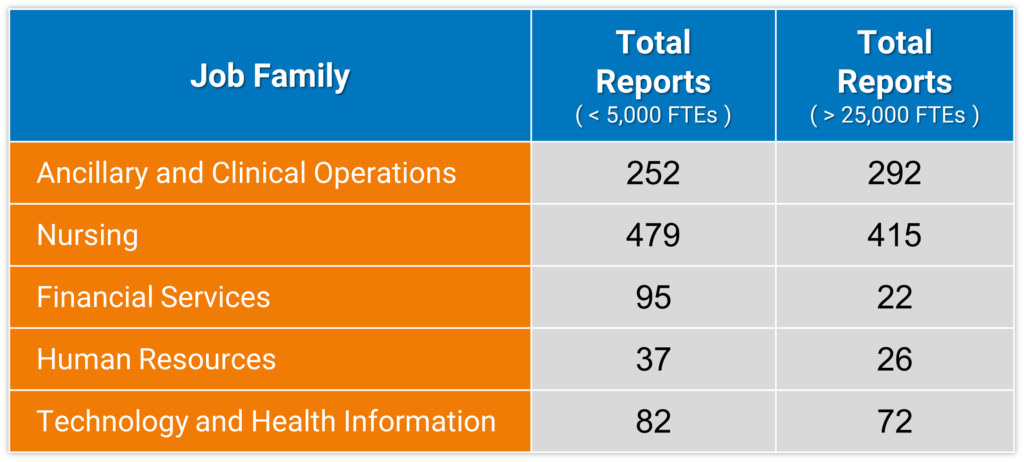
While the number of direct reports is a fundamental component of an executive’s scope of responsibility, it is not the only indicator. The combined number of direct and indirect reports (Total Reports) can help to demonstrate total accountability and can vary widely depending on number of functions overseen, organization size, and functional area. For this purpose, ‘indirect reports‘ include all of the individuals who report through an executive’s direct reports down the organization hierarchy.
For instance, when evaluating Vice Presidents in Nursing (which may include CNOs of affiliate entities) at smaller organizations (less than 5,000 FTEs), the data show that each VP oversees a median of 479 total direct and indirect reports. At larger organizations (over 25,000 FTEs), each Vice President in Nursing oversees a median of 415 total direct and indirect reports. Across most job families in the table below, the number of total reports decreases as organization size increases with a few factors contributing to this pattern. In smaller organizations, some Vice Presidents might be the top executive and therefore have a much wider total span of control – reflecting accountability for the entire job family. Smaller organizations may also have fewer Vice Presidents for a given employee population, which results in a wider total span of control. This is combined with certain Vice Presidents in larger organizations possibly having specific strategic or growth accountability that may not include a corresponding increase in their number of total reports. Total reports can also vary by job family as there are more employees within the nursing and operational functions than we typically see in many of the administrative areas (e.g., Marketing, Legal, Human Resources, Finance).
Exhibit 2 below shows the median number of total reports for a Vice President incumbent for select job families by organization size.
Vice Presidents – Median Number of Total (Direct and Indirect) Reports by Job Family and Organization Size
Range of Span of Control by Job Family
SullivanCotter conducted additional research to analyze span of control by job family and each reporting level within that job family (i.e., the Top Executive of a specific job family at level 1, their direct reports at level 2, etc.). This analysis shows how span of control structure can vary across reporting levels for certain job families.
Exhibit 3 below highlights the differences between Clinical and Administrative job families. Explanation of the core functions within each job family is included in the Appendix.
Median Direct Reports – By Job Family Reporting Level Within Each Family
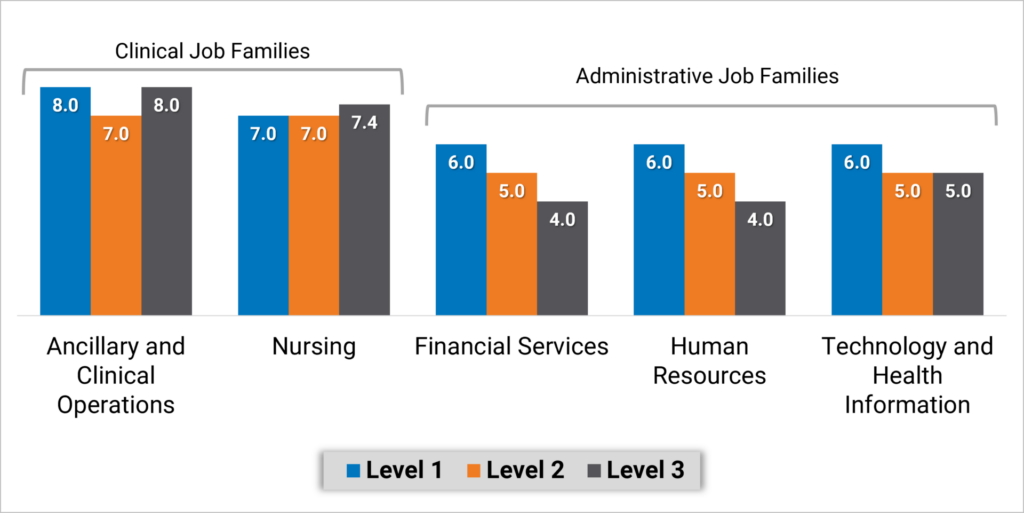
Executives overseeing Nursing and Ancillary and Clinical Operations job families have a more consistent span of control with a median of 7 or 8 direct reports regardless of reporting level. Note that with inpatient nursing having a relatively larger number of employees, median direct span of control for level 2 and 3 nursing executives is the same at 7 to 8. Median span of control in Administrative job families looks different as top executives in Finance, Human Resources and Information Technology functions, for example, have 6 direct reports and the executives at the next two reporting levels have about about 4 or 5 direct reports.
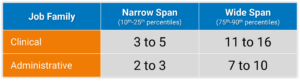
To assess the limits of span of control, SullivanCotter analyzed executives at levels combined across Clinical and Administrative job families. We consider typical span of control to fall between the 25th and 75th percentiles, with excessively narrow or wide span of control falling outside of that range. Health systems can use these benchmarks to identify individuals that fall below the 25th percentile or above the 75th percentile. Based on these data, executives in Administrative job families who have fewer than 3 direct reports may have a span of control that is more narrow than market norms. Conversely, executives in Clinical job families who have more than 11 direct reports may have a span of control that is wider than market norms. Again, with inpatient nursing having a relatively larger number of employees, we have looked specifically at the range of data from the 75th percentile to 90th percentile for executives – which is 10 to 15 direct reports.
Exhibit 4 below identifies the number of directs reports that fall within these two categories.
Range of Span of Control by Job Family
Strategies for Assessing and Redesigning Executive Span of Control
Improving span of control begins with a current state assessment to understand where the health system may deviate from leading practices. These steps include:
- Identify a relevant peer group. Consider the health system’s size and operating model and utilize specific studies or industry surveys (such as SullivanCotter’s Workforce Metrics Benchmark Survey) that contain benchmarks on span of control and management structures. Management consulting firms may also maintain databases and can develop customized comparative analyses.
- Complete an overall span of control analysis across the enterprise. Starting with an overall span analysis may help to identify specific functions or entities that may have outlier data points for further review. Be sure to include both direct and indirect reports.
- Conduct a more detailed span assessment for priority functions such as certain clinical areas or functional support (e.g., revenue cycle, nursing). When conducting detailed analyses for certain clinical or functional support areas (e.g., revenue cycle, nursing), benchmarking against both peer and internal references (e.g., across individual hospitals or entities) is useful in providing additional context. Health systems should also pay attention to individual management incumbents that may be outliers (having many more or less direct reports) compared to benchmarks or to other managers in comparable roles. In particular, leaders that have no direct reports should be assessed as a priority area for appropriate scope of accountability.
- Identify priority areas for improvement. Data-driven insight can help to identify opportunities for improvement. Unique functional nuances or operating models can have an impact on management scope and health systems should consider specific operational characteristics that may contribute to certain individuals having a higher or lower than expected span of control.
In order to right-size executive span of control, there are several key strategies health systems can consider to help facilitate this process:
- Consolidate functional areas (such as the development of Shared Services). For health systems that may have a narrow executive span of control, the consolidation of responsibility under fewer executives can help to widen these. It is important to consider the operational and strategic implications of consolidating or redistributing functional areas and to be deliberate about how similar functions should be grouped together under specific executives.
- Eliminate unnecessary levels. Some health systems may discover that narrow spans of control are the result of too many layers of management. Eliminating a layer can allow for wider span of control while also reducing the number of individuals involved in decision-making and team communication. This, in turn, can help to increase operational efficiency. The optimal number of layers may differ by job family or functional area. Health systems should retain flexibility in their organizational structure to enable customization rather than attempting a ‘one-size-fits-all’ approach.
- Redistribute functional oversight. Certain sub-functions may be assigned to a different executive who has a more narrow span of control to help balance out the ratio of direct reports. In doing this, it is important to balance the number of direct reports across all executives so as not to simply transfer a wide span of control from one executive to another.
- Increase the level of intermediate leadership. Executives with an overly wide span of control may need to add leadership layers in order to spread their scope of responsibility. This does not always mean adding headcount and labor cost. They may choose to elevate one or more of their direct reports and have a handful of functional areas within their scope of responsibility report to this individual instead.
- Re-evaluate total rewards. As individuals are reassigned to different levels, assess their total rewards package to ensure equity across levels. In addition to evaluating market competitive pay based on updated job responsibilities, other total rewards components such as incentive targets, paid time off and benefits eligibility should also be considered.
As health systems select and prioritize these strategies to refine span of control, there are a number of additional considerations to keep in mind:
- Improving span of control is not just about reducing management headcount. Span of control can also influence and impact other aspects of work such as safety, employee engagement, turnover and talent management/professional development. While wider spans of control are considered an industry-leading practice, unecessarily wide spans of control can be linked to lower employee engagement as oversight gets diluted, leading to reduced talent development and career growth.
- While a typical span of control metric involves calculating the ratio of managers to direct reports, health systems should not be focused solely on achieving a target metric. Organization structure needs to be considered in the design of a function to help ensure that the right roles at the right levels are put in place to execute on the operating model. Having the right reporting relationships and management layers in place can also aid with career pathways and succession planning.
- Evolving workforce dynamics also make span of control about much more than the number of managers and staff. Health care span of control ratios have historically been measured on direct in-person supervisory relationships. However, health systems are growing increasingly complex as matrixed reporting and dyad management models become more prevalent. With increased outsourcing, contracted services may not show up under a manager’s official direct reporting. However, these responsibilities still need to be accounted for. The growth of the remote workforce may also impact how we approach people management. While less time may be spent on in-person supervision, health systems are investing in ways to connect more meaningfully and effectively with their employees – which requires sufficient management capacity to execute.
Positive Outcomes
A number of benefits associated with rightsizing span of control have been discussed in this article. The following diagram recaps some of these positive outcomes that health systems have achieved.
|
Streamlined Decision Making
Health systems with efficient management structures can come to conclusions more quickly and move on to execution and implementation as fewer individuals are involved in the decision-making process.
|
Efficient Communications
Health systems that streamline management layers find that certain types of information, especially when communicated verbally, flows from senior leaders to staff much faster when less interim levels of management need to receive and in turn pass on those communications.
|
Stronger Talent Development
With the appropriate reporting relationships and manager-to-staff ratios customized for each function, employees can build strong coaching and development ties with their managers. These structures also facilitate succession planning as employees are well-positioned to develop into future leaders.
|
|
Greater Operational Efficiencies
Health systems that streamline through consolidation of functions have realized benefits in operational efficiencies such as shared staffing, common data sources, increased interaction and collaboration that drives towards common results. |
Improved Clinical and Staffing Outcomes
Health systems should avoid overly high span of control as that can be linked with lower employee engagement and poor adherence to work standards due to limited managerial investment and day-to-day oversight. In clinical settings, research has shown that a greater span of control can correlate with higher rates of patient infection, employee injuries and staff turnover.1
|
Labor Cost Control
Improvements in span of control are not only about headcount reductions. While some health systems have realized labor cost savings through position eliminations when streamlining their management structure, others have been able to focus on other changes such as shifting positions from VP levels to director levels to prevent a “top heavy” organization structure.
|
1Omery, A., Crawford, C.L., Dechairo-Marino, A., Quaye, B.S., Finkelstein, J. (2019). Reexamining the Nurse Manager Span of Control with a 21st-Century Lens. Nursing Administration Quarterly, 43(12), 230-245. doi:10.1097/NAQ.0000000000000351
Conclusion
The data show that spans of control vary significantly among different operations and functional support areas as well as by executive level. As health systems evaluate their leadership structures, differentiated spans of control should be applied for various cohorts of leaders. Robust benchmark data provide an important reference as health systems determine the optimal spans of control.
Span of control is one aspect to consider when evaluating the ideal management oversight model and should not be reviewed in isolation without other performance metrics. Department leaders must still be accountable for achieving their expected outcomes and quality measures. So while health systems may set targets for executive oversight, they must not become fixated on achieving a specific numerical ratio and lose sight of the overarching goal of balancing the need for senior leaders to focus on strategy and growth while also effectively leading their functions to achieve these goals.
Appendix
Executive Job Level Definitions
- Enterprise Chief Executive Officers (CEOs): Associates mapped to this level are the enterprise chief executive reporting to the Board of Directors.
- Entity CEOs and Presidents: Associates mapped to this level typically have overall responsibility for a distinct organizational entity.
- Executive Vice Presidents: Associates mapped to this level are typically managers of one or more Senior Vice President subordinates. Typically has responsibility for multiple job families and is found at the second reporting level in the organization. Within SullivanCotter’s standard titling structure jobs found at this level are typically referred to as “Executive Vice President” or “EVP, Chief Officer”.
- Senior Vice President: Associates mapped to this level are typically managers of one or more Vice President subordinates. Typically has responsibility for one job family and is found at the second or third reporting level in the organization. Within SullivanCotter’s standard titling structure jobs found at this level are typically referred to as “Senior Vice President” or “SVP, Chief Officer”.
- Vice President: Associates mapped to this level are typically third level managers of one or more Director subordinates. Typically has responsibility for multiple functional areas and is often found at the third, fourth or fifth reporting level in the organization. Within SullivanCotter’s standard titling structure jobs found at this level are typically referred to as “Vice President” or “VP, Chief Officer”.
Select Core Functions within Clinical and Administrative Job Families
Clinical
Ancillary and Clinical Operations includes executives in behavioral and mental health, laboratory, pharmacy and rehabilitation, as well as executives that oversee hospital operations such as the COO and VP of Operations.
Nursing includes executives in care management, inpatient and outpatient nursing, surgical services, transitional care, clinical education, emergency medical services and women’s health.
—
Administrative
Financial Services includes executives in functions such as financial administration, tax, audit, planning and analysis, managed care financing, revenue cycle, treasury and investments.
Human Resources includes executives in functions such as diversity and inclusion, employee and labor relations, organizational development, HR operations, leadership and workforce development, talent acquisition and total rewards.
Information Technology (IT) and Health Information includes executives in functions such as IT administration, health information management, IT security, instructional and learning technology, network and infrastructure management, programming and systems development and web services.
Note: As the purpose of this article was to evaluate select job families for conceptual illustration, not every job family or function was analyzed. Examples of other job families not included in the analysis are dietary, housekeeping, maintenance, supply chain, service lines and medical group operations (though ambulatory/outpatient nursing executives are included in Nursing).

Navigating the Nuances of Executive Compensation and Talent Management in Challenging Times
Compete more effectively in a tight market for executive talent.
Featured in the July 2024 edition of The Governance Institute’s E-Briefings
By Bruce Greenblatt, Managing Director and Executive Workforce Practice Leader, SullivanCotter
Healthcare continues to evolve—and some organizations are struggling to keep pace. With complexity at an all-time high and the supply of talent limited, the need to recruit, retain, and engage leadership talent is greater than ever. Designing executive pay programs that are market-competitive and drive organizational performance while also aligning with the overall talent strategy is complicated. Moreover, healthcare boards and their compensation committees are tasked with ensuring executive compensation is fair and reasonable and reflects the mission and values of their organizations—all amidst changing market pressures and growing demands.
Does your organization know how to move forward? With these challenges in mind, this article outlines four important priorities for compensation committees to consider as they oversee the organization’s approach to executive compensation, performance, and talent management.
Pay Competitiveness
In a competitive talent market, effectively attracting and retaining key leaders is more pressing than ever. As some leaders continue to step away and as operations become more complex, there is a critical gap in expertise. The skills required to lead through such change are evolving, and greater value is being placed on those able to lead transformation efforts, drive integration, and operate in a volatile environment.
Moreover, demand continues to outstrip supply as the pool of qualified executive talent is increasingly limited. According to SullivanCotter’s Executive Compensation Pulse Survey conducted in May 2024, 87 percent of health systems are either increasing executive recruitment efforts or undertaking the same level of activity as compared to 2023. All of this is putting upward pressure on total compensation—particularly via higher base salaries.
Compensation committees must ensure that compensation is competitive enough for external candidates and existing high-performing leaders who may be attractive to competitors. Since financial resources are limited, compensation decisions should be measured and strategic, focusing foremost on the most impactful roles. Rewards must be differentiated in a dynamic marketplace to ensure the total spend is optimized—some roles may be appropriately compensated in the mid-market, while others may warrant a compensation premium based on their criticality and impact.
Talent Strategy and Organization Design
Considering evolving talent needs and the limited talent supply, compensation committees and leadership should pay particular attention to the executive talent strategy and succession planning process. Increasingly, an organization’s best source of talent for key leadership roles is found internally. Having a deliberate and ongoing process in place to identify talent requirements, assess availability and needs, mitigate any flight risks, and define and execute development plans is key. Compensation committees should be appraised at least annually of any related succession planning initiatives, including leadership performance, emergency successor readiness, and long-term pipeline development. Given the high demand and changing needs for CEO talent, boards and compensation committees should be especially diligent in developing and monitoring succession plans for this position.
In addition to assessing talent strategy for individual positions, it also is important for compensation committees and leadership to assess the overall organization structure to ensure it is optimized and aligned with strategic objectives. With upward pressure on individual compensation, organizations are assessing whether their total leadership headcount and spend is optimal. In SullivanCotter’s recent Executive Compensation Pulse Survey, 88 percent of health system participants indicated that they have recently or plan to assess the effectiveness of their organizational structure. These actions include reviewing the headcount, spans of control and management layers, reducing or freezing hiring, and developing titling/leveling/career architecture guidelines. Health systems are focused not only on cost optimization but also on talent development by clarifying leadership role definitions and creating clearly defined pathways for career progression through the organization.
Revisiting Incentives
While the initial disruption of the pandemic has subsided, several market pressures are still changing the way executive performance is measured and rewarded. Compensation committees should ensure that incentive performance measures align with operating and strategic priorities as they evolve and that goals have been calibrated appropriately. With financial and operational volatility as the backdrop, goal calibration for executive incentive plans poses a significant challenge. SullivanCotter’s research indicates that nearly half of healthcare organizations have revisited their goal calibration for 2024 incentives.
Changes include the following:
- Evaluating both relative performance compared to peers and absolute scoring results for indicators such as workforce or patient engagement, as an example.
- Widening the range between threshold and target and target and maximum goals to account for volatility and uncertainty in forecasting.
- Setting goals based on expected improvement levels rather than simply absolute scores.
- Seeking third-party assessment of the performance objectives to provide validation around the goals.
In addition to calibrating performance goals, compensation committees should also evaluate incentive program circuit breakers to ensure they remain appropriate. Circuit breaker provisions reduce or eliminate incentive payouts if minimum financial performance is unmet and act as a fail-safe if affordability becomes an issue. Given the volatility of performance in the market and the challenging economic environment, circuit breakers must be meaningful and reasonable. They should balance the need for financial stewardship while also recognizing that other mission-related performance priorities should be rewarded, including delivering high-quality care, ensuring greater patient access, engaging the workforce, and providing exemplary patient service.
Pre-pandemic, a typical circuit breaker would reduce or eliminate incentive awards for performance below 75 to 85 percent of the budgeted operating margin. Such standards may not be appropriate today, with margins hovering, on average, at 1 percent or below. Thus, consideration can be given to setting absolute dollar thresholds for the circuit breaker and/or using a tiered method to reduce awards in pre-defined stages based on actual results. Alternatively, the circuit breaker could be eliminated while a greater weight is placed on financial performance in the organization’s scorecard to ensure an appropriate focus on fiscal stewardship.
Board Governance
With the heightened scrutiny of executive pay levels within tax-exempt healthcare organizations, it is increasingly important for compensation committees to ensure they take a broader view of the compensation program beyond just market competitiveness. As adjustments are considered for the compensation program and individual pay decisions, considerations should also include other essential factors such as pay equity, mission, performance, talent strategy, and more. By adopting a more holistic approach to these decisions, boards and compensation committees can ensure that executive reward programs remain highly defensible and beyond reproach as market conditions evolve, new risks emerge, and organizational dynamics shift.
Conclusion
In the current environment, compensation committees must remain diligent in their oversight and governance. Take a broad view as your organization navigates the nuances of developing a competitive compensation program. Doing so can help compensation committees be confident that their approach will meet organizational objectives in a fiscally prudent manner while supporting recruitment, retention, performance, and talent needs in challenging times.
Key Board Takeaways
Is your executive compensation and talent strategy optimized in today’s environment?
Financial, operational, and workforce challenges within the healthcare industry are at an all-time high. The executive talent market is extremely competitive as the demand for talent continues to outstrip supply. Attracting, retaining, and rewarding leadership is critical.
Boards should consider the following priorities as they reassess their organization’s approach to executive compensation, performance, and talent management:
- With upward pressure on total compensation and unabating financial challenges, explore opportunities to optimize compensation spend. Strategies include differentiating compensation for direct rewards to the most critical talent. At the same time, prepare for highly competitive offers when recruiting externally.
- Ensure critical talent is retained and seek opportunities to build from within. Assess talent risk and direct interventions to critical positions that may be at risk. Focus on succession planning and leadership development.
- Optimize the organization structure by focusing not only on headcount, spans of control, and management layers, but also on titling and career architecture to support talent development.
- Revisit incentive plans to ensure performance goals are properly calibrated and that circuit breakers balance financial sustainability with rewards for advancing the mission.
- Ensure a holistic review of executive compensation beyond just market competitiveness, including consideration of pay equity, mission alignment, performance, and talent strategy.

Beyond Compliance: Get More from Your Annual FMV Assessments
Utilizing Physician FMV Assessments to Guide Strategic Workforce Decision-Making
It’s more that just a ‘box-checking’ exercise!
Originally published by the American Association of Provider Compensation Professionals
Written by Dave Hesselink – Managing Principal, SullivanCotter and Clara Hurtt – Principal, SullivanCotter
Healthcare continues to grow more complex as organizations respond to ongoing operational, financial, and workforce challenges. To help aid in recruitment and retention, advance key value-based goals, support a variety of physician-hospital affiliation relationships, and often a dynamic combination of several factors – physician compensation is evolving in kind. Moreover, as clinical workforce shortages loom large, the need for competitive compensation arrangements in a tight market for talent is greater now than ever before.
As pay practices change and priorities shift, it’s important to review physician compensation regularly. Most organizations conduct an annual or biannual Fair Market Value (FMV) market assessment to satisfy an internal governance or oversight requirement. The value of conducting an annual FMV review, however, goes well beyond a compliance ‘box-checking’ exercise. Results and observations from these assessments can act as a catalyst to jumpstart strategic workforce conversations, validate investments made in the physician workforce, and ensure an organization is aligned with market-leading practices.
Market Assessment Benefits
Instead of limiting an FMV assessment to compliance purposes only or deciding an assessment is not necessary, organizations should consider several additional benefits:
- Opening or enhancing the lines of communication with governance groups: Many organizations have specified Board or Board Committee-level oversight of physician compensation to ensure an understanding of associated compliance risks (see Figure 1 below). With this level of oversight, Boards will better appreciate ongoing recruitment and retention challenges the organization is facing – resulting in a broader discussion of physician compensation from a strategic perspective. This includes physician affiliation and employment and the resulting financial tradeoffs that may be necessary. Board-level engagement in physician compensation is also important from an accountability perspective to ensure management decisions are consistent with an organization’s values and long-term interests. Determine clinician demand, population demographics and payor mix by ZIP code.
FIGURE 1: Typical Physician Compensation Governance Structure
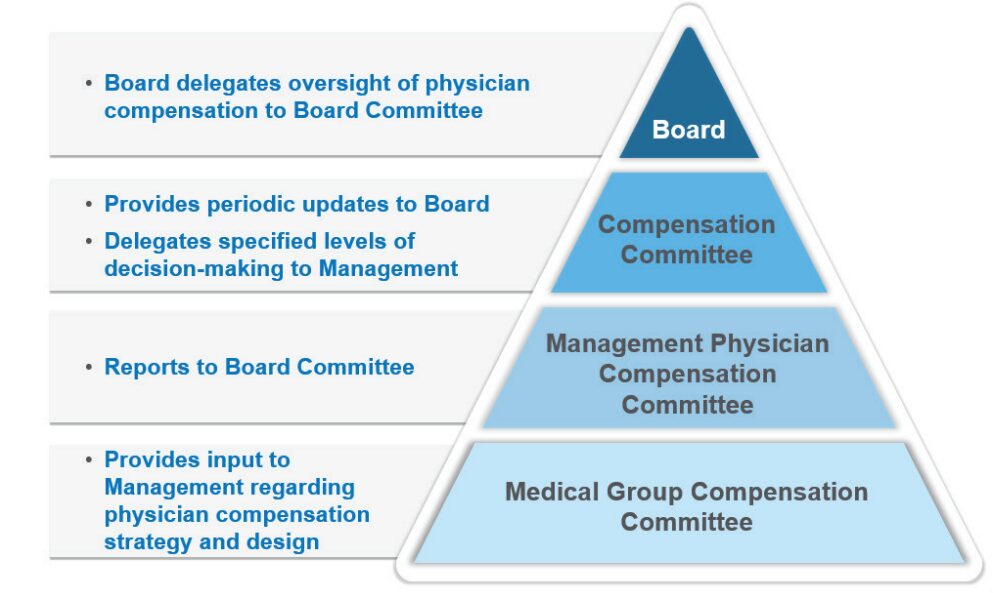
- Illustrating overall market positioning of physician compensation and productivity: Many organizations use regular FMV assessments to track market positioning over time. This serves as a useful gauge of the compensation program’s competitiveness and effectiveness for employed physicians.
- Serving as an important tool for physician workforce planning: A regular FMV assessment identifies physicians who are clinically productive beyond what is sustainable in the long run. These physicians may be highly compensated for their work effort but have a higher potential for burnout – presenting an organizational risk that must be mitigated. It also highlights specialties that are more or less productive than others, pinpoints areas experiencing workforce shortages as indicated by unsustainable productivity levels and helps to determine which specialties may have misaligned work effort expectations – such as an annual clinical work hours expectation that falls short of the market norm.
- Illuminating the effectiveness of the organization’s recruitment programs: Sign-on bonuses, student loan repayment programs, and temporary or long-term housing assistance are all considered economic benefits that must be included when evaluating FMV. The effectiveness of these programs is often reflected by their prevalence and can be evaluated in combination with physician retention rates once these recruitment incentives run their course.
- Identifying outdated compensation rates or pay practices that are no longer necessary: Often these rates or pay practices were adopted to address a particular staffing challenge. For example, the pandemic required extra shift rates to maintain appropriate levels of staffing during an unprecedented industry crisis. Temporary rates were supported from an FMV perspective during this period but are likely not viable long-term. In some cases, unwinding these temporary rates may not have been a priority. An annual FMV assessment can bring these rates to the forefront for review and potential sunsetting.
- Utilizing data collected as part of the FMV assessment to help evaluate pay equity within the physician workforce. Adding ethnicity, gender, and age as required fields within the data collection process can help to flag potential pay inequities. Conducting an effective pay equity assessment requires advanced statistical testing techniques that are not normally included as part of a standard FMV assessment. While an FMV assessment on its own does not satisfy the requirements of a comprehensive and defendable pay equity assessment, it can serve as a catalyst.
The following case study illustrates a practical application of the benefits as outlined above.
Case Study
Health System ABC is a $2.5 billion revenue organization that employs approximately 650 physicians – 65% on an academic track and 35% on a clinical track. Health System ABC conducts an annual retrospective market assessment to satisfy internal compliance and policy requirements. While this annual assessment helps to ensure that compensation aligns with FMV prior to paying year-end incentives, the organization has realized several additional benefits.
1. Determining market competitiveness of compensation
Annual review of aggregate market positioning by specialty highlighted a need to increase pay levels for some specialties to align with the organization’s overall compensation philosophy. In addition, comparing market positioning from year to year demonstrated market movement or more fundamental changes within the workforce.
Figure 2: Comparison of Aggregate Compensation Market Positioning by Specialty
(Current Year versus Prior year)
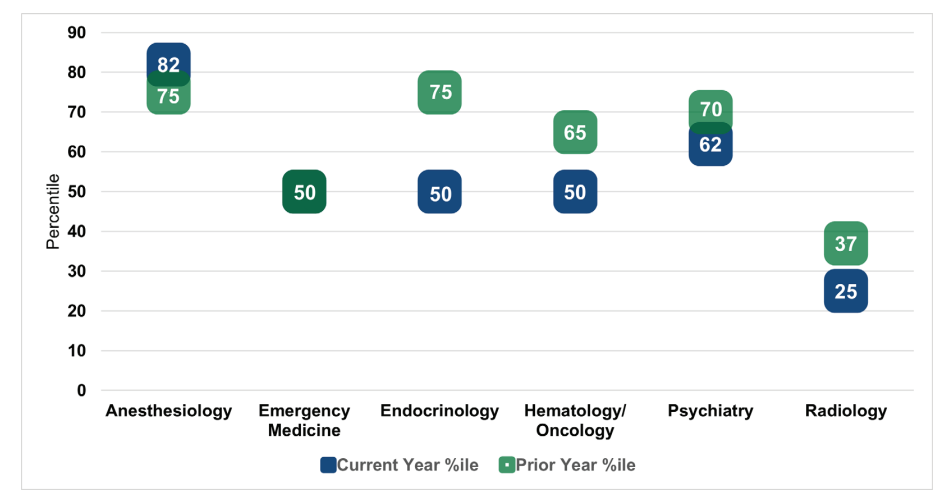
As shown in Figure 2, market positioning for anesthesiology outpaced the prior year by seven percentile points. Upon further research, Health System ABC determined that this finding was a result of short-staffed anesthesiologists picking up extra shifts at premium rates. This validated the need to ramp up the organization’s recruitment strategy for this specialty.
By contrast, current year market positioning for emergency medicine was consistent with the prior year. While Health System ABC had made an important investment into physician compensation within this department, the annual FMV assessment demonstrated that the investment was only just
keeping pace with market movement. Current year positioning for endocrinology, hematology and oncology, psychiatry, and radiology fell below the prior year. After reviewing new hires, terminations, and incentive payouts in each of the specialties, Health System ABC recognized that additional
investments in physician compensation were needed to maintain pace with the market.
Radiology, in particular, fell well below the organization’s target compensation range as defined by the physician compensation philosophy. As a result of their annual FMV assessment and recent recruitment experience, Health System ABC made a strategic decision to invest in this specialty to ward off potential shortages and retention issues.
2. Measuring compensation plan effectiveness
The annual FMV assessment identified several individual physicians whose compensation outpaced productivity. Health System ABC observed that the department distribution methodology for the incentive pool within certain specialties had little to no relation to individual physician performance (e.g., shared equally among the physicians, prorated based on total FTE). This observation provided the organization’s leadership team with a reason to limit the number of distribution methodologies to those that factor in individual physician performance. This made the plan easier to administer and aligned incentives more closely with individual performance and contributions.
3. Eliminating temporary critical staffing rates
Health System ABC’s FMV assessment found that a particular COVID-19 shift coverage rate, which paid hospitalists above the 90th percentile, was still in place 12 to 18 months post-pandemic. While the rate was necessary during the pandemic, it was no longer necessary under current circumstances. After the continued use of this rate was brought to light, Health System ABC worked quickly to assess and eliminate high shift rates. This helped to decrease costs and align rates more closely with the market.
4. Redefining the definition of clinical full-time equivalent (FTE)
As part of the annual FMV assessment, Health System ABC collected data on hours worked in hospital-based specialties. When comparing hours worked for a 1.0 FTE Emergency Medicine physician to the market definition, Health System ABC learned that its FTE requirement was approximately 300 hours less. While the organization couldn’t close the 300-hour gap overnight, this observation led to additional workforce planning discussions with the Department Chair.
5. Aligning leadership rates to the market
Historically, Health System ABC had paid a single hourly rate across all specialties for entry-level leadership roles. By using this approach, the organization was inadvertently disincentivizing physicians in highly paid specialties to accept leadership roles as they could earn more on an equivalent time basis in their clinical roles. With the help of an annual FMV review, Health System ABC implemented specialty-specific leadership rates to more appropriately align leadership pay to the market.
While the ultimate objective of Health System ABC’s annual FMV assessment was to satisfy a compliance obligation, the observations and information obtained throughout the review helped the organization to understand whether workforce decisions and investments continued to align with organizational needs and market-leading practices.
Conclusion
As health care organizations look to design, evaluate, and administer physician compensation in an increasingly complex marketplace, they require a comprehensive governance and oversight process to help support ongoing compliance and mitigate regulatory risk. While many conduct an annual or biannual FMV assessment to satisfy legal obligations, there are additional benefits for organizations to consider as they undertake these evaluations.
These include creating clearer lines of communication with the Board’s Compensation Committee, quantifying market competitiveness, supplementing workforce planning efforts, understanding the effectiveness of recruitment and retention programs, refining or removing outdated pay practices, and providing a baseline for a physician pay equity assessment. Regular FMV reviews are not only an essential component of an organization’s physician compensation strategy, but they can also help to support a more holistic and well-rounded understanding of your physician workforce.

Forbes | How Health Care is Evolving to Combat Labor Shortages
Organizational Design Matters: How Health Care is Evolving to Combat Labor Shortages
The demand for health care is at an all-time high. Can the industry keep up?
With the healthcare workforce crisis in full swing, the industry requires more agile and innovative solutions if it hopes to forge a sustainable path forward.
Ongoing labor shortages remain a primary concern for many health care organizations nationwide – especially as patient demand increases. Those unable to adjust may struggle with rising costs, lower quality of care, and patient access.
Recently featured in Forbes, SullivanCotter’s President and CEO, Ted Chien, highlights how true transformation requires the industry to:
- Modernize clinical staffing models through a greater understanding of patient population needs
- Optimize organization design with insight into the size, shape, and cost of the employee population
- Modify our vision of talent to prioritize upskilling in preventative health, build the nursing pipeline, and nurture non-traditional pathways to clinical employment
Is the U.S. Health System Status Quo Sustainable?
Several key factors impact the financial sustainability of hospitals and health systems
How is your healthcare organization addressing this issue?
This provocative byline from the January 15th edition of The Keckley Report and updates from J.P. Morgan’s 2024 Healthcare Conference underscore the importance of financial sustainability for not-for-profit health systems. While health financial performance seems to have stabilized in recent months for many hospitals and health systems, ongoing sustainability is still an issue that looms large.
Financial recovery efforts have been underway since 2022 with most health care systems stabilizing the core of their enterprises by focusing primarily on surgical and procedural services. Many are also addressing staffing shortages and escalating costs, dealing with unionization in some markets, managing decreased volume in certain specialties, optimizing operational performance, and negotiating improved reimbursement where possible. As these efforts continue, right-sizing service portfolios, sites of care, and workforce composition will better enable organizations to define and focus on their core services while exiting unnecessary or underperforming ones.
Midway through 2024, multiple industry reports indicate that surgical and procedural volumes have increased back to pre-pandemic levels – placing additional pressure on staffing supply, costs, and the need to increase revenue to keep pace with expenses. With greater stabilization and markets and service portfolios being rationalized, efforts can be focused on improving retained services, assets, and the workforce required to support patient access. In parallel, organizations can then consider opportunities for select programmatic growth within their core business and in new areas to diversify revenue.
A key factor in health system sustainability is the investment in its clinician ecosystem – including employed physicians and APPs and various forms of clinician affiliations and relationships with independent clinicians. Health systems are eager to understand and optimize the appropriate level of investment more broadly across their physician enterprise, medical group, specific service lines, and the clinical workforce.
Integral to this effort is continuous performance improvement in three critical areas:
- Aligned enterprise performance metrics and incentives
- Effective relationships with a critical mass of aligned clinicians
- Enhanced performance management
Aligned Metrics and Incentives
Designing organizational performance metrics and incentives that are aligned across the enterprise is critical to achieving and sustaining desired results. The entire enterprise must be interconnected to drive greater performance. This includes shared accountability as it relates to the most impactful measures with a greater understanding of how individual, team and departmental contributions support organization-wide success.
Objectives set at the system level may not translate to the medical group, which can potentially lead to disparate and isolated priorities during the goal-setting process. Vertical alignment in KPIs across both employed and affiliated clinicians will help improve service line delivery and achieve pay-for-performance metrics in payer contracts. In addition, unified scorecards create an opportunity to align performance with the executive level, medical group leadership, practices, and clinicians.
Effective Relationships with Clinicians
As health systems continue to rationalize their core services and drive select programmatic growth, defining the critical mass of clinicians needed within the organization is critical to ensuring success. This includes understanding the workforce requirements of employed and/or affiliated physicians and APPs by specialty and geographic location.
Next, understanding how to align and engage these clinicians is critical to developing effective relationships and ensuring the clinical workforce is working to identify areas for continuous improvement and achieve strategic objectives.
These efforts can be supported in several ways:
- Optimizing staffing models to drive greater patient access, improve clinician satisfaction, and address burnout and turnover
- Developing the right physician-hospital affiliation relationships to accommodate various evolving workforce requirements and needs
- Empowering clinicians through leadership positions or other decision-making roles
- Structuring compensation arrangements to include measurable incentives that drive clinician behaviors and performance in a way that aligns with organizational goals
Optimized Performance Management
Several key factors impact the financial sustainability of hospitals and health systems. These include patient access, utilization, reimbursement, providers and staff composition, effective models of care, and efficient use of resources. Understanding and measuring current performance levels within each of these areas is essential. A close evaluation of productivity, referral and out-migration patterns, compensation, staffing ratios, and investment per provider full-time equivalent can help organizations leverage their strengths more effectively as well as identify opportunities for improvement. Health systems should continually monitor their medical group’s performance and periodically reassess to consider evolving goals and circumstances. Optimizing the overall performance of affiliated clinicians is equally important and can be achieved by assessing each affiliate agreement to ensure incentives are aligned.
Conclusion
As hospitals and health systems continue to address dynamic market, workforce, and operational challenges, ensuring financial sustainability is necessary. For many organizations, this will likely be found in the orchestrated confluence of strategically aligned and rationalized service portfolios, performance metric and incentive alignment, clinical workforce design, and performance optimization.
Continuous performance improvement in these areas will help yield year-over-year financial improvements that will meaningfully influence health system sustainability in these critical years to come.
Long-term sustainability requires all hands on deck.
SullivanCotter’s Provider Affiliation and Optimization team partners with organizations to identify, quantify, and optimize physician and advanced practice provider (APP) relationships and performance to improve productivity, engagement, financial results, staffing ratios, and more.

INFOGRAPHIC | APP Workforce Insights: Hematology Oncology
Learn more about work expectations, models of care, billing practices and more within Hematology Oncology.
As health care organizations seek to improve access, quality, service, and affordability, developing a strategy to integrate, optimize and engage the growing advanced practice provider (APP) workforce across all specialties is essential.
With the latest optimization and utilization benchmarking data, organizations can establish a comprehensive APP workforce strategy and prioritize critical areas of opportunity. Consider the following specialty-specific insights into Hematology Oncology when evaluating your APP workforce.


ON-DEMAND WEBINAR | Struggling to recruit and retain your nursing workforce?
Maximizing the Employee Value Proposition
A Holistic Approach to Nursing Recruitment and Retention
Hosted by the American Hospital Association/Health Forum
How is your organization addressing ongoing nursing shortages? Many hospitals and health systems are reassessing various nursing workforce strategies in order to stay competitive and support recruitment and retention in a financially sustainable way. While this often consists of reviewing broader employee total rewards programs, it also includes a careful analysis of current workforce structures. View our recent webinar on-demand to learn how to:
- Design an effective total rewards strategy amidst workforce shortages
- Adjust nursing pay programs to account for differences in cost of living, geography and care settings
- Analyze span of control, headcount, nursing job architecture and career frameworks to help identify areas for improvement
Fill out the form below to view the webinar recording!

PRESS RELEASE | Sullivan Cotter Holdings, Inc. Acquires Lotis Blue Consulting
Sullivan Cotter Holdings, Inc., Adds Health Care Organizational Design and Strategy Execution Services to Portfolio
—
June 20, 2024 – CHICAGO – Sullivan Cotter Holdings, Inc., the nation’s leading human capital information management holding company for health care and not-for-profit/tax-exempt organizations, has acquired Chicago-based Lotis Blue Consulting.
Formed in 2005, Lotis Blue (previously Axiom Consulting Partners) works with organizations in multiple industries to develop solutions to their most complex and difficult problems related to organization, teams, workforce, and leadership. Having served over 450 clients since their founding, they have built a reputation for delivering business impact through strategy-led organization design, talent management, and improving the performance of executive teams and leaders. The firm’s robust and proprietary approach to combining data and behavioral science to elevate workforce, leadership, and organizational performance in service of strategy execution is uniquely positioned in the market and credited with realizing sustained client results. In 2024, Forbes recognized the firm as one of America’s best management consulting firms.
Lotis Blue will continue to serve clients across all industries as it expands more deeply into the health care industry. Existing and prospective health care and not-for-profit/tax-exempt clients of Lotis Blue and the individual brands within Sullivan Cotter Holdings, Inc. – SullivanCotter, Clinician Nexus and C3 Nonprofit Consulting Group – will specifically benefit from expanded services and related offerings.
“When we offer Lotis Blue services in conjunction with our portfolio of companies, we create synergistic services for health care and other not-for-profits that support business transformation at all levels,” said Ted Chien, President and CEO of Sullivan Cotter Holdings, Inc. “Health care is in a transformative period that requires careful consideration of structure with the ability to execute real organizational change. This acquisition allows us to leverage talent and experience within the general industry that can be critical to transforming health care.”
Health care organizations face labor shortages, market consolidation, and increased patient demands for a more integrated, value-based care experience. As a result, they are under pressure to reimagine operational models and structure – addressing everything from talent recruiting and retention to workforce development to incentives, rewards, and compensation. More so, they seek individualized data and analytics to guide potential business shifts that will drive positive change across labor, revenue, efficiency, and patient experience.
“Sullivan Cotter Holdings has an incredibly deep bench of knowledge within its brands,” said Garrett Sheridan, CEO of Lotis Blue. “We see this as an opportunity to expand our services to create a holistic, multi-disciplinary resource for organizations looking to strategically transform how they compete and serve their highly purpose-driven stakeholders in today’s ever-changing market.”
About Sullivan Cotter Holdings, Inc.
Sullivan Cotter Holdings, Inc., is the parent company of independent operating brands SullivanCotter, Clinician Nexus, Lotis Blue Consulting and C3 Nonprofit Consulting Group. This collection of complementary brands helps organizations solve complex workforce issues by enabling people, processes and technology aimed at large-scale business transformation.
For more information, email info@sullivancotter.com or call 888.739.7039.
Note to media: Additional information and interviews are available on request.