VIDEO | How can APPs help to drive greater patient access?
Bolster your APP workforce strategy!
Learn more from our ongoing video series.
The demand for care is at an all-time high.
Is your organization doing all it can to maintain and even increase patient access? Advanced practice providers are critical in achieving these goals!
Tune into our latest video in which Hadley Powless discusses how top-of-license practice can help organizations bridge the gap between patient access and demand.
Looking for help?
We’re experts in developing strategic models of care to effectively integrate and engage this growing workforce.
Learn more about how we can help you enhance the way APPs are utilized across your organization.

PODCAST | Value-Based Care: Latest Trends and Developments
By 2030, the Centers for Medicare and Medicaid Services' goal is to have 100% of traditional Medicare beneficiaries in a relationship with accountability for quality and total cost of care.
Is your organization set up for success?
Health care organizations nationwide continue to navigate the shift from volume to value-based care. While improving clinical operations and performance to help support important quality and population health management initiatives remains a top priority, many are still finding it difficult to navigate complex regulatory requirements, manage changes in reimbursement, and align physician compensation more closely with value-based incentives.
Tune into this AHLA-sponsored podcast for the latest guidance from our experts!
SullivanCotter’s Rob Moss sat down with Maggie Martin, Chief Legal Officer at the Oklahoma Hospital Association, to explore how organizations can:
- Address any potential implications of CMS’ goal
- Compensate physicians more effectively in the transition from volume to value
- Align performance metrics with incentives with how they’re being reimbursed by payers

Forbes | What is the key to health care succession planning?
Early Strategizing and Flexibility are Key to Health Care Succession Planning
The health care industry is experiencing a critical gap in expertise as operations grow more complex and executives retire or step away.
As exits trend up, succession planning is a pressing challenge that many leading health systems in the U.S. are struggling to address.
Whether a change among top leadership roles is planned or unexpected, its impact on the rest of the organization—and how the strategy for the next generation of leadership plays out—can have far-reaching effects on a system’s financial performance, employee retention and care delivery.
There are three important considerations that organizations should take into account as they look to minimize disruption before, during, and after key leadership transitions.
Recently featured in Forbes, SullivanCotter’s President and CEO, Ted Chien, highlights care organizations must:
- Start planning three to five years early
- Hire future leaders now
- Weigh the merits of internal verus external hires

VIDEO | How have APP productivity measures evolved?
Accelerate the impact of your APP workforce with greater insight into productivity!
Learn more from our ongoing video series.
How has the measurement of advanced practice provider productivity evolved over the past few years?
Reward high performers, manage team performance, and set appropriate work expectations with reliable APP productivity data!
Both the tracking and reporting of APP productivity have evolved significantly in recent years as organizations look for better ways to monitor performance. The amount and scale of data has grown to include several different variables such as work RVUs, encounters/visits, and even quality and value-based outcomes.
Learn more from SullivanCotter’s Sarah Kasner on evaluating APP performance and how our productivity data can help you set individual and team goals.
Looking for additional insight?
We’ve got more data!
Download our infographic to access the latest APP productivity benchmarks – including wRVUs, collections, patient visits, and more.

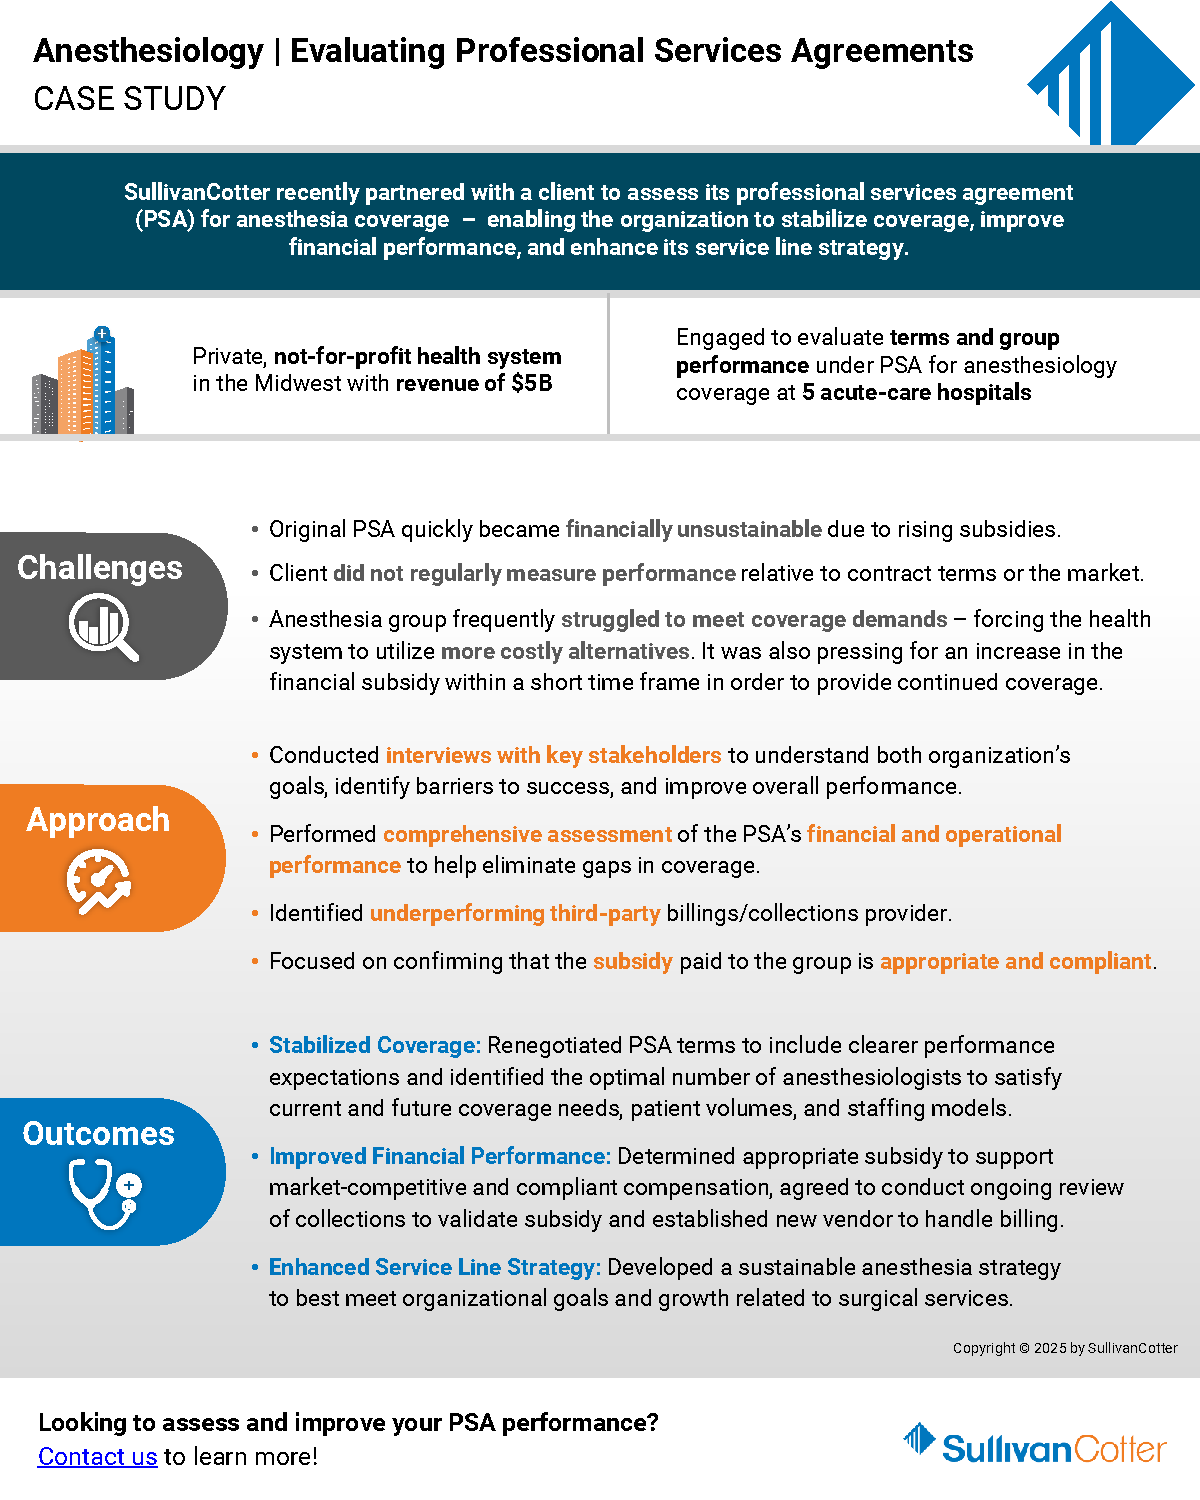
CASE STUDY | Anesthesia Coverage: Assessing Professional Services Agreements
Is your anesthesia group struggling to meet coverage demands?
It may be time to reassess the terms of your professional services agreements (PSA) for this critical service line.
The demand for anesthesia coverage is greater than ever as staffing shortages persist and surgical procedures increase. Coupled with rising subsidies, many organizations are finding that their existing arrangements are not financially sustainable.
SullivanCotter recently partnered with a large not-for-profit health system in the Midwest to evaluate the terms and group performance under its PSA for anesthesiology at five acute care hospitals.
Discover how he worked with this client to:
- Stabilize coverage by renegotiating PSA terms to include clearer performance expectations and identifying the optimal number of anesthesiologists to satisfy current and future coverage needs, patient volumes, and staffing models.
- Improve financial performance by determining appropriate subsidy to support market-competitive and compliant compensation and identifying underperforming third-party billings/collections provider
- Enhance overall service line approach by developing a sustainable anesthesia strategy to best meet organizational goals and growth related to surgical services.
- …and more!
View the case study for greater insight into this organization’s challenges, our approach, and the outcomes!

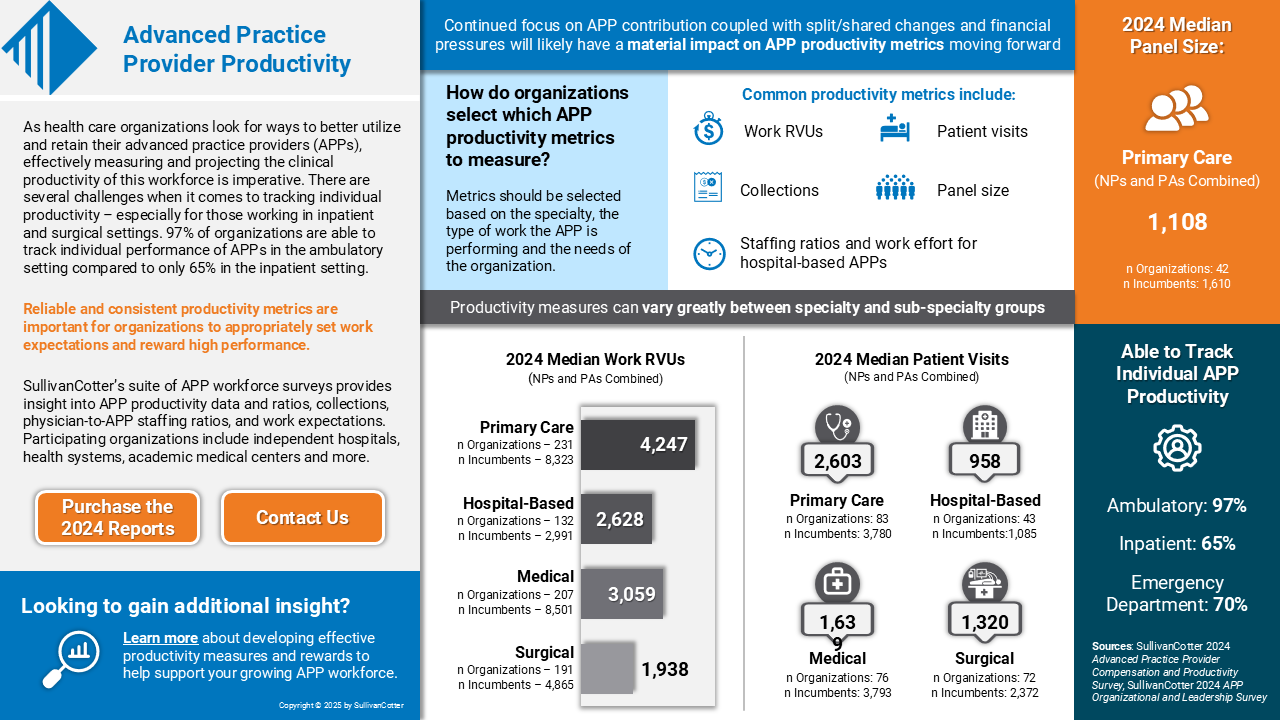
INFOGRAPHIC | 2024 Advanced Practice Provider Productivity
Is your organization effectively tracking and reporting on APP productivity?
Dive deeper into the latest APP benchmarks on work RVUS, collections, patient visits and more!
As health care organizations look for ways to better utilize and retain their advanced practice providers (APPs), effectively measuring and projecting the clinical productivity of this workforce is imperative. There are several challenges when it comes to tracking individual productivity – especially for those working in inpatient and surgical settings. According to SullivanCotter’s APP Compensation and Productivity Survey, 97% of organizations are able to track individual performance of APPs in the ambulatory setting compared to only 65% in the inpatient setting.
Reliable and consistent productivity metrics are important for organizations to appropriately set work effort expectations and reward high performance.
SullivanCotter’s suite of APP workforce surveys provide insight into APP productivity data and ratios, collections, physician-to-APP staffing ratios, and work expectations. Participating organizations include independent hospitals, health systems, academic medical centers and more.

Press Release | SullivanCotter Opens Participation for 2025 Health Care Compensation Surveys
Support your workforce strategy with industry-leading benchmarks!
JANUARY 22, 2025 – SullivanCotter, the nation’s leading independent consulting firm in the assessment and development of total rewards programs, workforce solutions, and data products for health care and not-for-profits, recently opened participation for its annual suite of health care compensation and workforce productivity surveys.
For more than 30 years, SullivanCotter has provided critical benchmarks and comprehensive total compensation information, analyses, and research to the nation’s top hospitals and health systems. The firm’s market-leading surveys combine data-driven intelligence with national insights to help organizations confidently manage their total rewards strategy across the entire workforce.
SullivanCotter’s longstanding flagship surveys include:
- Health Care Management and Executive Compensation
- Physician Compensation and Productivity
- Advanced Practice Provider Compensation and Productivity
- Health Care Staff Compensation
These are part of a larger and more robust survey suite that also includes insight into registered nurses, benefits practices, physician and medical group executives, on-call pay programs, hospital-based physicians, and more.
“Health care is constantly evolving, and our clients require meaningful data and insights to help navigate unprecedented workforce challenges. Our proprietary surveys enable them to keep pace with an evolving marketplace and develop compensation strategies to attract, engage, and retain top talent,” said Ted Chien, President and CEO, SullivanCotter.
Participants receive substantial discounts on the full survey reports, early access to electronic survey results, invitations to webinars led by our experts, and a dedicated team on hand to assist with questions.
To participate in or learn more about any of SullivanCotter’s surveys, please contact us via email or by phone at 888.739.7039.
Note to media: Data and interviews are available on request.
—
About SullivanCotter
SullivanCotter partners with health care and other not-for-profit organizations to understand what drives performance and improves outcomes through the development and implementation of integrated workforce strategies. Using our time-tested methodologies and industry-leading research and information, we provide data-driven insights, expertise, and data products to help organizations align business strategy and performance objectives–enabling our clients to deliver on their mission, vision, and values.

INFOGRAPHIC | Pediatric Organizations: Physician and APP Workforce Trends
Dive deeper into the latest workforce trends and data!
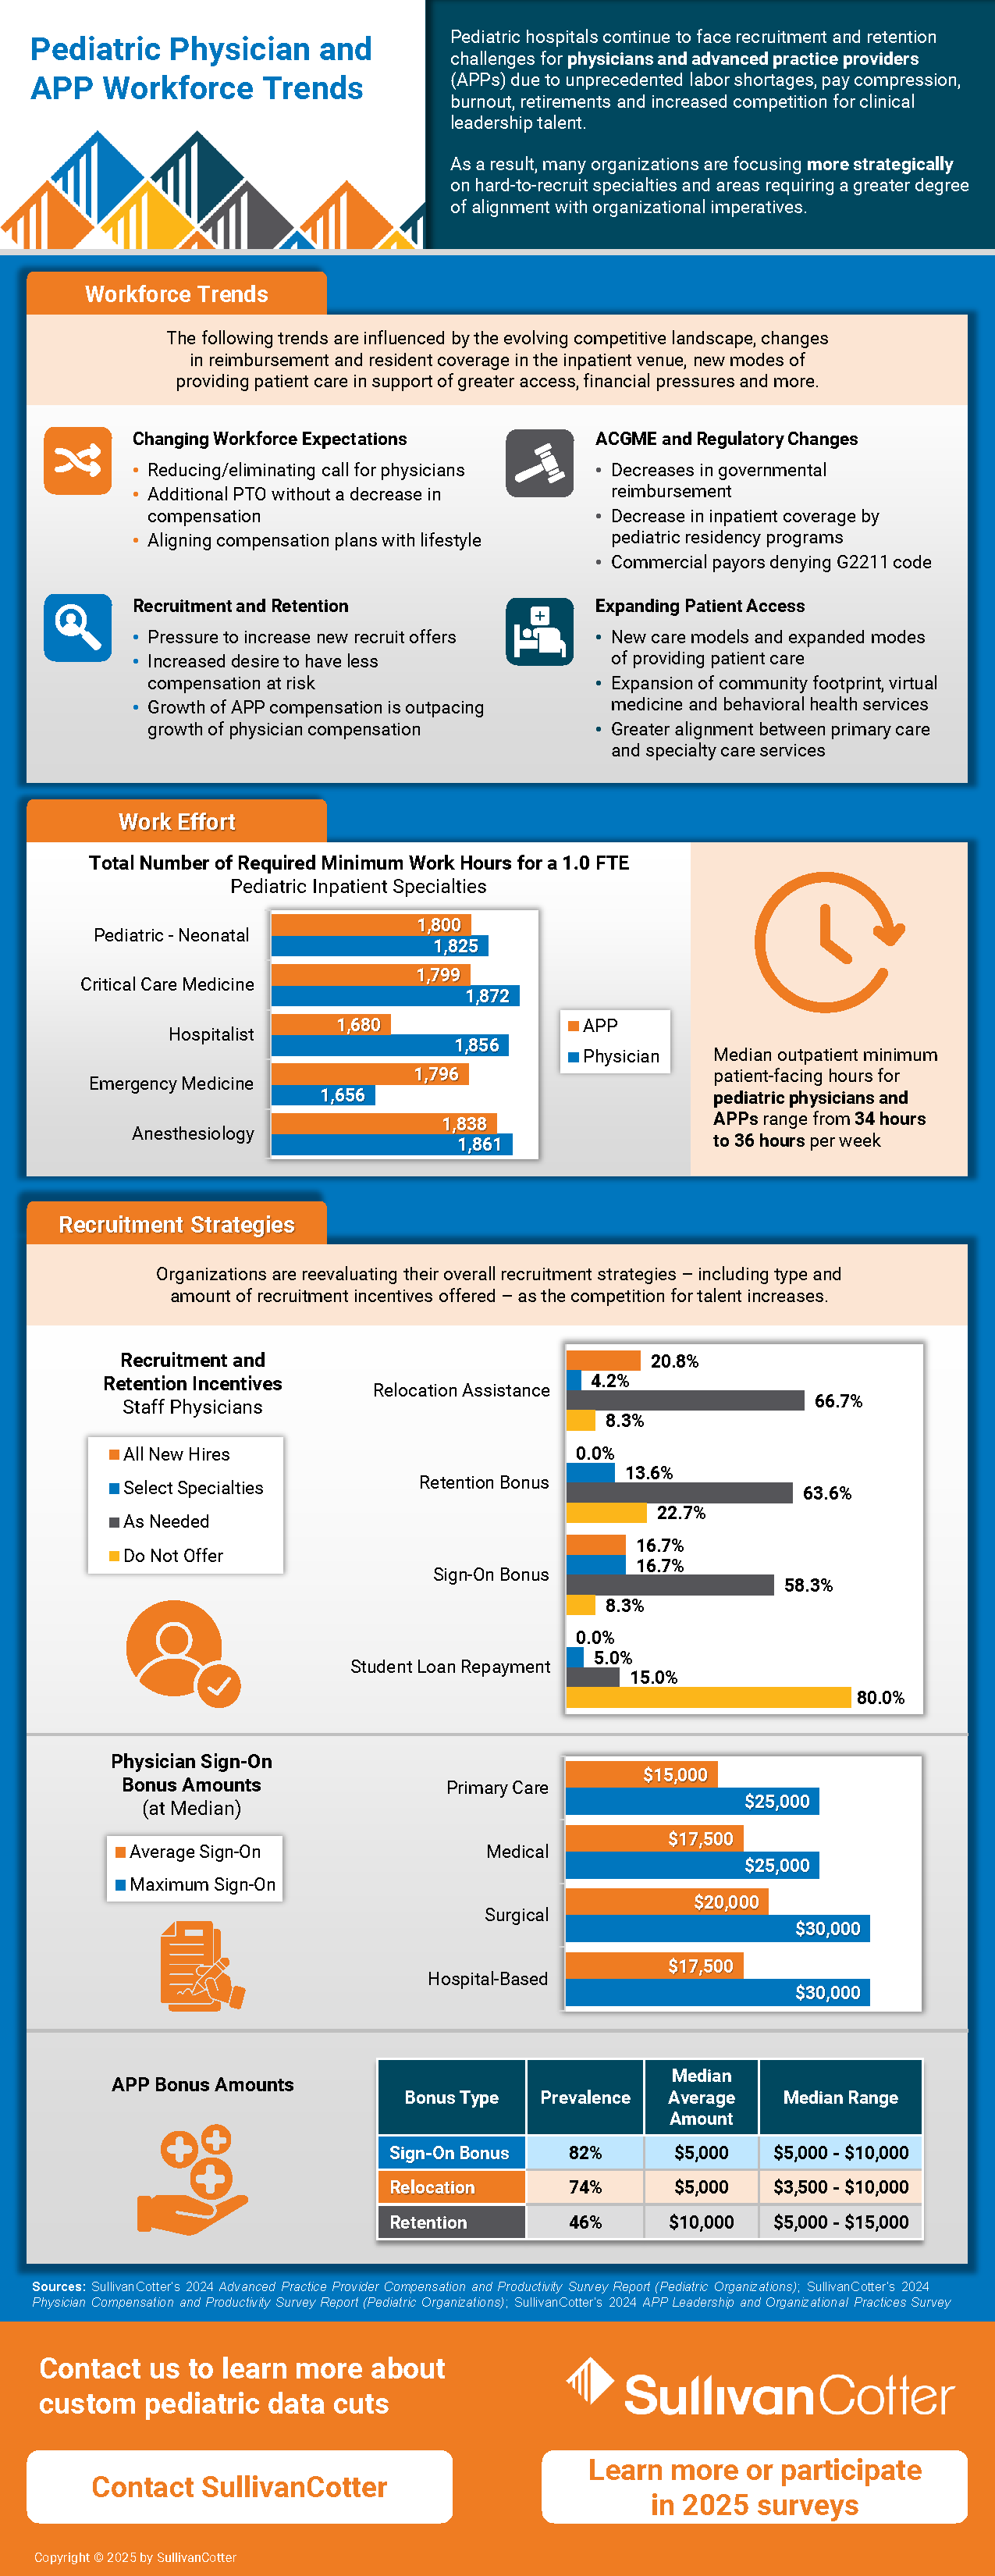
Pediatric hospitals continue to face recruitment and retention challenges for physicians and advanced practice providers (APPs) due to unprecedented labor shortages, pay compression, burnout, retirements and increased competition for clinical leadership talent. As a result, many organizations are focusing more strategically on hard-to-recruit specialties and areas requiring a greater degree of alignment with organizational imperatives.
SullivanCotter highlights some of the emerging workforce trends driving these challenges:
- Evolving workforce expectations
- ACGME and regulatory changes
- Expanding patient access
- Upward pressure on APP compensation
As a result, pediatric hospitals are reevaluating their overall clinical recruitment and retention strategies – including type and amount of incentives offered – as the competition for talent increases.
We’ve compiled the latest benchmarks on work effort and type of and amount of incentives offered to show how organizations are responding!

INFOGRAPHIC | APP Workforce Insights: Urgent Care
Learn more about APP work expectations, models of care, billing practices and more within Urgent Care settings.
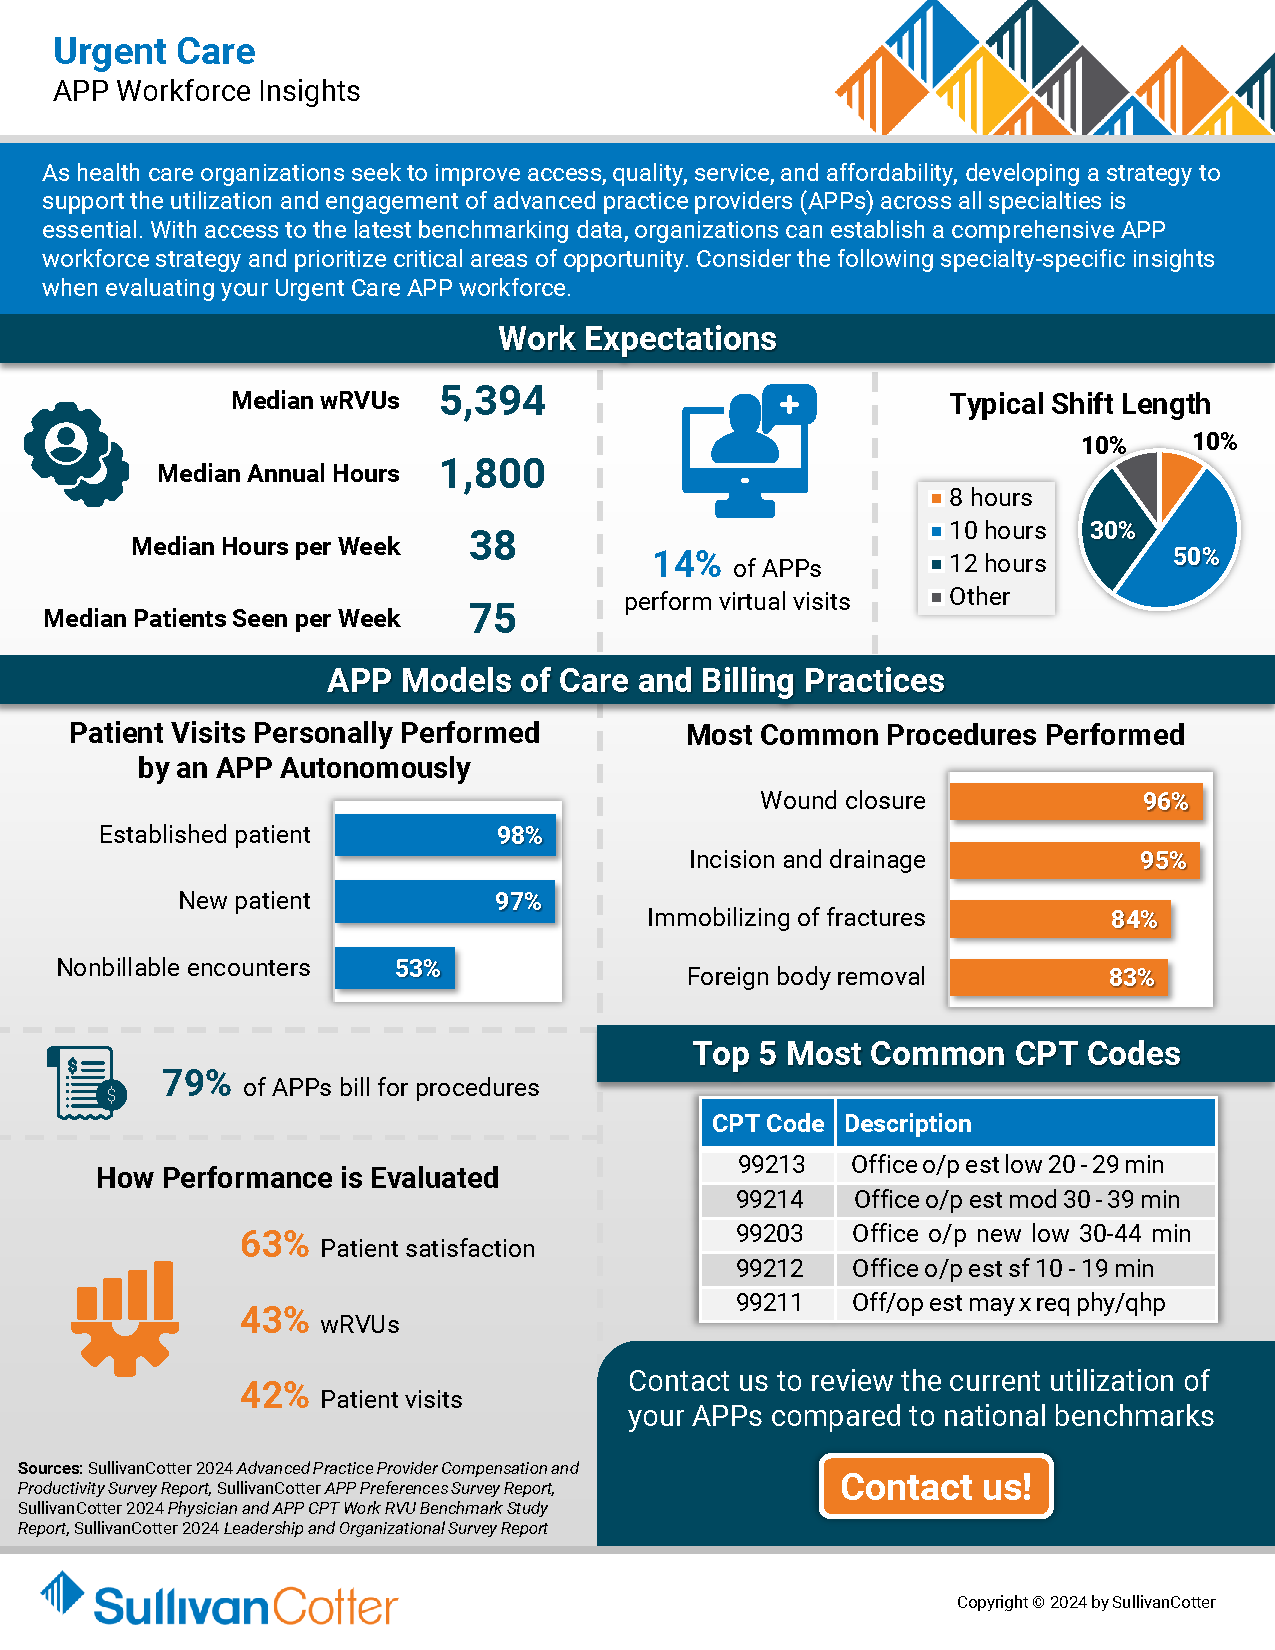
As health care organizations seek to improve access, quality, service, and affordability, developing a strategy to integrate, optimize and engage the growing advanced practice provider (APP) workforce across all specialties is essential.
Urgent care is an important pathway for patients with more immediate care needs and health concerns. With their ability to provide a more cost-effective alternative to physician visits, enhance patient access, decrease patient wait times and more, the role of APPs within this setting continues to expand.
With the latest optimization and utilization benchmarking data, organizations can establish a comprehensive APP workforce strategy and prioritize critical areas of opportunity. Consider the following specialty-specific insights into Urgent Care setting when evaluating your APP workforce.

Press Release | Median Base Pay for Registered Nurses on Track for 3%-4% Annual Increase to Close Out 2024
As critical staffing issues persist, organizations are looking for better ways to recruit and retain RNs in a competitive talent market.
JANUARY 9, 2025 – SullivanCotter, the nation’s leading independent consulting firm in the assessment and development of total rewards programs, workforce solutions, and data products for health care and not-for-profits, has released the latest benchmarks from both its 2024 Health Care Staff Compensation Survey and 2024 Registered Nursing Compensation Survey.
Collectively, these surveys report data from more than 2,400 organizations on approximately 2.2 million nurses and other clinical and non-clinical employees – representing the largest and most comprehensive health care staff compensation resource for hospitals and health systems.
Health care organizations continue to face unprecedented clinical workforce shortages. The registered nurse (RN) workforce has been hit particularly hard due to post-pandemic burnout, unfavorable working conditions, and an insufficient pipeline of future clinicians. As critical staffing issues persist, organizations are looking for better ways to recruit and retain RNs in a competitive talent market.
Although median base pay for RNs is up nationally by 3.0% according to SullivanCotter’s Health Care Staff Compensation Survey, there are variations between urban, rural, and major metro areas within each region that make it necessary for organizations to dive deeper into the data when evaluating market rates.
Differences in RN Base Pay by Location
With local labor markets being a major factor in many recruitments, it is important to understand the unique nuances of each organization’s geography. Growth in median base hourly rates for RNs is highest in the Northeast (4.8%) and North Central (4.6%) regions, dipping more than a percentage point in the West (3.5%) and Southeast (3.3%). The South Central states showed no year-over-year growth likely due to the 2023 survey results reporting the highest increases of any region.
Drilling down even further into greater metro areas reveals variation as well. When compared to the broader workforce, RN base pay has a higher geographic differential to national rates across six major metro areas. In New York City, base pay is 39% above the national median for RNs and 23% above the national median for all health care staff. This is similar for Boston at 35% and 18%, respectively. These findings indicate that using a single geographic factor for comparing national rates across the workforce in major metro areas is less effective than multiple geographic factors based on job type.
Tracking Changes in 2024
SullivanCotter’s new Registered Nursing Compensation Survey tracks trends in RN compensation on a six-month cadence. Due to external market pressures and evolving workforce trends, many organizations are assessing changes in pay, hot jobs, and movement by specialty more than once per year. The 2024 report, which includes six-month percentage change data from January – July 2024, shows that staff RNs involved in direct patient care have already seen a median increase in base pay of 2.0%. This is slightly less (1.4%) for those in indirect patient care. Both, however, are on track for annual increases of 3%-4% as 2024 comes to a close.
This survey also highlights which specialties have experienced the greatest base pay increases through July 2024. These include Critical Care, Obstetrics, Forensics, Emergency Medicine and Neonatal-Perinatal Medicine.
RN Pay Structures and Experience Pay
This new survey also provides insight into RN base pay by level and experience. Given the increasing prevalence of unionization, understanding the difference between step structures and more traditional pay structures is important to designing an effective compensation program.
Step structures are often leveraged in environments that have an increased presence of unions. Median base pay is higher nationally than in organizations without these structures, and the difference in pay from entry into the field to the final step is greater. The national median for step 1 is $42.49, while the median for less than 3 years of experience is $40.12 per hour. Advancement within a pay range also indicates higher year-over-year annual increases in step structures than traditional structures.
Considerations for 2025 and Beyond
External health care market forces continue to change how organizations are responding both strategically and operationally to recent RN workforce challenges. While pay decisions are nuanced and require a customized approach – especially based on the specific market in which each organization operates – there are several important planning considerations to take into account:
- While understanding national and regional changes in base hourly rates is important, leveraging local market data and pay differentials within major metro areas can assist in making difficult pay decisions and bolstering your competitive strategy.
- Reviewing year-over-year changes may no longer be enough when evaluating the competitiveness of base pay. With RNs often being one of the largest groups on payroll, analyzing market rates every six months will allow for more timely tracking and decision-making – especially for key nursing specialties and setting designations.
- Market movement for RNs continues to outpace that of the broader health care staff workforce. As a result, RNs often require more advanced compensation solutions to carve their workforce out as a priority and help support a more competitive recruitment, retention, and engagement strategy.
- With limited budget availability, evaluating nursing structure components such as clinical reporting relationships, spans of control, and organizational levels may help to improve productivity.
For more information on SullivanCotter’s surveys, please visit our website at http://www.sullivancotter.com/ or contact us via email or by phone at 888.739.7039.
Note to media: Additional data and interviews are available on request.
—
About SullivanCotter
SullivanCotter partners with health care and other not-for-profit organizations to understand what drives performance and improves outcomes through the development and implementation of integrated workforce strategies. Using our time-tested methodologies and industry-leading research and information, we provide data-driven insights, expertise, and data products to help organizations align business strategy and performance objectives–enabling our clients to deliver on their mission, vision, and values.

VIDEO | What is the future landscape of CRNA compensation?
The demand for CRNAs is greater than ever. Compete more effectively for talent with insights from our experts!
Learn more from our ongoing video series.
What is the future landscape of CRNA compensation?
Median total cash compensation for CRNAs has increased more than 20% in the past five years. SullivanCotter’s Sarah Kasner recently sat down to discuss emerging trends in CRNA compensation and how organizations can compete more effectively for talent as demand continues to place upward pressure on pay.
Looking for additional insight?
Dive deeper into the latest benchmarks
Round out your CRNA workforce strategy with insight into compensation, pay practices, work effort, employment status and more!

INFOGRAPHIC | 2024 CRNA Compensation and Pay Practices
CRNAs play a critical role in meeting anesthesia coverage demands.
Is your organization effectively recruiting and retaining these providers?
Gain access to important compensation and pay practices benchmarks!
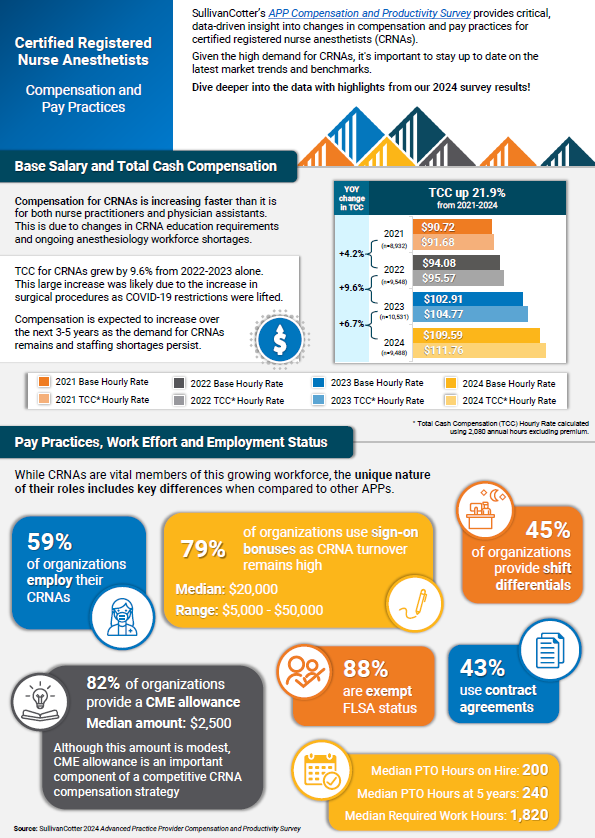
SullivanCotter’s APP Compensation and Productivity Survey provides critical, data-driven insight into changes in compensation and pay practices for certified registered nurse anesthetists (CRNAs). Given the high demand for CRNAs, it’s important to stay up to date on the latest market trends and benchmarks.
Compensation for CRNAs is increasing faster than it is for both nurse practitioners and physician assistants due to ongoing anesthesiology workforce shortages. Total cash compensation for CRNAs grew by 9.6% from 2022-2023 alone. This large increase was likely due to the growth in surgical procedures as COVID-19 restrictions were lifted. It is expected that compensation will continue to increase over the next 3-5 years as the demand for CRNAs remains and staffing shortages persist.
Learn more from the latest results – including insight into base salary, total cash compensation, pay practices, work effort, and employment status!

VIDEO | Considerations for Creating an Advanced Practice Provider Leadership Structure
Leverage the full potential of your growing APP workforce!
Learn more from our ongoing video series that provides insight into emerging workforce trends.
What is the best way to align your APP workforce with system-wide goals?
Developing a well-defined APP leadership structure can help to ensure that all APPs are integrated into existing initiatives that focus on quality of care, patient outcomes, and operational efficiency.
SullivanCotter’s Hadley Powless explains how health systems can do this more effectively!
Looking for additional insight?
Dive deeper into our APP leadership data!
Round out your APP workforce strategy with insight into four different leadership levels – including compensation, administrative time, common titles, and more.


CASE STUDY | Maximizing Value-Based Reimbursement
Looking to align compensation more effectively with payer contracts and incentives?
Learn how a large not-for-profit health system partnered with SullivanCotter to improve its value-based reimbursement strategy.
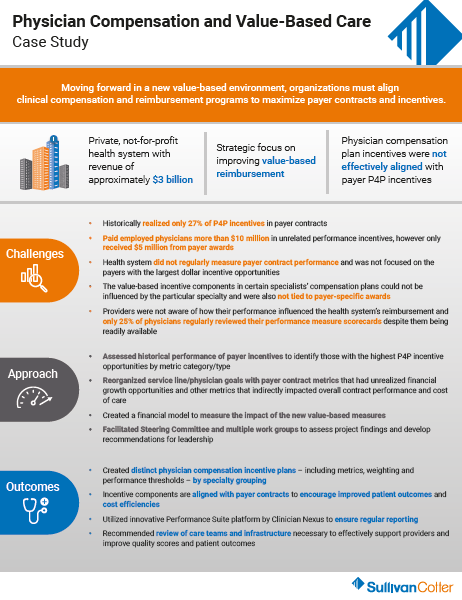
Moving forward in a new value-based environment, health care organizations must align clinical compensation with reimbursement programs to maximize payer contracts and incentives.
However, this approach can be difficult to navigate without the data-driven insights and expertise needed to inform strategic compensation design.
Discover how SullivanCotter helped a client to improve its value-based reimbursement strategy by:
- Creating distinct physician compensation plans by specialty grouping
- Aligning incentives with payer contracts to improve patient outcomes and cost efficiencies
- Ensuring regular reporting through the Clinician Nexus platform
- …and more!
View the case study for greater insight into this organization’s challenges, our approach, and the outcomes!

How Pomona Valley Hospital Medical Center Developed a More Strategic Approach to Physician Recruitment
Leveraging Data-Driven Insights and Expertise to Enhance Physician Recruitment
THE SITUATION
Pomona Valley Hospital Medical Center (PVHMC), a 427-bed not-for-profit community hospital in Southern California, faced the challenge of effectively managing its physician recruitment efforts. As a standalone medical center, it was vital for the hospital to maintain a robust physician network while navigating California laws that prevent direct employment of physicians. The hospital also needed to ensure that its recruitment strategies would be data-driven for validation purposes and compliant with regulatory requirements.
Before partnering with SullivanCotter, the hospital relied on physician-to-population rates published by an external vendor to assess physician supply and demand in its market. Leveraging this data was a manual, labor-intensive process, and the information required greater accuracy and in-depth analysis to make informed decisions and validate recruitment needs. A more efficient approach was necessary.
Accessing the right data and analytical tools would enable the hospital to anticipate community needs and plan, justify, and execute its recruitment initiatives more efficiently. The hospital required a sophisticated solution that could help support this strategy and maintain legal compliance throughout each step of the recruitment process.
THE APPROACH
PVHMC turned to SullivanCotter’s Provider Needs Assessment (PNA), an interactive cloud-based application, to address its recruitment challenges and reach its goals. Several hospital leadership team members, including the Vice President of Administration, the Vice President of Ambulatory Services, and the Executive Director of Planning, collaborated with SullivanCotter’s consultants to implement the PNA.
The PNA provided PVHMC with a comprehensive analysis of physician supply and demand in its service area, including detailed data on the composition and practice patterns of the local physician community. This enabled the hospital to validate the need for specific physician specialties and ensure its recruitment efforts aligned with community health needs.
The hospital’s cross-functional team worked with SullivanCotter’s consultants to customize the PNA data and insights to focus on the hospital’s unique market dynamics and strategic priorities. This collaborative approach allowed PVHMC to leverage the expertise of SullivanCotter while ensuring the information gathered was personalized.
“The PNA lifted a significant burden by giving us more precise, data-driven insights into our physician community and their practice patterns. It became essential in ensuring compliance and strategically justifying the recruitment of key specialties, allowing us to make informed decisions that align with our community’s health needs,” said Leigh Cornell, Vice President of Administration, PVHMC.
OUTCOMES
Implementing the PNA has helped PVHMC improve its operational efficiency and overall recruitment strategy in several ways:
- The hospital now has access to data-driven insights that enable it to make informed recruitment decisions while remaining compliant. The PNA allows for more robust assessments of physician supply and demand, helping to validate recruitment initiatives with the leadership team and board of directors.
- The hospital developed a more strategic approach to physician recruitment. It can identify potential gaps in physician coverage and better engage with community physicians to understand their practice plans and expansion opportunities.
- SullivanCotter’s PNA offers a more in-depth analysis of the local physician market. SullivanCotter’s PNA captures the full complexity of physician supply and demand. The hospital can now identify physicians who only practice part-time in the service area or have satellite offices outside the primary service area. This provides a more accurate picture of physician availability and assists in recruitment.
“If I needed to recruit physicians, I would use the tool to indicate if we have justification and to show our leadership and CEO. We would see the list of physicians in our community and determine who we need to learn more about or see if there’s an opportunity before we recruit to understand and engage with that physician. We can see if there’s an opportunity either for them to expand their practice or for them to come to us, or if there are barriers to such,” Cornell added.
LESSONS LEARNED
The PVHMC case study offers several lessons for organizations considering a PNA:
- Dedicate time and resources: Engaging cross-functional stakeholders and ensuring they understand the data’s implications is essential for maximizing its value. This investment enables more informed decision-making and a stronger alignment with organizational goals.
- Customize the data to fit organizational needs: While the PNA provides a strong foundational framework, working closely with SullivanCotter’s consultants to tailor the data to your specific market dynamics is critical. This customization involves identifying relevant service area ZIP codes, securing accurate affiliation and employer data, and actively working with the information to build confidence.
- Shift to proactive decision-making: PVHMC transitioned from a reactive recruitment strategy to a more proactive one by embedding the PNA into its strategic planning process. This shift enabled the hospital to anticipate and address physician shortages and community health needs more effectively rather than reacting to gaps as they occurred.
- Use data to validate recruitment efforts: The PNA’s detailed analysis offers clear, data-driven justification for recruiting specific physician specialties. This helps secure the support of key stakeholders, such as leadership teams and boards of directors, and ensures alignment between recruitment initiatives and the broader organizational strategy.
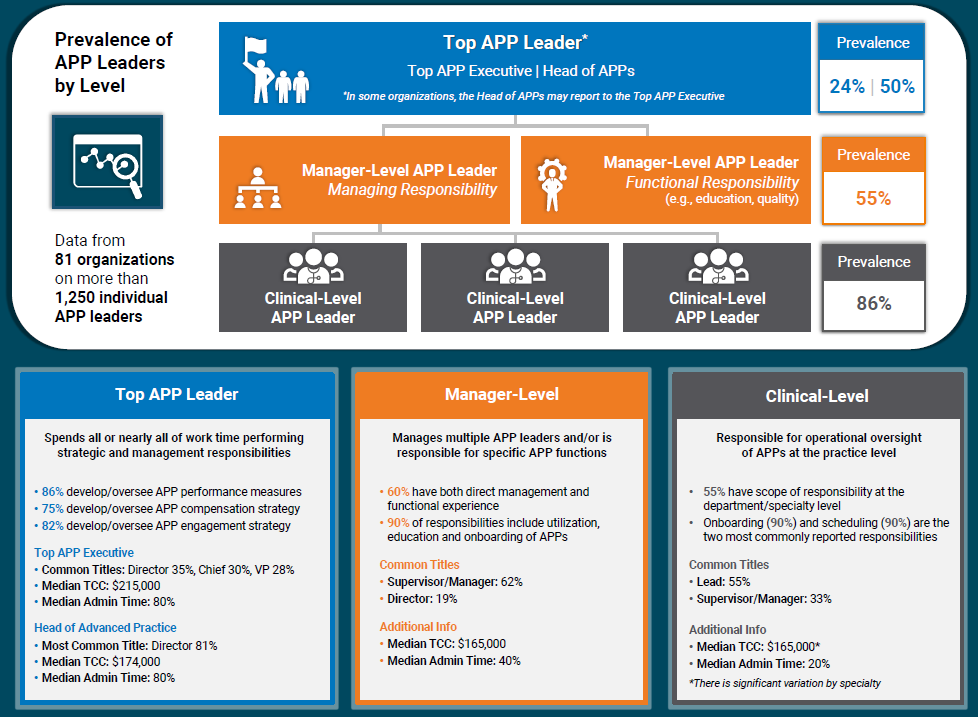
INFOGRAPHIC | APP Leadership Structures Can Support Retention and Engagement
Advanced practice providers are integral to effective and efficient health care delivery.
Enhancing your APP leadership structures can help to support APP engagement, workforce planning, recruitment and retention, and greater alignment with physician workforce strategies.
SullivanCotter research shows that the presence of an APP leader is associated with 2% less turnover. With the direct cost of turnover estimated to exceed $120,000 per APP, this can have a significant financial impact on an organization. Additionally, many organizations are looking to have greater consistency in APP leadership leveling, compensation, and administrative time – and require access to the right data in order to address this.
Dive deeper into the data with our latest infographic! SullivanCotter’s APP Leadership and Organizational Survey – which contains data from more than 81 organizations on more than 1,250 individual APP leaders – reports on four different leadership level, including clinical-level, management-level, head of advanced practice, and top APP executive. This includes compensation data, common titles, administrative duties and more.

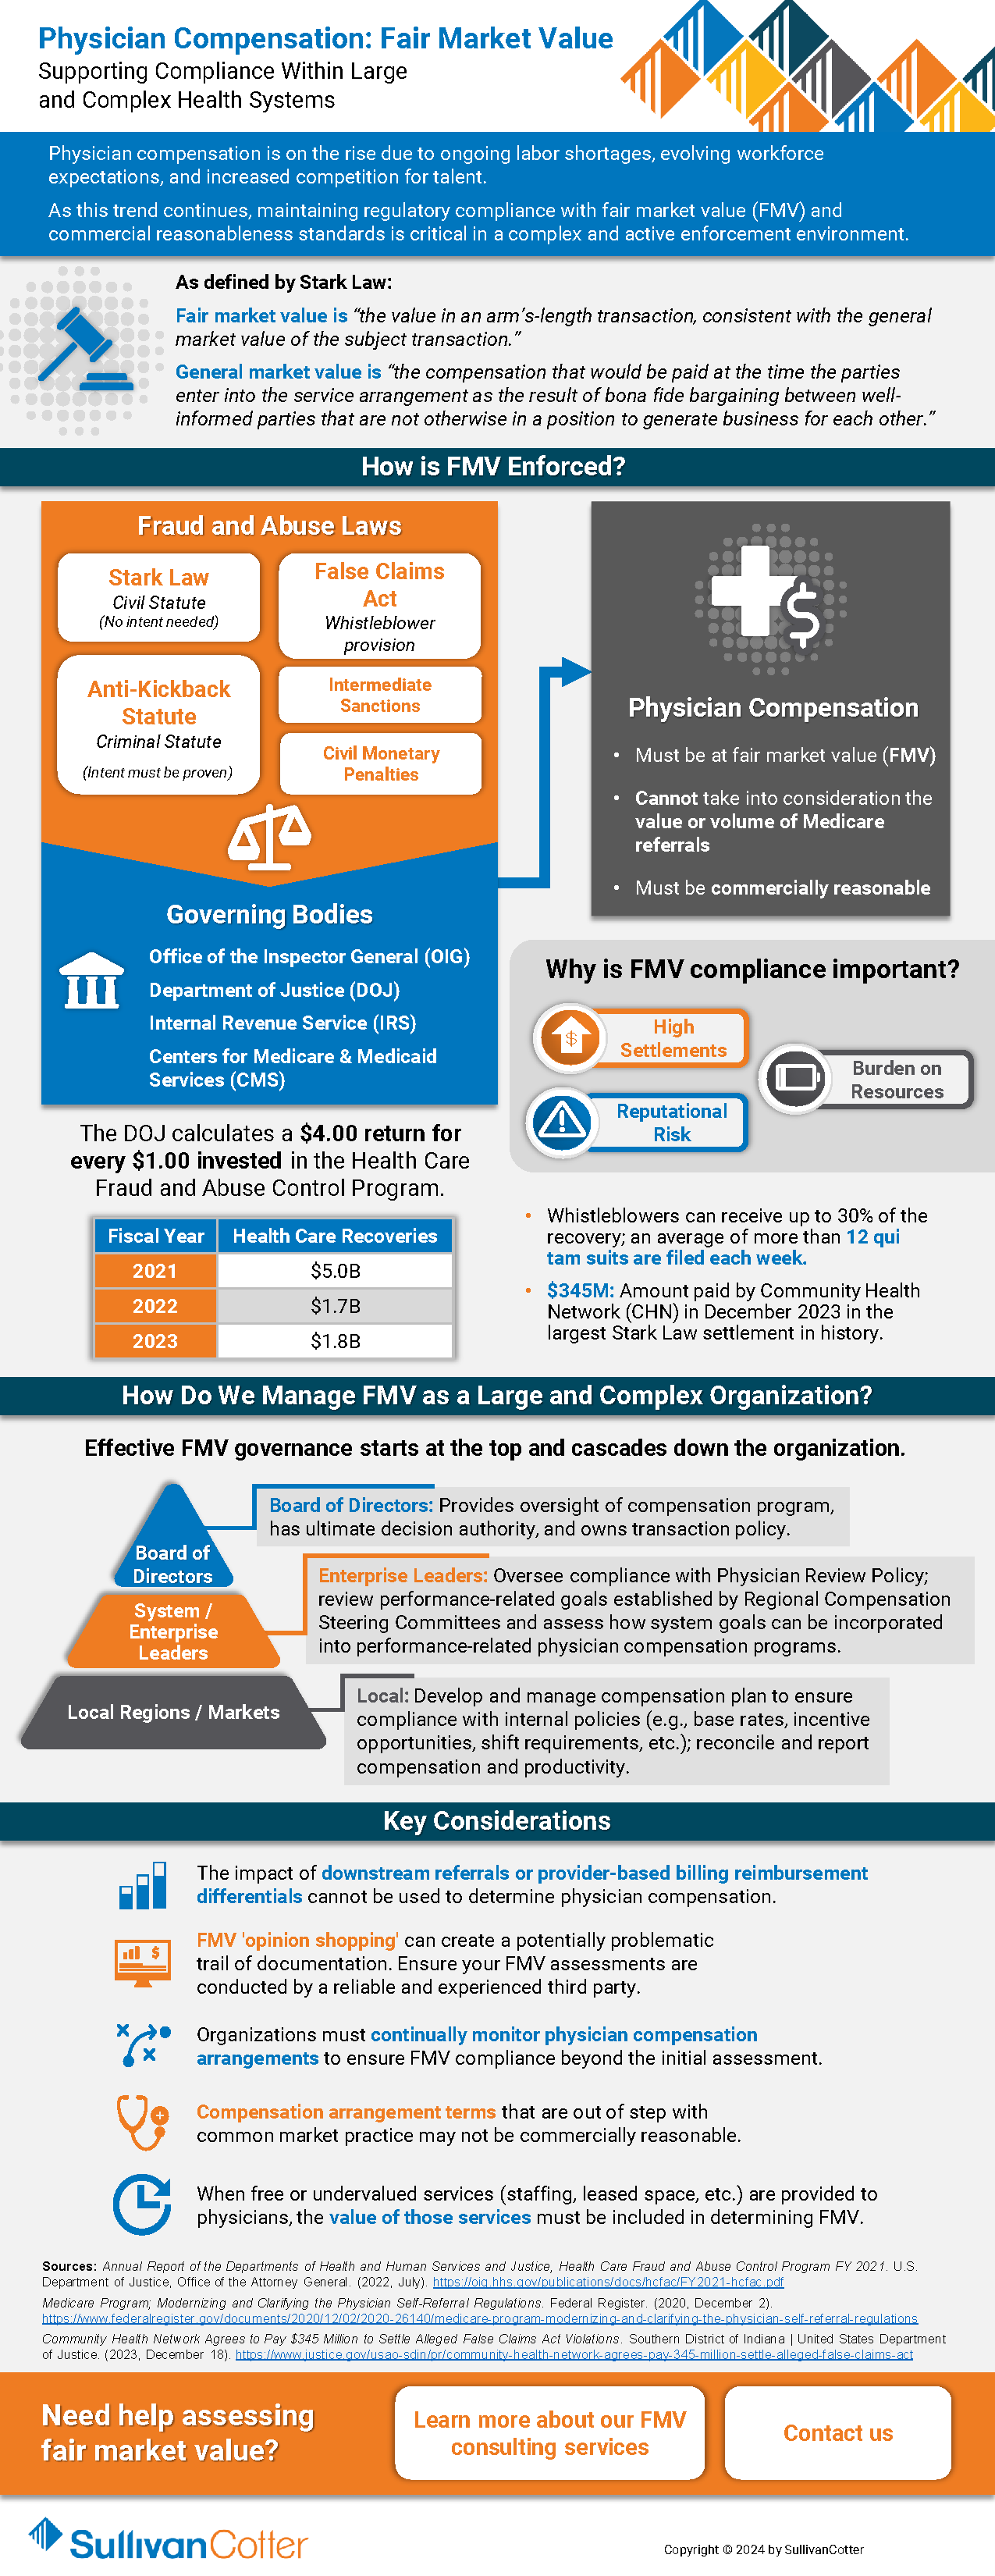
Fair Market Value: Supporting Compliance Within Large and Complex Health Systems
Physician compensation is on the rise due to ongoing labor shortages, evolving workforce expectations, and increased competition for talent.
As this trend continues, maintaining regulatory compliance with fair market value (FMV) and commercial reasonableness standards is critical in a complex and active enforcement environment.
Health care organizations must have the appropriate structures in place to help mitigate financial, resource and reputational risk for potential physician compensation violations related to the Stark Law, the Anti-Kickback Statute and IRS not-for-profit regulations.
Download our latest overview to gain greater insight into the following questions:
- How FMV is enforced?
- Why is FMV compliance important?
- How can we manage FMV as a large and complex health care organization?
- What are some of the key considerations and best practices for supporting compliance?

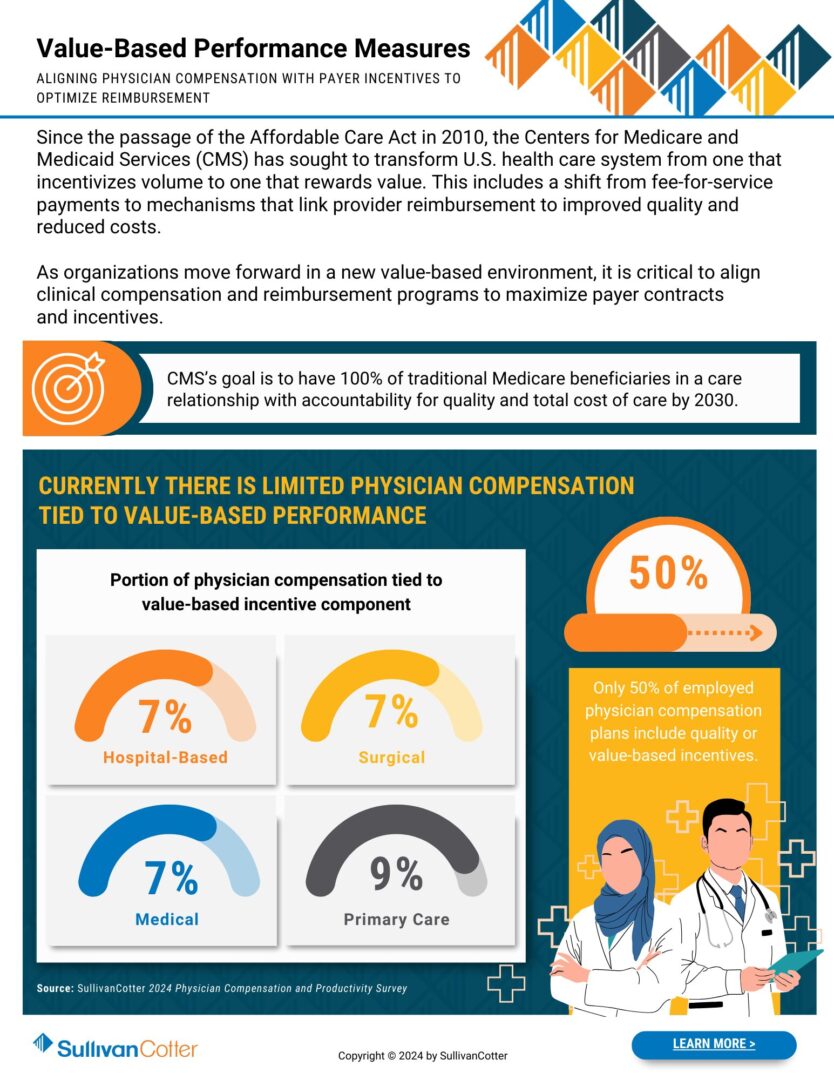
INFOGRAPHIC | Value-Based Performance Measures
Optimize reimbursement by aligning physician compensation more closely with value-based payer incentives.
Since the passage of the Affordable Care Act in 2010, the Centers for Medicare and Medicaid Services (CMS) has sought to transform the U.S. health care system from one that incentivizes volume to one that rewards value. This includes a shift from fee-for-service payments to mechanisms that link provider reimbursement to improved quality and reduced costs.
As organizations move forward in a new value-based environment, it is critical to align clinical compensation and reimbursement programs to maximize payer contracts and incentives.
CMS’s goal is to have 100% of traditional Medicare beneficiaries in a care relationship with accountability for quality and total cost of care by 2030.
Where does your organization stand?
Download our infographic to learn more about incorporating value-based performance measures into your design process.

Forbes | Fixing Health Equity and Access: Is Collaboration the Answer?
Fixing Health Equity and Access: Is Collaboration the Answer?
Health systems must be adequately funded, staffed, and designed to support health equity across today’s diverse population populations.
Building and staffing health systems have historically relied on supply-and-demand metrics: determine the health profile of a community and hire the appropriate staff to match the care needs of the population.
But that equation no longer adds up.
The industry is experiencing large gaps in care and patient access admist ongoing labor shortages – all of which are hindering health equity programs.
How can we enact real change?
Recently featured in Forbes, SullivanCotter’s President and CEO, Ted Chien, highlights how tax-exempt health care organizations must band together to:
- Modernize our health care system to secure a stable and high-performing workforce
- Gather comprehensive data to help prioritize initiatives and develop strategies that mutually benefit systems and patients.
- Maintain accountability through setting standard performance measures and benchmarking progress against them

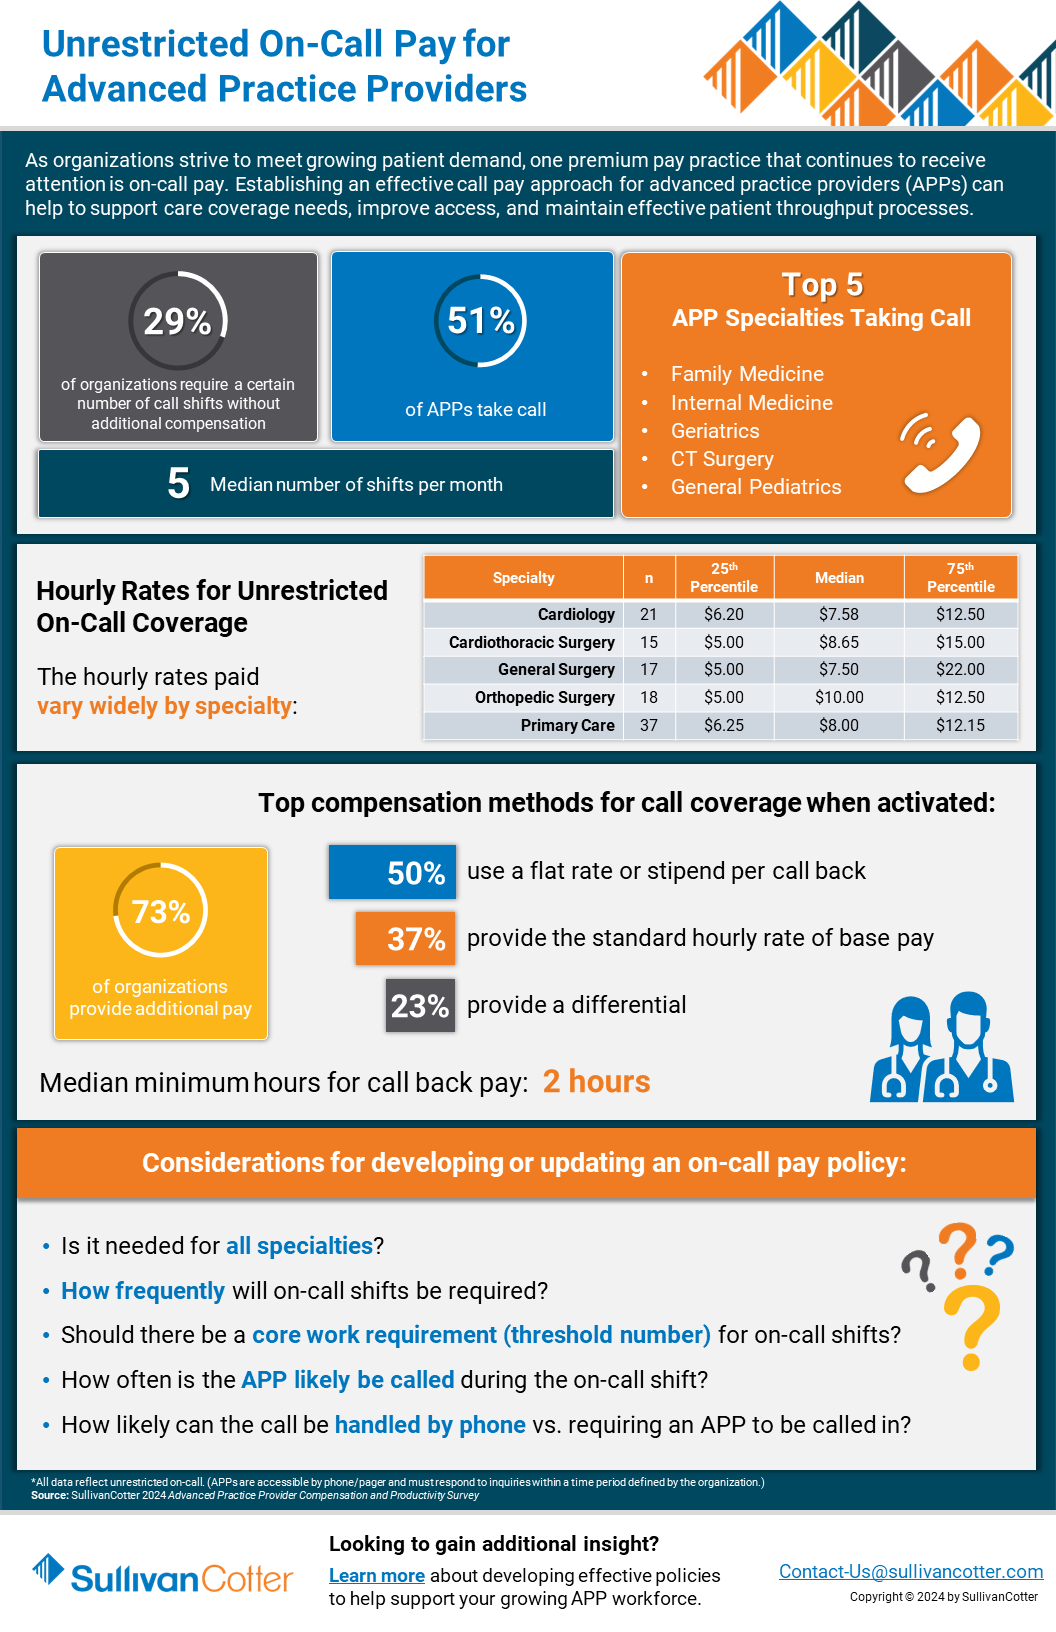
INFOGRAPHIC | APP Unrestricted On-Call Pay
Revisit your call pay program with access to the latest benchmarks!
Establishing a comprehensive call pay approach for advanced practice providers (APPs) can help to support care coverage needs, improve patient access, and maintain effective throughput.
As organizations strive to meet growing patient demand, one premium pay practice that continues to receive attention is on-call pay. Many health systems are revisiting their on-call pay structures to better meet the needs of their patients. Implementing an effective APP on-call pay strategy can incentivize providers and improve access to care, throughput, and care coverage within your organization.
Is your current approach missing the mark?
Develop a more competitive strategy with data-driven insight into hourly coverage rates, top compensation methods, key considerations for adjusting on-call pay, and more.
Download our infographic – which features highlights from SullivanCotter’s 2024 APP Compensation and Productivity Survey – to learn more!