The health care industry continues to grapple with ongoing workforce challenges…
Current health care workforce challenges are causing organizations to reassess the size and shape of their employee population in an effort to address staffing challenges, meet evolving care needs, and drive greater efficiency.
Leverage data from SullivanCotter’s Workforce Metrics Benchmarks Survey to see how the size and shape of your employee population compares to other hospitals and health systems nationwide. The data is reported across four different career stages with insight into changes based on the number of full-time equivalents.
What are some of these challenges that organizations are experiencing?
WORKFORCE TRENDS
- Limited availability of qualified talent
- Increasing turnover rates and industry departures
- Competition for talent outside of health care
- Employee upskilling, re-skilling, and career shifts
- Use of analytics for decision-making
INDUSTRY TRENDS
- Shortages of health care professionals
- Pressure on financial performance
- Increased workload and burnout
- Changing workforce skill requirements
- Access to health care services
Need a quick summary?
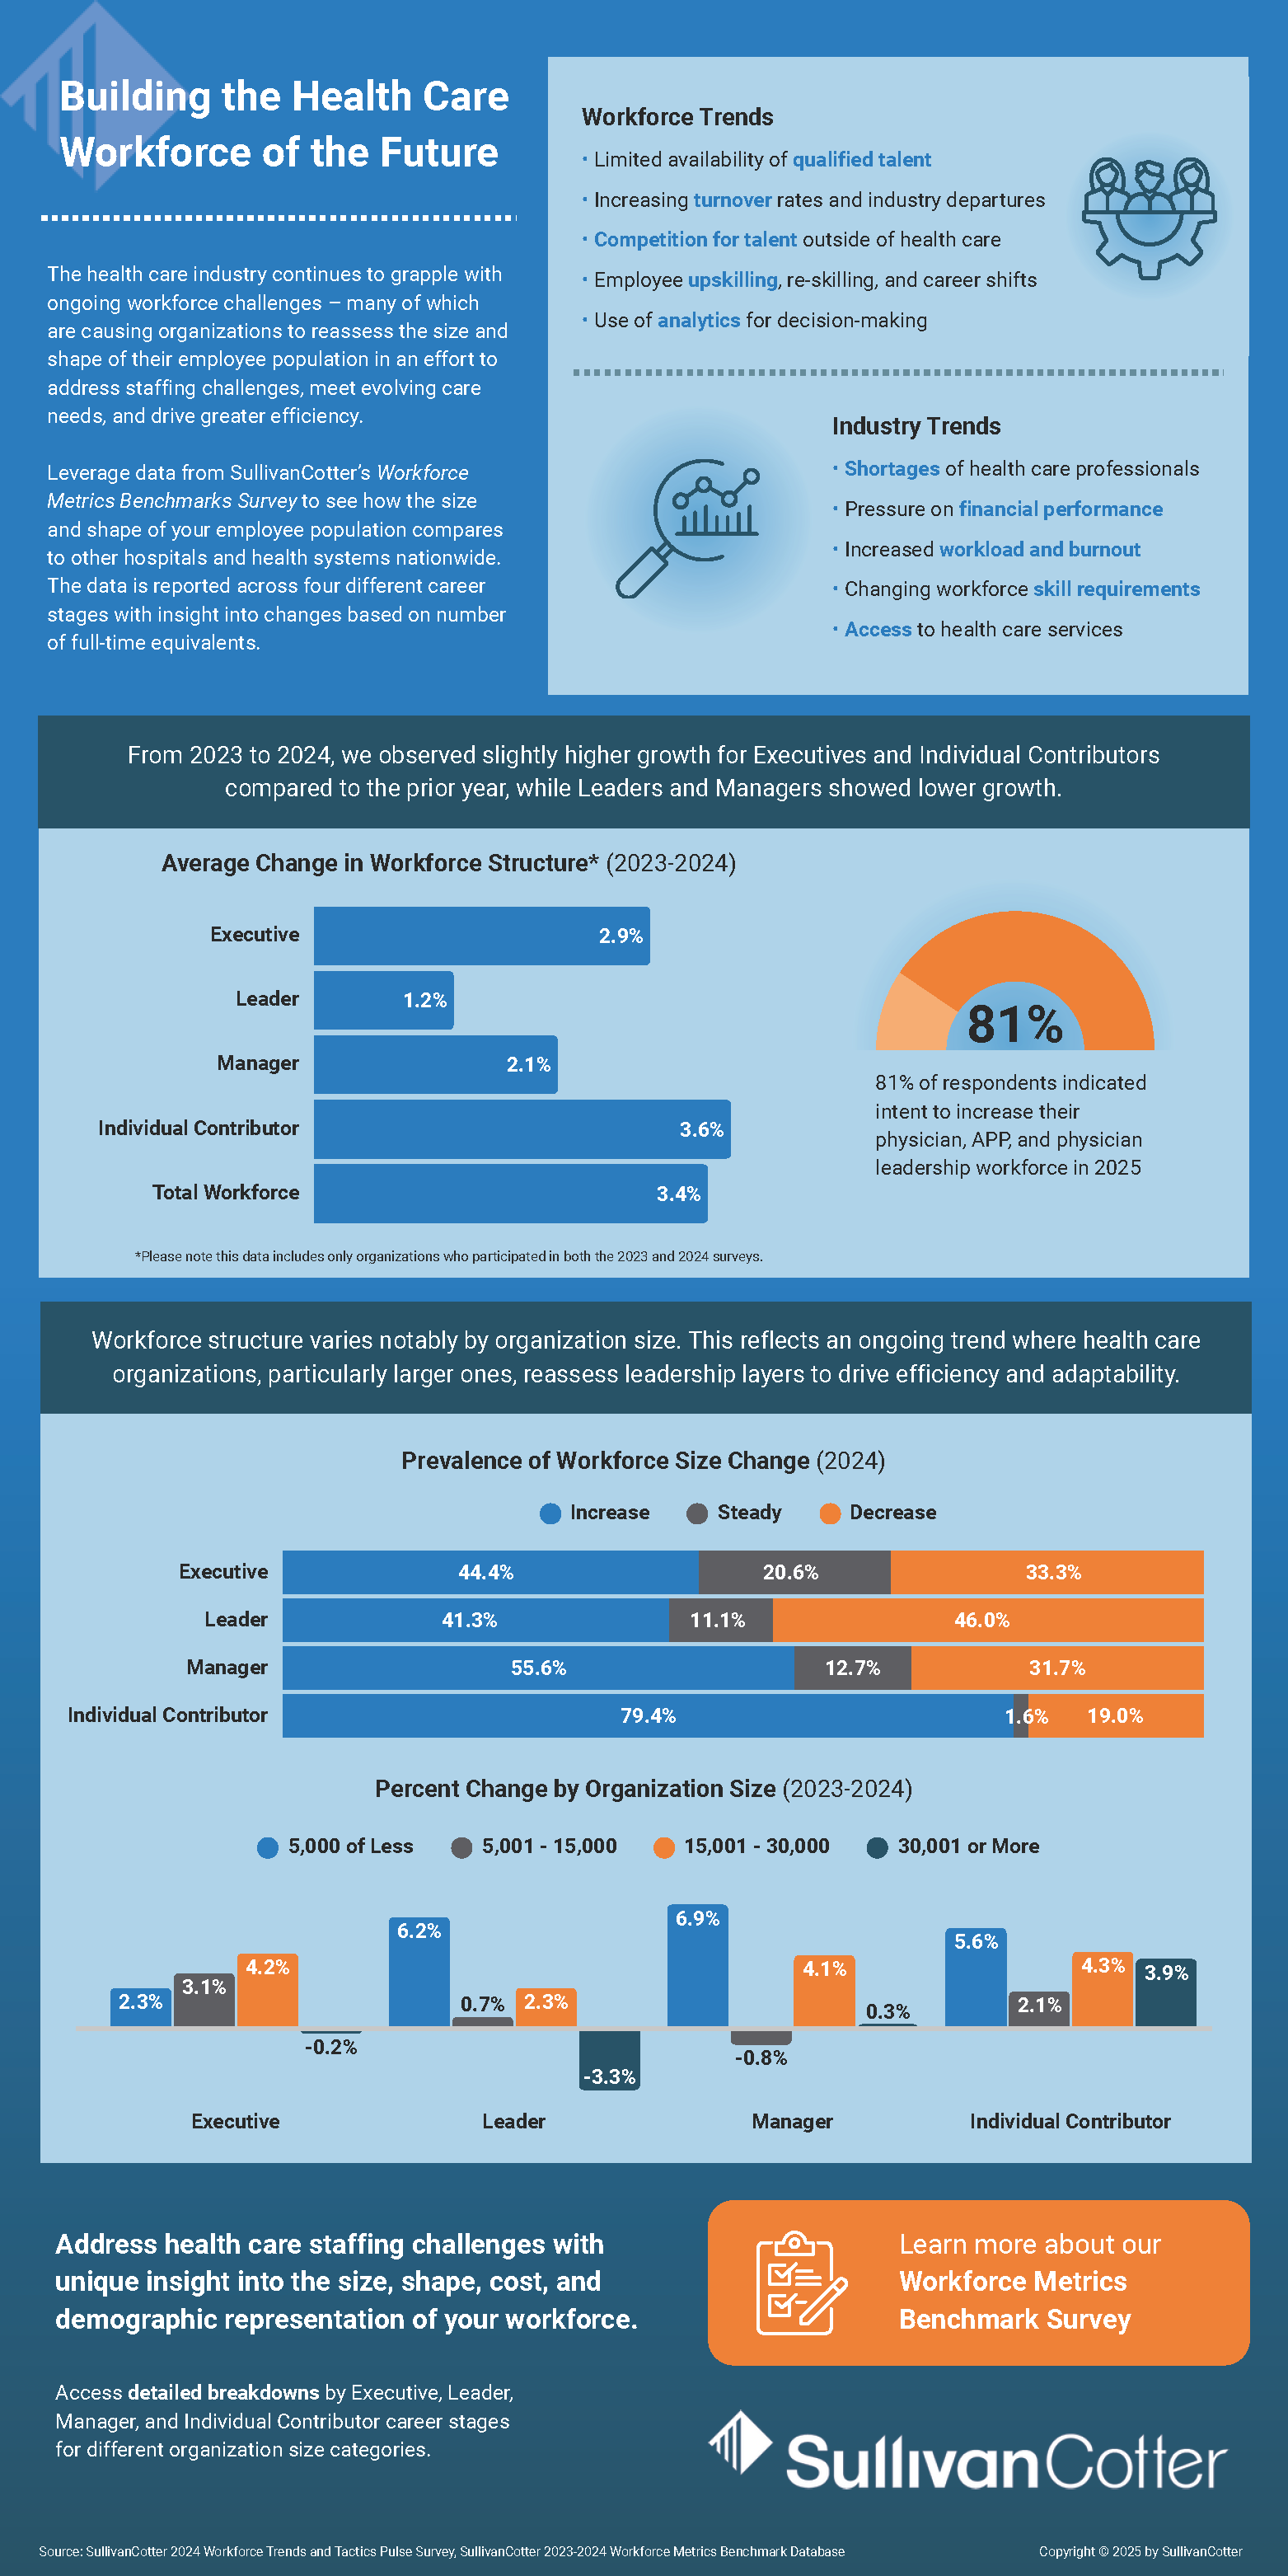
From 2023 to 2024, the industry observed slightly higher growth for Executives and Individual Contributors compared to the prior year, while Leaders and Managers showed lower growth.
The average change in workforce structure from 2023-2024 consisted of:
- 2.9% for Executives
- 1.2% for Leaders
- 2.1% for Managers
- 3.6% for Individual Contributors
- 3.4% for the Total Workforce
Workforce structure varies notably by organization size. This reflects an ongoing trend where health care organizations, particularly larger ones, reassess leadership layers to drive efficiency and adaptability.
The prevalence of workforce size change in 2024 includes:
- 44.4% of organizations have increased the size of their Executive workforce, 20.6% hold steady, and 33.3% saw a decrease.
- 41.3% of organizations have increased the size of their Leader workforce, 20.6% hold steady, and 46.0% saw a decrease.
- 55.6% of organizations have increased the size of their Manager workforce, 12.7% hold steady, and 31.7% saw a decrease.
- 79.4% of organizations have increased the size of their Individual Contributor workforce, 1.6% hold steady, and 19.0% saw a decrease.
Learn more about our Workforce Metrics Benchmark Database!
Address health care staffing challenges with unique insight into the size, shape, cost, and demographic representation of your workforce.
The survey includes workforce data across 10 job families, six career-level categories and three demographic groupings to provide comprehensive insight into the following metrics:
- SIZE: Number of full-time equivalent head count
- SHAPE: Career stage distribution of full-time head count
- COST: Annualized base payroll expense of the full-time equivalent head count
- DEMOGRAPHICS: Gender, ethnicity and generational representation
- OVERSIGHT: Management direct span of control
The above workforce metrics are reported for each of the job families and career stages listed below. The survey report includes quantitative market positioning statistics, including the 25th, 50th and 75th percentiles. Data are reported for all organizations and by employee size groupings.
- SUPPORT JOB FAMILIES: Facilities, finance, human resources, legal and compliance and information technology
- CLINICAL FAMILIES: Ancillary services, care management, emergency medical services, nursing and technical medical services
- CAREER STAGES: Executive, leader, manager, exempt and nonexempt individual contributors