As health care organizations and other not-for-profit institutions such as higher education, public charities and private foundations operate under increasingly narrow financial margins, the pressure to optimize service and efficiency to help advance their mission, vision and values continues to grow.
Investments in talent remain a significant component of an organization’s cost structure, and human resources executives must align employee compensation strategies with long-term strategic objectives to enable them to effectively serve their communities.
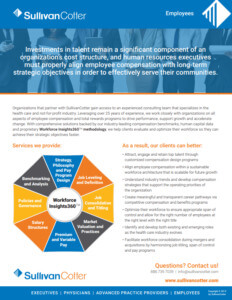
Organizations that partner with SullivanCotter gain access to experienced health care and not-for-profit consulting teams on all aspects of employee total compensation and rewards practices, and insights that support organizational change. Our comprehensive and integrated workforce solutions, which also include physician, advanced practice provider (APP) and executive compensation and performance strategies, are supported by our industry-leading compensation and human capital data, helping our clients evaluate and enhance their workforce strategies so they can achieve their objectives faster.
As a result, our clients can better:
- Attract, engage and retain top talent through customized compensation design programs
- Align employee compensation within a sustainable workforce architecture that is scalable for future growth
- Understand industry trends and develop compensation strategies that support the operating priorities of the organization
- Create meaningful and transparent career pathways via competitive compensation and benefits programs
- Recruit registered nurses in an increasingly competitive market for talent
- Enhance their workforce strategies to ensure appropriate span of control and allow for the right number of employees at the right level with the right title
- Identify and develop both existing and emerging roles as the health care industry evolves
Related Information
Related Resources
Nothing found.