Workforce Metrics Benchmark Survey
Are current health care workforce staffing challenges impacting your organization’s ability to care for patients?
Maintaining operations and helping to ensure financial sustainability in an uncertain market remains a top priority for hospitals and health systems nationwide. Effectively managing the size, shape and complexity of the workforce remains a key initiative and, as organizations look to the future, there are a number of critical workforce planning questions to address:
- How do your labor costs stack up against other health care organizations?
- How does your salary expense distribution across different job families and job levels impact your costs?
- Do you understand the diversity of your employee population as represented across race/ethnicity, gender and other demographic characteristics?
- Do your leadership structures effectively support the organization’s most important asset – the clinical workforce?
About the Survey
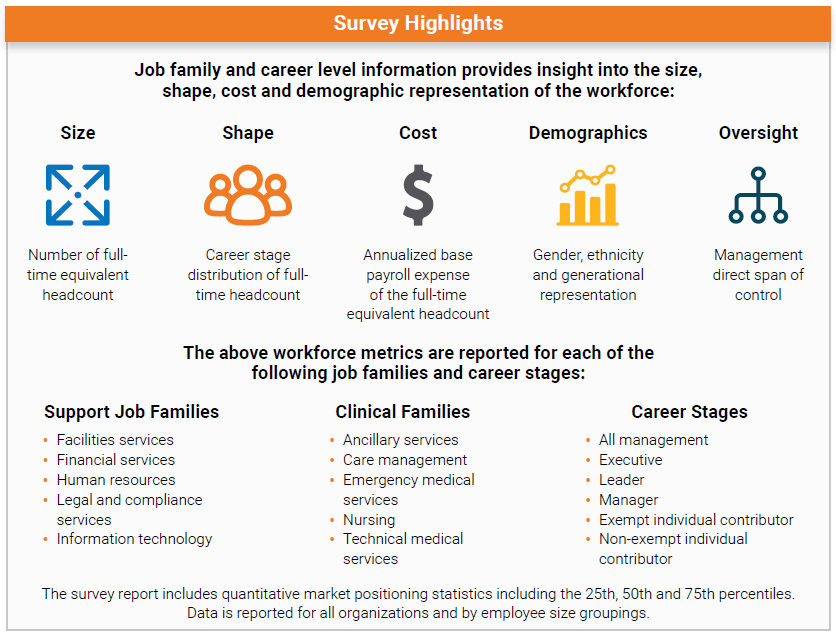
The survey includes workforce data across 10 job families, six career-level categories and three demographic groupings to provide comprehensive insight into the following metrics:
- SIZE: Number of full-time equivalent head count
- SHAPE: Career stage distribution of full-time head count
- COST: Annualized base payroll expense of the full-time equivalent head count
- DEMOGRAPHICS: Gender, ethnicity and generational representation
- OVERSIGHT: Management direct span of control
The above workforce metrics are reported for each of the job families and career stages listed below. The survey report includes quantitative market positioning statistics, including the 25th, 50th and 75th percentiles. Data are reported for all organizations and by employee size groupings.
- SUPPORT JOB FAMILIES: Facilities, finance, human resources, legal and compliance and information technology
- CLINICAL FAMILIES: Ancillary services, care management, emergency medical services, nursing and technical medical services
- CAREER STAGES: Executive, leader, manager, exempt and nonexempt individual contributors
Dive deeper into the data!
View an on-demand webinar in which SullivanCotter dives deep into some of the 2024 survey results, discusses important year-over-year trends and highlights key practices and insights from some of our many client engagements.
Health care organizations are in an ongoing workforce crisis, and they continue to struggle with high turnover, employee burnout, wage pressure and other recruitment and retention challenges – utilize data from the survey results to help consider the relationships between workforce design, talent, compensation and performance management.
Learn About Our Full Survey Suite
Gaining access to the right data is paramount. SullivanCotter’s proprietary survey data provides the intelligence and insights you’ll need to confidently navigate the compensation journey and make highly-informed decisions.
Enhanced Report Delivery
This year’s compensation and pay practices benchmarks will continue to be delivered via SullivanCotter’s web-based Benchmarks360™ product suite — providing users with self-serve analytics dashboards for their unique reporting needs.
Workforce Metrics Benchmark Survey
Contribute to Gain Participation Privileges
Your participation ensures that your data are part of this valuable resource, providing you with robust, comprehensive information used by health care organizations across all market segments. In addition, participants receive exclusive, discounted pricing on valuable data and reports and early access to survey results.
Participation in our surveys is made easy through our online data collection tool
Report Pricing (*Based on Organization Size – FTEs)
The latest report contains workforce data from 82 health care organizations representing a combined workforce of more than 1.5 million FTEs across 19 job families.
Data Member (3 years)
- 1,000 – 5,000 FTEs: $2,950
- 5,001 – 10,000 FTEs: $3,950
- Greater than 10,000 FTEs: $4,950
Nonparticipant (1 year)
- Less than 1000 FTEs: $975
- 1,000 – 5,000 FTEs: $2,975
- 5,001 – 10,000 FTEs: $3,975
- Greater than 10,000 FTEs: $4,975
If you have any questions about the survey, please contact our Survey Team by phone at 888.739.7039 or by email at surveys@sullivancotter.com.