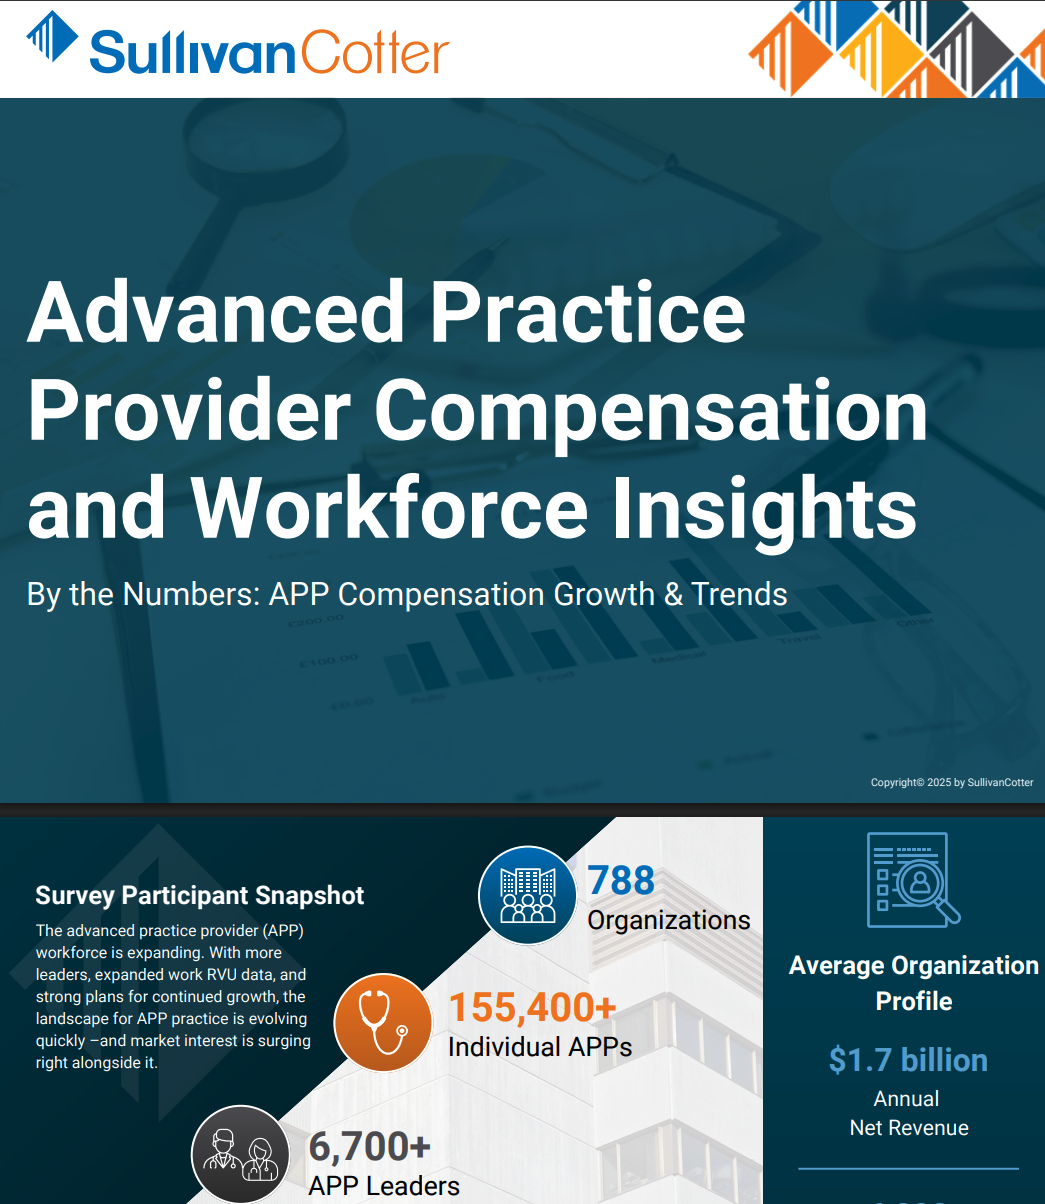
The APP workforce is evolving – and so is the way they’re paid.
What changes are you seeing in your market?
Findings from our 2025 APP Compensation and Productivity Survey indicate that pay levels for nurse practitioners (NPs) and physician assistants (PAs) are beginning to stabilize, with signs of compression across specialties, following several years of significant growth.
This year’s data reveals that hospital-based specialties experienced the largest year-over-year increases in both median base salary and total cash compensation (TCC) – rising 6.2% and 5.7%, respectively. In comparison, primary care specialties saw TCC growth of 4.0%, while medical (2.8%) and surgical specialties (2.4%) recorded more modest gains.
The report also highlights changes in wRVUs, examines the competitive landscape for anesthesiology providers, and details how organizations are leveraging premium pay, additional shift compensation, and incentive programs to strengthen recruitment and retention.
Explore the data firsthand and visualize the insights that matter most to your organization!
Need a quick summary?
VARIATIONS IN APP COMPENSATION
- When compared to the national median, APP total cash compensation (TCC) differentials are greatest in the West (113%) and Northeast (105%), largely reflecting high cost-of-living markets such as the Bay Area, Seattle, Boston, and New York.
- These differentials are lowest in the Southeast (95%) and South Central (99%).
- TCC in urban locales matches the national median. This is less in suburban (95%) and rural (92%) locations.
BASE AND TOTAL CASH COMPENSATION
- APP compensation growth shows signs of stabilizing after years of steep increases.
- Median hourly rates for NP/PAs combined grew most for hospital-based specialties (5.7%) from 2024-2025 and least for surgical specialties (2.4%).
- However, primary care specialties have seen the greatest growth (17%) from 2022-2025.
APP COMPENSATION MODELS
- Organizations weigh multiple factors in APP compensation models, with location and schedule becoming more common considerations.
- For factors that inform APP base salary, ‘Specialty, Specialty Group or Service Line’ has the greatest influence with 84.5% prevalence. This is followed by ‘Experience’ at 70.3%.
- 33% utilize RN experience credit to determine APRN compensation. 51% of those who use RN experience have a similar policy for PAs with previous non-APP health care experience.
ADDITIONAL APP BENEFITS
- Organizations are boosting support for APPs with generous CME allowances, student loan forgiveness programs, and reimbursement for licensure and professional fees – a powerful tool for recruitment and retention.
- 85% of organizations provide a CME expense allowance with an average allowance of $2,500 at the 50th percentile.
- 78% offer student loan repayment.
KEY TAKEAWAYS
- Pay compression across all specialties is increasing, prompting organizations to be deliberate in how they differentiate pay including both pay levels and structures.
- CRNAs continue to be in strong demand, and organizations are leveraging multiple compensation levers to attract and retain them.
- Incentives for APPs have now surpassed 55% of organizations and continue to expand as APPs take on more provider-like responsibilities.
- Over the past five years, compensation for APP leaders has become more structured. Executive and director-level APPs are placed in separate pay ranges, while clinical- and manager-level leaders are paid premiums tied to their clinical responsibilities.
Learn more about our APP Compensation and Productivity Survey!
This survey provides organizations with the critical data they need to systematically track and benchmark market changes, which in turn helps managing strategic and financial planning for continued growth and success.
- Base pay, total cash compensation and total cost of benefits
- Productivity data and ratios, including collections and work RVUs
- Pay practices, including salary grades and ranges, shift differentials and extra shifts, on-call pay, education expenses, sign-on bonuses, retention bonuses and moving allowances
- APP incentive plan design, including prevalence and performance measures
- Data reported for nurse practitioners and physician assistants across multiple specialty groups
- Data also reported for certified anesthesiologist assistants, certified registered nurse anesthetists and certified nurse midwives
- Data reported both nationally and regionally by practice setting (inpatient/outpatient) and locale (urban/suburban/rural)
- Total cash compensation data for a number of APP leadership positions